. 2021 Aug 30;12(1):5180.
doi: 10.1038/s41467-021-25439-0.

Phospholamban antisense oligonucleotides improve cardiac function in murine cardiomyopathy

Affiliations

Phospholamban antisense oligonucleotides improve cardiac function in murine cardiomyopathy

Niels Grote Beverborg et al. Nat Commun. .

Abstract

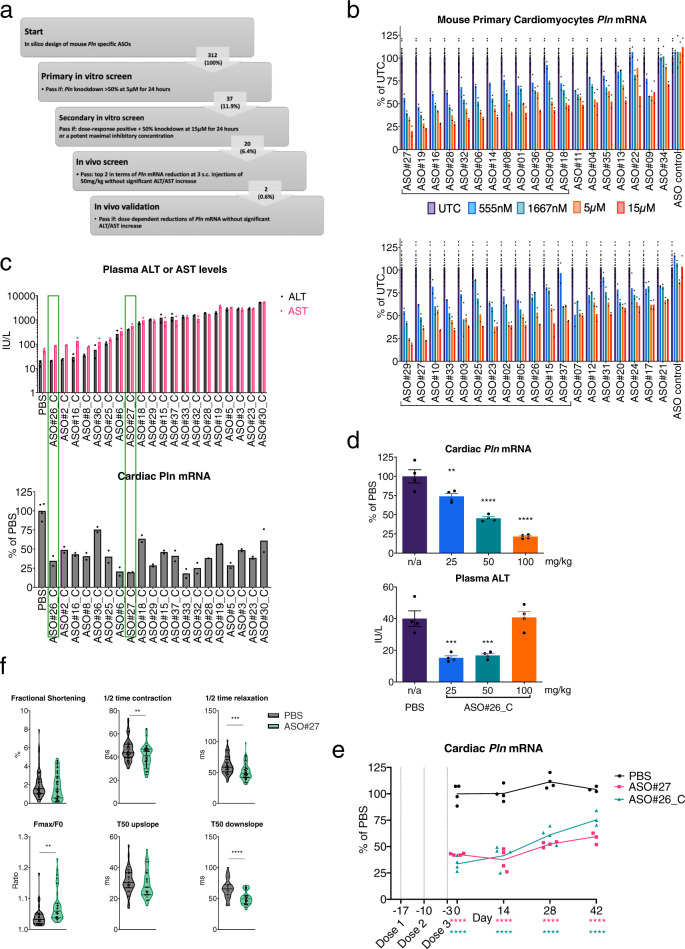
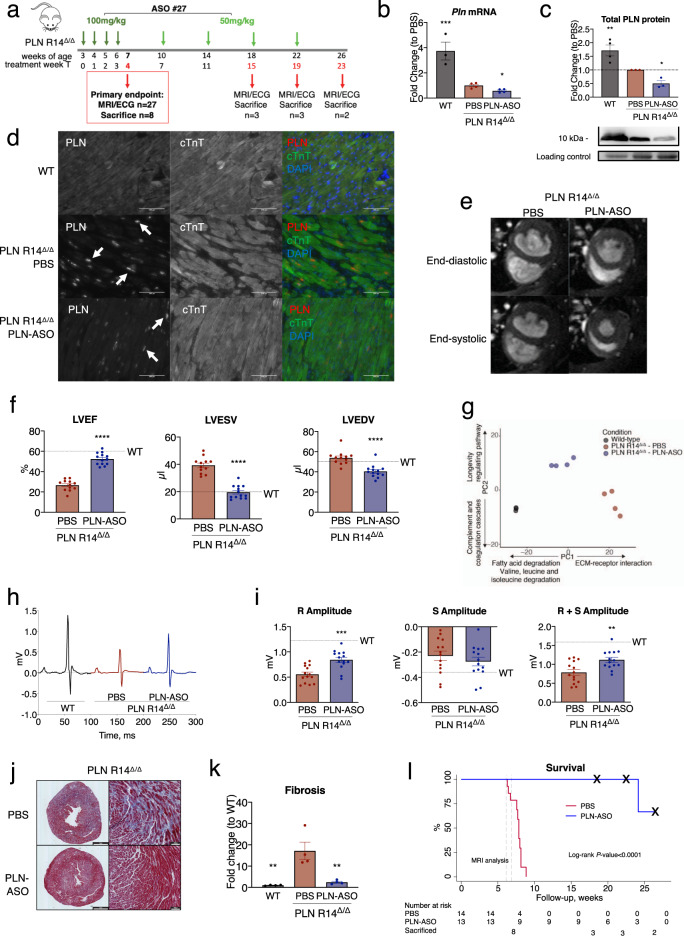
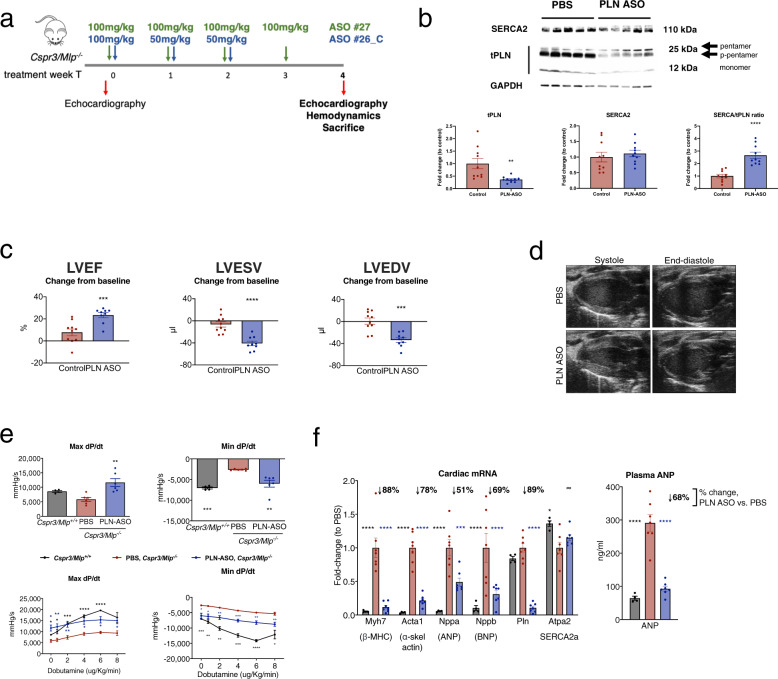
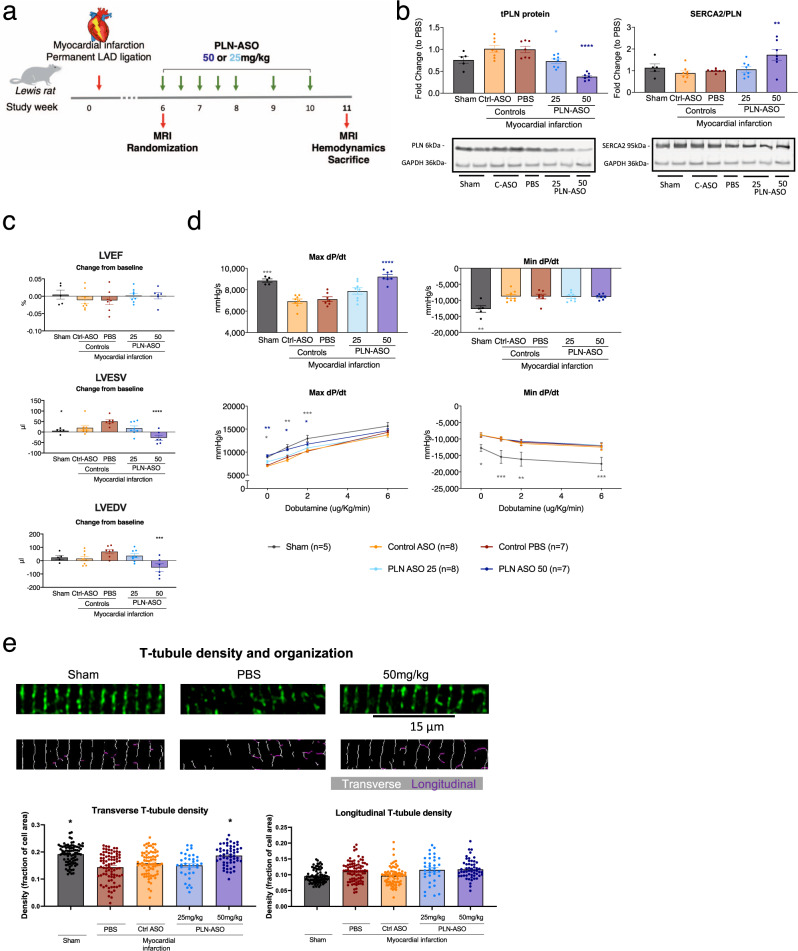
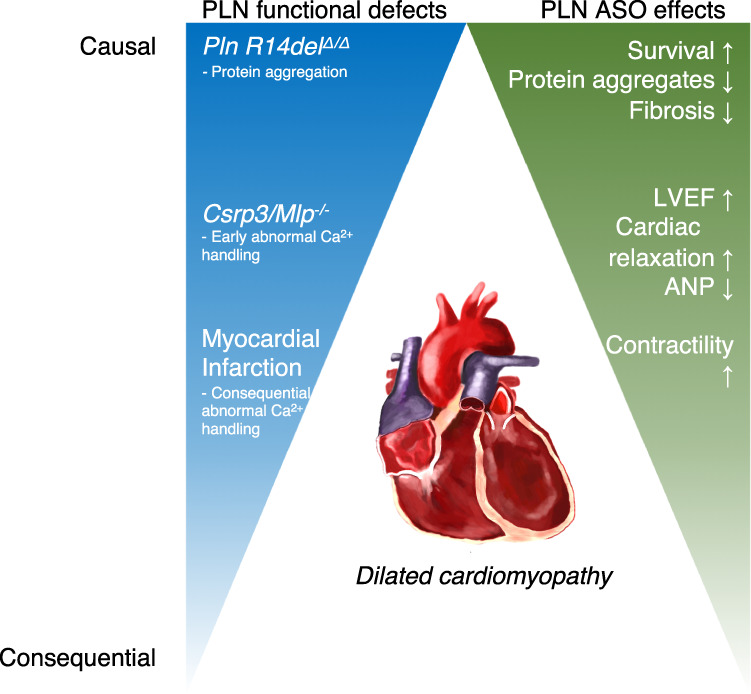
Heart failure (HF) is a major cause of morbidity and mortality worldwide, highlighting an urgent need for novel treatment options, despite recent improvements. Aberrant Ca2+ handling is a key feature of HF pathophysiology. Restoring the Ca2+ regulating machinery is an attractive therapeutic strategy supported by genetic and pharmacological proof of concept studies. Here, we study antisense oligonucleotides (ASOs) as a therapeutic modality, interfering with the PLN/SERCA2a interaction by targeting Pln mRNA for downregulation in the heart of murine HF models. Mice harboring the PLN R14del pathogenic variant recapitulate the human dilated cardiomyopathy (DCM) phenotype; subcutaneous administration of PLN-ASO prevents PLN protein aggregation, cardiac dysfunction, and leads to a 3-fold increase in survival rate. In another genetic DCM mouse model, unrelated to PLN (Cspr3/Mlp-/-), PLN-ASO also reverses the HF phenotype. Finally, in rats with myocardial infarction, PLN-ASO treatment prevents progression of left ventricular dilatation and improves left ventricular contractility. Thus, our data establish that antisense inhibition of PLN is an effective strategy in preclinical models of genetic cardiomyopathy as well as ischemia driven HF.


Conflict of interest statement

A.H., Z.E., H.S., C.J.B., M.F., E.R. and W.E.L. declare no competing interest. D.S., R.K., A.H., M.Z., M.P., S.P., T.A., Q.W., R.F. and K.H. are employees of AstraZeneca. S.Y., S.D. and A.E.M. are employees of Ionis Pharmaceuticals. N.G.B., T.R.E., H.S., N.B., M.F.H., R.A.B. and P.v.d.M. are employees of the UMCG which received research grants and/or fees from AstraZeneca, Abbott, Bristol-Myers Squibb, Novartis, Novo Nordisk, and Roche. K.R.C. is a member of the Scientific Advisory Board and receives research support from Astrazeneca, and is a Co-Founder and Equity holder in Moderna Therapeutics. R.d.B. received speaker fees from Abbott, AstraZeneca, Novartis, and Roche.

Figures

Fig. 1
Fig. 1. A large in vitro and in vivo screen resulting in a PLN ASO that dose-dependently decreases cardiac Pln mRNA and improves in vitro calcium fluxes.
a Schematic illustration of experimental steps leading to identification of 2 mouse PLN ASO leads for in vivo studies. b Results of secondary in vitro screen illustrating Pln mRNA reductions in primary mouse cardiomyocytes in a dose–response comparison. ASO candidates were selected (20) based on demonstrated dose–response and >50% Pln mRNA reduction after 24 h of treatment, N = 24 for untreated control (UTC) and N = 2 for each PLN ASO. c Selection of 2 ASO leads from in vivo screen in healthy C57BL/6 mice based on heart Pln mRNA reductions and plasma ALT and AST after 3 s.c. injections of 50 mg/kg, N = 4 for PBS and N = 2 for each PLN ASO. d In vivo dose–response reductions of cardiac Pln mRNA by PLN-ASO#26_C (s.c. administration of 3 × 25, 50 or 100 mg/kg, analysis after 2 weeks) and plasma analysis for ALT levels, N = 4 per group. e Comparable sustained cardiac Pln mRNA downregulation achieved with 3 × 50 mg/kg (day −17, −10, and −3) palmitate PLN-ASO#26_C and 3 × 100 mg/kg (day 0, 7, and 14) nonconjugated PLN-ASO#27. Protein analysis was performed on day 17, 31, 45, and 56, N = 4 per group. f In vitro response to 30 h exposure to 15 μM ASO#27 or PBS. Neonatal mouse cardiomyocytes were cultured on micropatterned flexible substrates in islands. Fractional shortening was determined using the BASiC technique (N = 51 for PBS and N = 57 for PLN ASO), and 20 min Fluo-4 incubation was performed to assess calcium cycling (N = 34 for PBS [N = 33 for T50 downslope] and N = 31 for PLN ASO). Violin plots with individual dots and median and interquartile range or histograms with standard error of the mean (SEM) are depicted. Students’ T test and one-way analyses of variance were used for statistical analysis. Asterix denotes significance level based on two-sided P values compared to PBS with: *P value < 0.05; **P value < 0.01; ***P value < 0.001; ****P value < 0.0001. ASO antisense oligonucleotide, ALT Alanine transaminase, AST Aspartate transaminase, UTC untreated control, Fmax maximal fluorescence, F0, minimal fluorescence. Source data are provided as a Source Data file.
Fig. 2
Fig. 2. Repeated subcutaneous injection of PLN ASO in mice with PLN R14Δ/Δ prevents cardiac dysfunction and improves survival.
a Experimental design of the PLN R14Δ/Δ intervention study, consisting of ASO#27 treatment with a 4-week loading phase with weekly dosing of 100 mg/kg and a 20-week maintenance phase with dosing of 50 mg/kg once every 4 weeks. Data points for functional and biochemical assessments were obtained at treatment week 4 (T4) which was the primary endpoint, 15 (T15), 19 (T19), and 23 (T23) at the end of the study. b SYBR green qPCR results of cardiac Pln mRNA expression (n = 3 for wild-type [WT] and n = 4 for PBS and PLN-ASO). c Semi-quantified western blot analysis of PLN protein expression using LV protein lysates. Intensities were normalized to total protein loading control and the PBS treated mice (n = 3 per group). d Immunofluorescence of WT, PBS treated and PLN-ASO treated PLN R14Δ/Δ mice after 4 weeks treatment. Sections were co-stained for cardiac Troponin T (green), PLN (red), and DAPI (blue). Note the lower presence of visible PLN aggregations (white arrows) and the higher structural integrity of the PLN-ASO treated hearts vs. PBS control. Stainings were performed in two animals per group. e Representative MRI images after 4 weeks of treatment. f Quantification of LVEF (left ventricular ejection fraction), LVESV (left ventricular end-systolic volume), and LVEDV (left ventricular end-diastolic volume) (n = 12 for PBS T4, n = 13 for PLN-ASO T4). Wild-type data were previously published, and the average is presented here for reference. g Principle component analysis plot of the first 2 principle components derived from the RNA-sequencing of mice left ventricles. h Representative ECG tracing of mice after 4 weeks of treatment. i Quantification of R, S, and R + S amplitude (n = 14 for T4) Wild-type data were previously published and the average is presented here for reference. j Representative Masson’s trichrome staining after 4 weeks of treatment of PBS and PLN-ASO treated PLN R14Δ/Δ cardiac sections. Stainings were performed in four animals per group. k Quantification of myocardial fibrosis based on Masson’s trichrome staining whereby the blue, fibrotic area is presented as the fold change compared to wild-type in percentage of the total tissue slice surface (n = 4 for all groups). l Kaplan–Meier survival plot of PLN R14Δ/Δ animals treated with PLN-ASO (n = 13) and PBS (n = 14). Three PBS treated animals died during MRI imaging, the other PBS treated animals died at around 8 weeks of age. The “x” marks the 3-time points at which animals were sacrificed for tissue analyses. One-way analysis of variance was used for statistical analyses, with PBS treated animals as the reference group in multiple comparison analyses. Asterix denotes significance level based on two-sided P values compared to PBS with: *P value < 0.05; **P value < 0.01; ***P value < 0.001; ****P value < 0.0001. Single values are depicted, and error bars represent the standard error of the mean (SEM). ASO antisense oligonucleotide, MRI magnetic resonance imaging, and ECG electrocardiogram. Source data are provided as a Source Data file.
Fig. 3
Fig. 3. Repeated subcutaneous injection of PLN ASO in Cspr3/Mlp−/− mice reverses signs and symptoms of heart failure.
a Experimental design of the PLN-ASO Cspr3/Mlp−/− intervention study. Repeated studies were run with either PLN-ASO #27 (100 mg/kg on Days 0, 7, 14, and 21) or PLN-ASO #26_C (100 mg/kg on day 0, 50 mg/kg on days 7 and 14) (Supplementary Data 1). Echocardiography was performed at baseline (i.e., before treatment initiation), and at end of study (i.e., after 28 days of treatment), followed by termination of animals. Hemodynamic assessment was done between day 24 and 28. b Representative Western blot of LV protein lysates stained for PLN protein to detect the monomer and pentamer. Protein loading was normalized to GAPDH and total PLN protein were semi-quantified by calculating intensities relative to PBS treated control (PBS n = 10, PLN-ASO #26_C n = 10). c Individual echocardiography assessment and quantification of left ventricular ejection fraction (LVEF), left ventricular end-systolic volume (LVESV), and left ventricular end-diastolic volume (LVEDV) 28 days after treatment relative to baseline measurements. Cspr3/Mlp−/− mice with LVEF ≤ 45% at study initiation were included in analysis, combination of study 1* + 2^ (PLN-ASO #26_C treated n = 6* + 3^, PBS treated n = 7*, Control-ASO n = 1^, and no injection n = 2^ (Supplementary Data 1)). d Representative B-MODE echocardiography image of a Cspr3/Mlp−/− heart 28 days post treatment with PBS or PLN-ASO#26_C. e Hemodynamic assessment of the maximum/minimum first derivative of LV pressure (Max dP/dt and Min dP/dt) was performed at 24–28 days following PLN-ASO_#27 or PBS treatment at baseline and upon increasing dobutamine doses of 0, 2, 4, 6, 8 µg/kg/min in a study 3 (n = 4 for Cspr3/Mlp+/+, n = 6 Cspr3/Mlp−/− PBS, and n = 6 Cspr3/Mlp−/− PLN-ASO_#27. For this study cohort Cspr3/Mlp−/− mice were selected based on high plasma ANP levels (>119 ng/ml) and randomized into treatment groups based on LVEF baseline levels (Supplementary Data 1)). f RT-PCR fold change analysis of transcriptional heart failure markers and plasma ANP ELISA in Cspr3/Mlp−/− PBS (n = 7) and Cspr3/Mlp−/− PLN-ASO #27 (n = 7) mice relative to non-HF Cspr3/Mlp+/+ mice (n = 4) after 4 weeks of treatment. Students’ T test, one and two-way analysis of variance were used for analyses, with PBS/vehicle-treated animals as the reference group in multiple comparison analyses. Asterix denotes significance level based on two-sided P values compared to PBS/vehicle control with: *P value < 0.05; **P value < 0.01; ***P value < 0.001; ****P value < 0.0001. Single values are depicted, and error bars represent standard error of the mean (SEM). ASO antisense oligonucleotide, ANP atrial natriuretic peptide. Source data are provided as a Source Data file.
Fig. 4
Fig. 4. Repeated subcutaneous injection of PLN ASO in rats with a myocardial infarction improves improves contractility and reduces cardiac dimensions.
a Experimental design of the rat post myocardial infarction intervention study. Six weeks after myocardial infarction, induced by permanent left anterior descending (LAD) artery ligation, an MRI was performed, and rats were randomized into groups. Treatment of ASO#136 was initiated at a 2× weekly dosing for the first 2 weeks followed by 1× weekly dosing (sham n = 5, PBS n = 7, Control-ASO n = 8 (50 mg/kg), PLN-ASO low dose n = 8 (25 mg/kg), and PLN-ASO high-dose n = 7 (50 mg/kg)). MRI, invasive hemodynamics and sacrifice was performed 5 weeks after treatment initiation, 11 weeks after myocardial infarction. b Western blot results of LV protein lysates stained for PLN and SERCA2 protein and semi-quantified relative to PBS treated control samples, intensities were normalized to GAPDH (n = 5 for sham, n = 7 for PBS and PLN-ASO 50 mg/kg, and n = 8 for control ASO and PLN-ASO 25 mg/kg). Representative image of 1 out of 4 membrane stains (Supplementary Fig. 20). Ratio of SERCA2 to PLN is shown as fold change relative to PBS. c Individual MRI assessment and quantification of the change in left ventricular ejection fraction (LVEF), left ventricular end-systolic volume (LVESV), and left ventricular end-diastolic volume (LVEDV) between treatment initiation (6 weeks post MI) and 5 weeks after start of treatment showing (n = 5 for sham, n = 7 for PBS, n = 8 for control ASO, n = 8 for PLN-ASO 25 mg/kg, and n = 6 for PLN-ASO 50 mg/kg). d Hemodynamic assessment of the maximum/minimum first derivative of LV pressure (Max dP/dt and Min dP/dt) performed at study end, 5 weeks after treatment start, at baseline and upon increasing dobutamine doses of 0, 1, 2, and 6 µg/kg/min (n = 5 for sham, n = 7 for PBS and PLN-ASO 50 mg/kg and n = 8 for control ASO and PLN-ASO 25 mg/kg). e Left ventricular sections from all treatment groups were stained for Caveolin-3 to visualize t-tubules. The density and proportions of transverse and longitudinally-oriented elements were determined using custom-made software in MatLab (see methods for details). Number of cells/animals analyzed: sham: n = 83 (rats n = 5), PBS n = 82 (rats n = 5), control ASO n = 76 (rats n = 4), PLN-ASO 25 mg/kg n = 35 (rats n = 3), and PLN-ASO 50 mg/kg n = 54 (rats n = 5). A repeated measures model with one-sided paired contrasts was used to compare the mean differences between treatments and a control group (PBS). Dunnett’s test was used to adjust p values for multiple contrasts with the vehicle/reference group. For other data, one or two-way analysis of variance was used for analyses, with PBS treated animals as the reference group in multiple comparison analyses. Asterix denotes significance level based on two-sided P values compared to PBS with: *P value < 0.05; **P value < 0.01; ***P value < 0.001; ****P value < 0.0001. Single values are depicted, and error bars represent standard error of the mean (SEM). ASO antisense oligonucleotide, LAD left anterior descending artery, MRI magnetic resonance imaging. Source data are provided as a Source Data file.
Fig. 5
Fig. 5. A graphical study summary showing increased beneficial PLN ASO treatment effects with increased contribution of PLN to disease.
Summary figure of study results. Three murine models of a dilated cardiomyopathy were studied, including the genetically engineered mouse models of PLN R14Δ/Δ and Csrp3/Mlp−/−, and the rat myocardial infarction model. PLN functional defects are causative to the pathology observed in PLN R14Δ/Δ, early contributing to the pathology in Csrp3/Mlp−/−, and consequential and aggravating in myocardial infarction. In line with this, the beneficial effects of the PLN-ASO were most abundant in the PLN R14Δ/Δ and Csrp3/Mlp−/− models, showing almost complete prevention or reversal of disease phenotype. In our myocardial infarction model, the PLN-ASO restored cardiac dimensions and contractility, but not relaxation or left ventricular ejection fraction. ASO antisense oligonucleotide, ANP atrial natriuretic peptide.

References

    1. Chang PP, et al. Trends in hospitalizations and survival of acute decompensated heart failure in four US communities (2005–2014) Circulation. 2018;138:12–24. doi: 10.1161/CIRCULATIONAHA.117.027551. - DOI - PMC - PubMed
    1. Mamas MA, et al. Do patients have worse outcomes in heart failure than in cancer? A primary care-based cohort study with 10-year follow-up in Scotland. Eur. J. Heart Fail. 2017;19:1095–1104. doi: 10.1002/ejhf.822. - DOI - PubMed
    1. Dagenais, G. R. et al. Variations in common diseases, hospital admissions, and deaths in middle-aged adults in 21 countries from five continents (PURE): a prospective cohort study. Lancet10.1016/s0140-6736(19)32007-0 (2019). - PubMed
    1. Gheorghiade, M. et al. Developing new treatments for heart failure: focus on the heart. Circ. Heart Fail. 9, 1–8 (2016). - PubMed
    1. Bers DM. Calcium cycling and signaling in cardiac myocytes. Annu. Rev. Physiol. 2008;70:23–49. doi: 10.1146/annurev.physiol.70.113006.100455. - DOI - PubMed

Publication types

MeSH terms