. 2021 Aug 30;12(1):5175.
doi: 10.1038/s41467-021-25525-3.

NTS Prlh overcomes orexigenic stimuli and ameliorates dietary and genetic forms of obesity

Affiliations

NTS Prlh overcomes orexigenic stimuli and ameliorates dietary and genetic forms of obesity

Wenwen Cheng et al. Nat Commun. .

Abstract

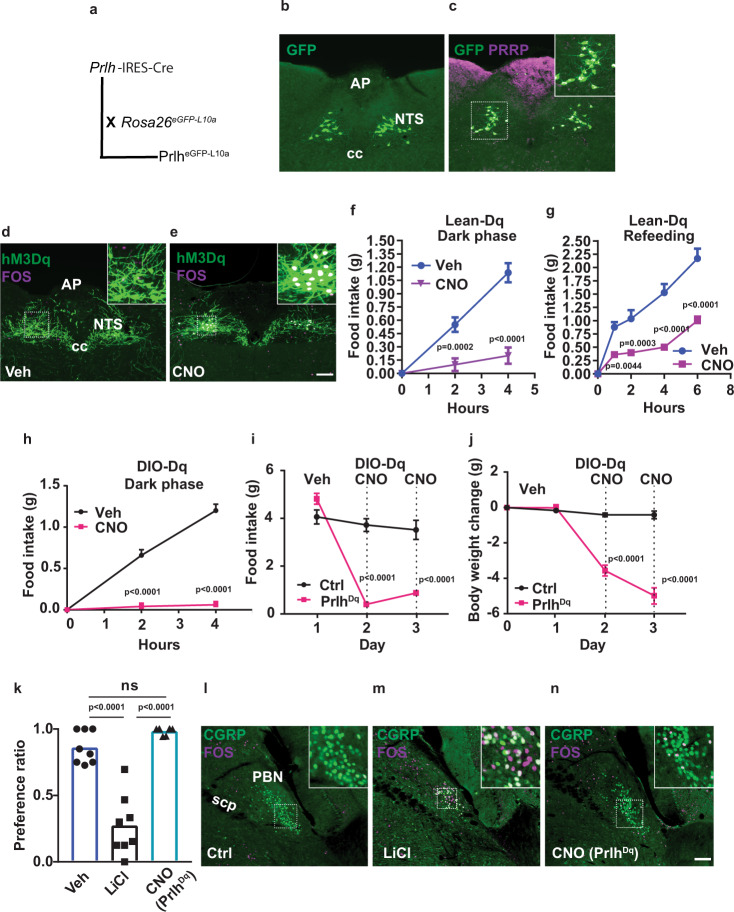
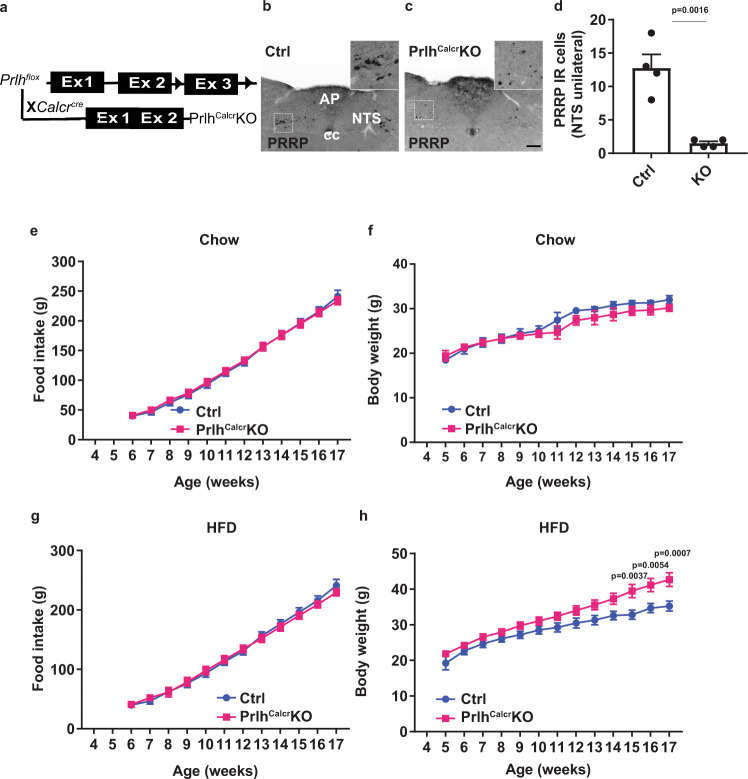
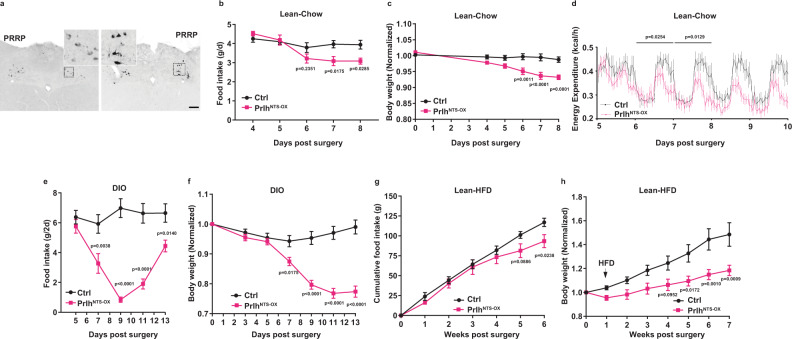
Calcitonin receptor (Calcr)-expressing neurons of the nucleus tractus solitarius (NTS; CalcrNTS cells) contribute to the long-term control of food intake and body weight. Here, we show that Prlh-expressing NTS (PrlhNTS) neurons represent a subset of CalcrNTS cells and that Prlh expression in these cells restrains body weight gain in the face of high fat diet challenge in mice. To understand the relationship of PrlhNTS cells to hypothalamic feeding circuits, we determined the ability of PrlhNTS-mediated signals to overcome enforced activation of AgRP neurons. We found that PrlhNTS neuron activation and Prlh overexpression in PrlhNTS cells abrogates AgRP neuron-driven hyperphagia and ameliorates the obesity of mice deficient in melanocortin signaling or leptin. Thus, enhancing Prlh-mediated neurotransmission from the NTS dampens hypothalamically-driven hyperphagia and obesity, demonstrating that NTS-mediated signals can override the effects of orexigenic hypothalamic signals on long-term energy balance.


Conflict of interest statement

CJR is an employee of and holds stock in AstraZeneca. DPO and MGM, Jr. receive research funding from AstraZeneca and Novo Nordisk. The other authors declare that they have no conflicts of interest relevant to this paper.

Figures

Fig. 1
Fig. 1. Prlhcre mice reveal roles for PrlhNTS neurons in the control of food intake in lean and DIO mice.
A Schematic diagram showing the PrlhCre mouse strain and its breeding onto the ROSA26eGFP-L10a background to generate PrlheGFP-L10a reporter mice. B, C Representative images showing GFP-IR (green) alone (B) or together with PRRP-IR (magenta) (C) in the NTS of a PrlheGFP-L10a reporter mouse. Inset in (C) shows digitally zoomed images of the boxed region. D, E Representative images showing mCherry-IR (hM3Dq, green) and FOS-IR (magenta) in the NTS of PrlhNTS-Dq mice following treatment with saline (D, Veh) or CNO (E, IP, 1 mg/kg) for 2 h before perfusion. F, G We examined food intake in chow-fed PrlhNTS-Dq mice over the first 4 h of the dark phase (F, n = 8 animals/group) and during the first 6 h of refeeding in the light cycle following an overnight fast (G, n = 7 animals/group) during treatment with CNO (IP, 1 mg/kg) or Veh. H DIO PrlhNTS-Dq mice were treated with Veh or CNO (IP, 1 mg/kg) immediately prior to the onset of the dark cycle and food intake was measured over the subsequent four hours. I, J DIO Control (Ctrl, n = 5 animals/group) or PrlhNTS-Dq (PrlhDq, n = 6 animals/group) mice were treated with Veh for two baseline days, followed by two days with CNO (a single IP 1 mg/kg dose at the onset of the dark cycle followed by 3.33 mg/ml in drinking water for the duration of treatment) and daily food intake (I) and body weight change from baseline (J) were determined. Vehicle (Veh) and CNO treatment are denoted on the graphs. K Mice were treated with vehicle (Veh), LiCl, or CNO (IP) during exposure to a novel tastant (HFD); their consumption of HFD given a choice between chow and HFD was determined the following day; n = 8 animals/group. LN Representative images showing PBN FOS-IR (purple) and GFP-IR (CGRP, green) in control mice (Ctrl), mice treated with LiCl (IP, 126 mg/kg), or in PrlhNTS-Dq mice treated with CNO (IP, 1 mg/kg); all mice were on the CGRPGFP background. Shown is mean + /− SEM. Two-way ANOVA, sidak’s multiple comparisons test was used; p values are shown for significant comparisons. All images taken at same magnification; scale bar equals 150 µm. ns: not significant vs Veh (p > 0.05). All experiments were repeated in two independent cohorts of animals with similar results; cohorts were combined for publication.
Fig. 2
Fig. 2. Silencing PrlhNTS neurons promotes DIO.
A Representative NTS image showing dsRed-IR (red, mCherry) from Prlhcre mice injected with mCherry-expressing AAVFlex-hM4DI (PrlhNTS-hM4Di) in NTS. B Food intake during the first 6 h following an overnight fast in PrlhNTS-hM4Di mice during treatment with vehicle (Veh) or CNO injection (IP, 1 mg/kg), n = 8 in each group. C Representative NTS images showing dsRed-IR (red, left panel) and GFP-IR (green, right panel) from Prlhcre mice injected with mCherry-expressing control AAV (PrlhNTS-mCherry; Ctrl, left panel) or GFP-expressing AAVFlex-TetTox (PrlhNTS-TetTox, right panel). D Body weight of control (Ctrl) and PrlhNTS-TetTox mice following surgery, during which time they were fed with chow for 7 weeks and HFD for an additional 6 weeks. EH Food intake (E, G) and body composition (F, H) at the end of the 7th week (F) and 13th week (H) after surgery for Ctrl and PrlhNTS-TetTox mice during Chow (E, F, n = 6 animals/group) and HFD (G, H, n = 4 Ctrl animals and n = 6 PrlhNTS-TetTox animals) feeding. Shown is mean + /− SEM. Two-way ANOVA, sidak’s multiple comparisons test was used: p values are shown for significant comparisons. All images were taken at the same magnification; scale bar equals 150 µm. All experiments were repeated in two independent cohorts of animals with similar results; cohorts were combined for publication.
Fig. 3
Fig. 3. Deletion of Prlh from CalcrNTS cells exacerbates DIO.
A Schematic diagram showing the cross of PrlhFlox onto the Calcrcre background to generate Calcrcrecre; Prlhflox/flox (PrlhCalcrKO) mice. B, C Representative images showing PRRP-IR in the NTS of Calcrcre/cre; Prlh+/+ control (B, Ctrl) and PrlhCalcrKO (C) mice. Insets show digital zooms of the boxed regions. All images taken at same magnification; scale bar equals 150 µm. D Quantification of PRRP-IR in the NTS of control (Ctrl) and PrlhCalcrKO mice, as in B, C; n = 4 animals/group. EH Weekly food intake (E, G) and body weight (F, H) for Ctrl and PrlhCalcrKO fed with chow (E, n = 7 animals/group; F, n = 6 Ctrl animals and n = 10 PrlhCalcrKO animals) or HFD (G, H) from the time of weaning at 4 weeks of age. Shown is mean + /− SEM. Two-way ANOVA, sidak’s multiple comparisons test was used: p values are shown for significant comparisons. All experiments were repeated in two independent cohorts of animals with similar results; were generally combined for publication.
Fig. 4
Fig. 4. Increased Prlh expression in PrlhNTS neurons promotes negative energy balance.
A Representative images of PRRP-IR (black) in the NTS of control (Ctrl, left panel) or PrlhNTS-OX mice (right panel). All images were captured at the same magnification; scale bar equals 150 µm. Insets show digital zooms of the boxed regions. B, C Food intake (B) and body weight (C) for lean, chow-fed control (Ctrl) and PrlhNTS-OX mice following surgery (n = 5 Ctrl animals and n = 6 PrlhNTS-OX animals); body weight is shown normalized to baseline (pre-surgery) weight. D Energy expenditure for chow-fed control (Ctrl) and PrlhNTS-OX mice was determined in metabolic cages for days 5–9 following surgery (n = 8 per group). EH Food intake (E, G) and body weight (F, H) for control (Ctrl) and PrlhNTS-OX mice following surgery in (E, F) DIO (n = 6 Ctrl animals and n = 7 PrlhNTS-OX animals), and (G, n = 8 Ctrl animals and n = 5 PrlhNTS-OX animals, H, n = 10 animals/group) chow-fed mice switched to HFD 7 days post-surgery (n = 5–10 per group). Body weight is shown normalized to baseline (pre-surgery) weight. Shown is mean + /− SEM. Two-way ANOVA, sidak’s multiple comparisons test was used; p values are shown for significant comparisons. All experiments were repeated in two independent cohorts of animals with similar results; cohorts were combined for publication.
Fig. 5
Fig. 5. PrlhNTS action abrogates AgRP neuron-promoted food intake and weight gain.
A Schematic showing the stereotaxic injection of AAVFlex-hM3Dq into the NTS and AAVFlex-ChR2 plus optical fiber into the ARC of Prlhcre;Agrpcre mice. B Representative image of GFP-IR (ChR2, green) and FOS-IR (magenta) in the ARC of mice treated as in (A), following photostimulation for 1 h. C Cumulative food intake for the first 1 or 2 h of treatment for mice as in (A) that were unstimulated (black), photostimulated (blue), CNO-treated immediately prior to photostimulation (CNOPre, red), and CNO-treated following the first hour of photostimulation (CNOPost, purple); n = 9 animals in baseline group; n = 10 in light group; n = 7 in Light + CNOPre group, and n = 8 in Light + CNOPost group. D Schematic showing the stereotaxic injection of AAVFlex-hM3Dq into the ARC of Prlhcre;Agrpcre mice (AgRPDq mice); some mice also received AAVFlex-Prlh into the NTS (NTSPrlh;AgRPDq mice). E Representative image showing mCherry-IR (hM3Dq, green (pseudocolored)) and FOS-IR (magenta) in the ARC of NTSPrlh;AgRPDq mice following CNO treatment for 2 h. F Food intake during the first 4 h of the dark cycle for CNO (IP, 1 mg/kg)-treated mice of the designated experimental groups; n = 6 per group. GH Daily food intake (G) and body weight (H) (measured during the light cycle) for CNO (IP, 1 mg/kg)-treated mice of the designated experimental groups; n = 6 animals/group for Ctrl and NTSPrlh;AgRPDq; n = 5 animals in AgRPDq group. All graphs: shown is mean + /− SEM. Two-way ANOVA, sidak’s multiple comparisons test was used. Significant or near significant p values for comparisons to AgRPChR2 (C) or AgRPDq (F), and Ctrl group (GH) are shown in black; those for comparisons between AgRPDq and PrlhNTS-OX; AgRPDq groups are shown in green. All experiments were repeated in two independent cohorts of animals with similar results; cohorts were combined for publication. All images taken at the same magnification; scale bar equals 150 μm. 3 v = third cerebral ventricle.
Fig. 6
Fig. 6. PrlhNTS neurons and NTS Prlh block feeding and body weight gain in ob/ob and Ay mice.
AF Acute food intake (A, D; n = 6 animals/group) and daily food intake (B, n = 7 Ctrl animals, n = 6 ob/ob;PrlhNTS-Dq animals, and n = 5 ob/ob animals, E, n = 6 animals/group) and body weight change (C, n = 5 Ctrl animals, n = 6 animals per group for ob/ob and ob/ob;PrlhNTS-Dq, F, n = 6 animals/group; compared to baseline days 0–1) for control (Ctrl) and PrlhNTS-Dq mice on the Lepob/ob (ob/ob) or Ay background treated with vehicle for two to three days, CNO (IP, 1 mg/kg; treatment days indicated in panels) for two days, and vehicle for another one or two days. Lean control mice are also included. GJ Daily food intake (G, n = 5 animals per group, I, n = 7 Ctrl animals, n = 6 Ay animals, and n = 5 Ay;PrlhNTS animals) and body weight change relative to day 0 (H, n = 5 Ctrl animals, n = 6 animals/group for ob/ob and ob/ob;PrlhNTS-OX, J, n = 7 Ctrl animals, n = 6 Ay animals and n = 5 Ay;PrlhNTS-OX animals) for lean control (Ctrl) mice, ob/ob and ob/ob;PrlhNTS-OX mice (G, H) and Ay and Ay;PlrhNTS-OX mice (I, J). Shown is mean + /− SEM. Two-way ANOVA, sidak’s multiple comparisons test was used. Significant or near significant p values for comparisons between control mice and ob/ob or Ay groups shown in black; those for comparisons between ob/ob and ob/ob plus intervention or Ay and Ay plus intervention groups shown in green. All experiments were repeated in two independent cohorts of animals with similar results; cohorts were combined for publication.
Fig. 7
Fig. 7. Summary and model.
PrlhNTS neurons utilize Glutamate (GLU) and PRRP as neurotransmitters. Ablation of vGLUT2 to abrogate GLU signaling blocks the suppression of food intake during DREADD-mediated activation of PrlhNTS cells, but does not alter energy balance (A). In contrast, ablation of Prlh in the NTS does not alter the response to DREADD-mediated activation, but promotes obesity on HFD (B). Silencing PrlhNTS neurons increases food intake and promotes obesity during HFD exposure (C). Increased signaling by PrlhNTS cells, either via DREADD-mediated activation or Prlh overexpression decreases food intake and body weight in response to multiple obesogenic perturbations, including HFD feeding, AgRP neuron activation, or ob/ob or Ay genotype (D). Summary model is shown in (E).

References

    1. Dibner C, Schibler U. Circadian timing of metabolism in animal models and humans. J. Intern. Med. 2015;277:513–527. doi: 10.1111/joim.12347. - DOI - PubMed
    1. Jordan J, et al. Joint statement of the European Association for the study of obesity and the European Society of hypertension: obesity and difficult to treat arterial hypertension. J. Hypertension. 2012;30:1047–1055. doi: 10.1097/HJH.0b013e3283537347. - DOI - PubMed
    1. Kumanyika, S. Obesity, health disparities, and prevention paradigms: hard questions and hard choices. Prev. Chronic Dis. 2, A02 (2005). - PMC - PubMed
    1. Cheng W, et al. Calcitonin receptor neurons in the mouse nucleus tractus solitarius control energy balance via the non-aversive suppression of feeding. Cell Metab. 2020;31:301–312. e5. doi: 10.1016/j.cmet.2019.12.012. - DOI - PMC - PubMed
    1. Cheng, W. et al. Leptin receptor–expressing nucleus tractus solitarius neurons suppress food intake independently of GLP1 in mice. JCI insight. 5, e134359 (2020). - PMC - PubMed

Publication types

MeSH terms