. 2021 Aug 30;11(1):17359.
doi: 10.1038/s41598-021-96896-2.

Whole-genome sequencing of endangered Zhoushan cattle suggests its origin and the association of MC1R with black coat colour

Affiliations

Whole-genome sequencing of endangered Zhoushan cattle suggests its origin and the association of MC1R with black coat colour

Lihua Jiang et al. Sci Rep. .

Abstract

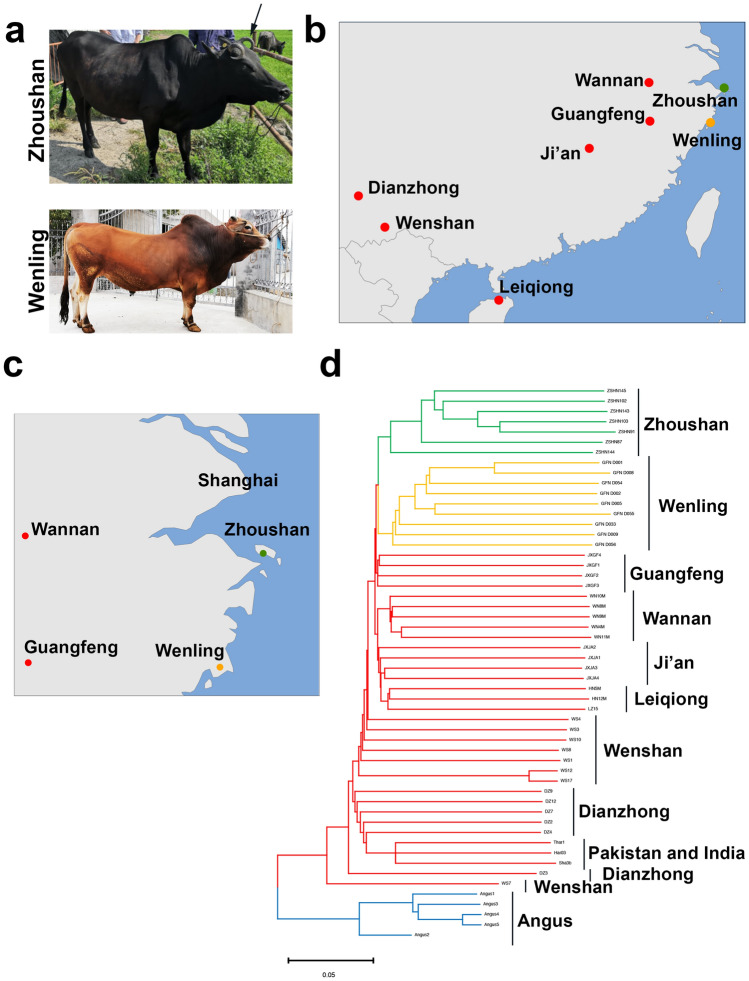
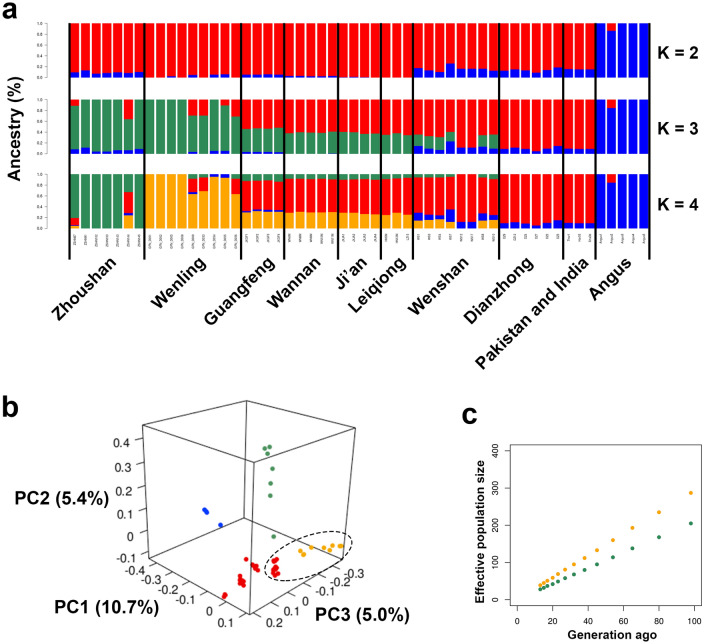
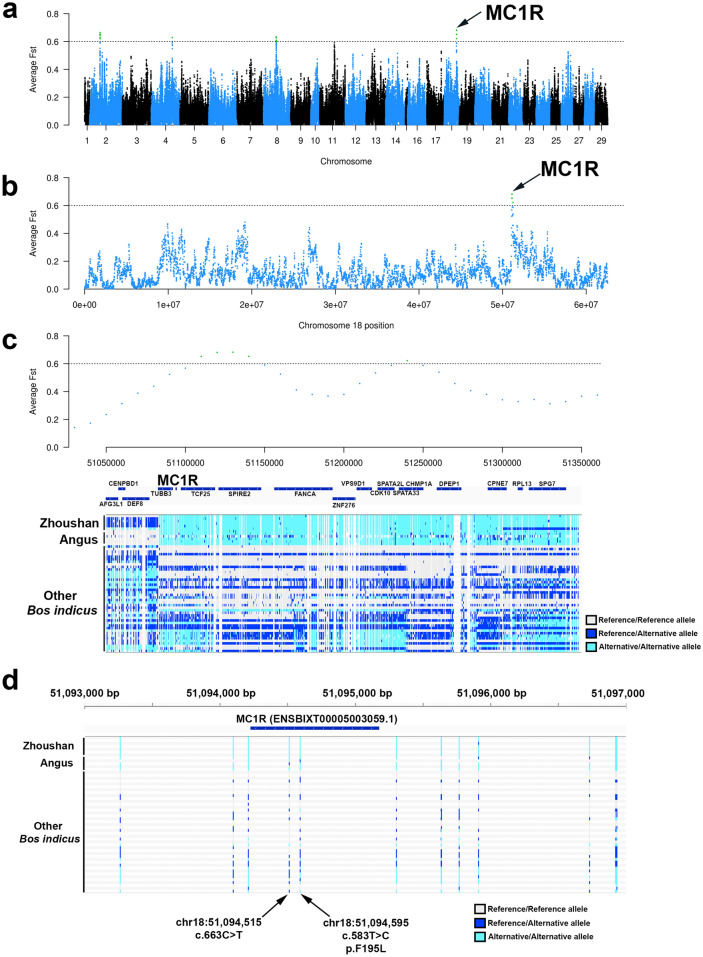
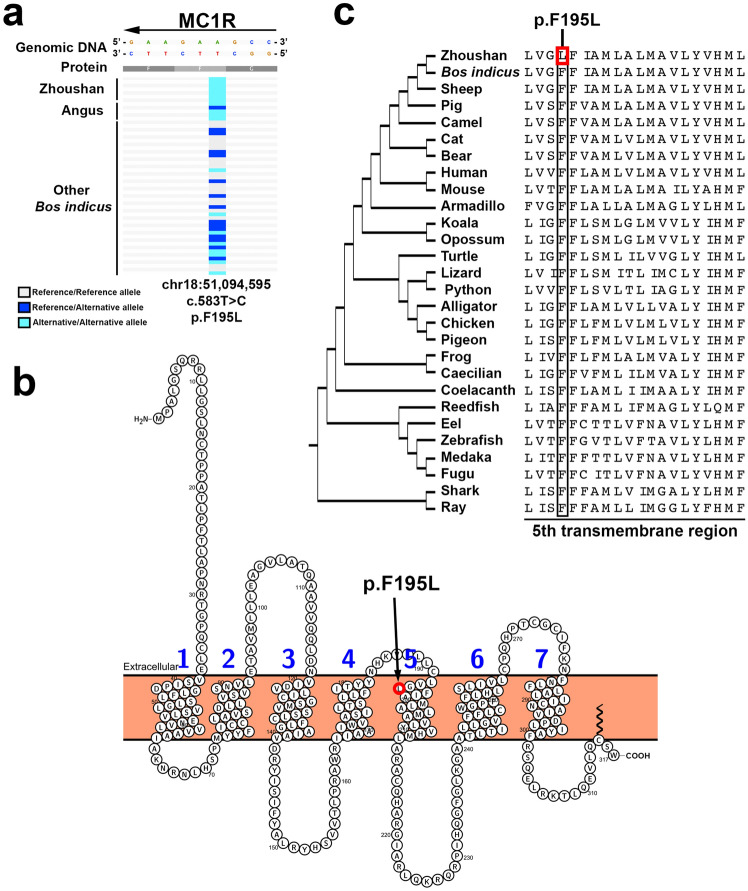
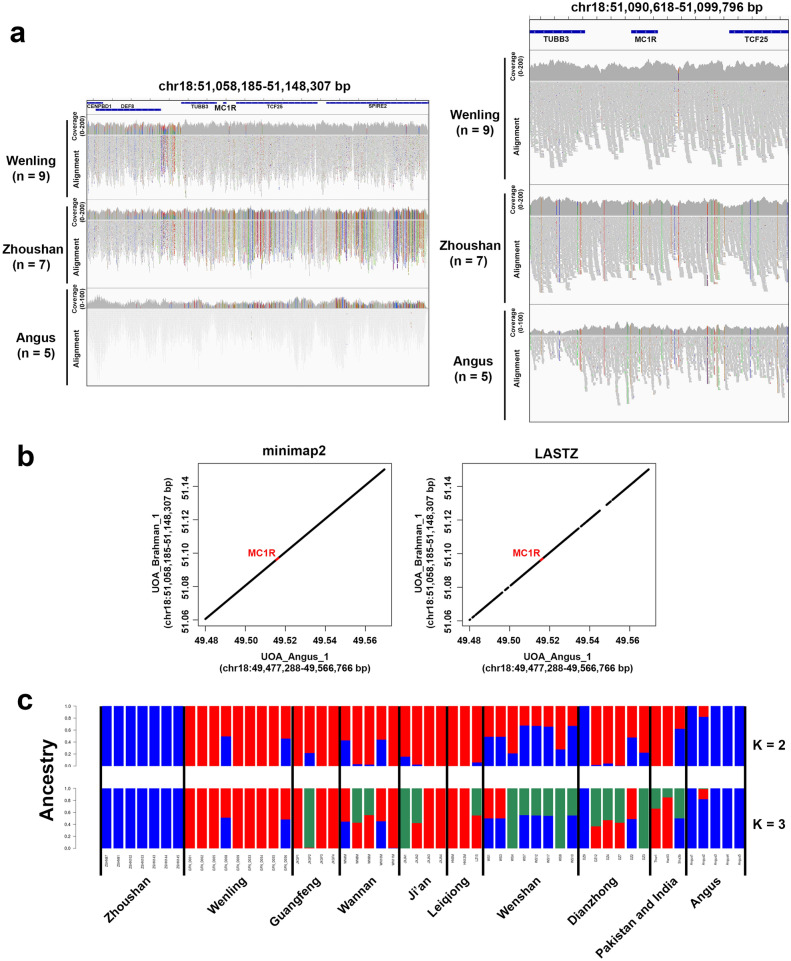
Zhoushan cattle are an endangered cattle breed in the Zhoushan islands in China. Since Zhoushan cattle have been bred in isolation, they show unique characteristics, such as dark black coat colour. However, no studies have been conducted on the genome of Zhoushan cattle. Here, we performed whole-genome sequencing of seven individuals of Zhoushan cattle and nine cattle in Wenling, geographically close to the Zhoushan islands. By integrating our data and publicly-available data, we found that Zhoushan cattle are genetically highly similar to Bos indicus cattle in south-eastern China. Furthermore, by identifying the genomic regions shared between Zhoushan cattle and Angus cattle, a Bos taurus breed, we found that the p.F195L mutation in melanocyte-stimulating hormone receptor (MC1R) could be associated with their dark black coat colour. Taken together, our results provide a valuable resource for characterising the uniqueness of Zhoushan cattle.


Conflict of interest statement

The authors declare no competing interests.

Figures

Figure 1
Figure 1
Phylogenetic analysis of Zhoushan cattle and other cattle breeds. (a) Gross appearance of Zhoushan (upper panel) and Wenling cattle (lower panel). Note that Zhoushan cattle have a dark black coat colour. The arrow indicates the curving horn of Zhoushan cattle. (b) Geographic map indicating the origins of Zhoushan (green dot) and Wenling (orange dot) cattle analysed in this study. We also examined other Chinese cattle (red dots) whose genome sequencing data were available. (c) Regional map around the Zhoushan islands. Wenling, Wannan, and Guangfeng are mainland regions close to the Zhoushan islands. (d) Neighbour-joining tree of the 54 domesticated cattle. The scale bar represents pairwise distances between different individuals. The maps were constructed by R and R packages of maps v3.3.0 (https://cran.r-project.org/web/packages/maps) and mapdata v2.3.0 (https://cran.r-project.org/web/packages/mapdata).
Figure 2
Figure 2
Admixture and principal component analysis of Zhoushan cattle and other cattle breeds. (a) Admixture plot (K = 2, 3, 4) for the 54 cattle individuals. Each individual is shown as a vertical bar divided into K colours. (b) PCA plot showing the genetic structure of the 54 cattle individuals. The degree of explained variance is given in parentheses. Colours reflect the geographic regions of sampling in Fig. 1d. The cluster composed of cattle in Wenling, Guangfeng, Wannan, Ji'an, and Leiqiong is highlighted in the black dotted ellipse. (c) Estimate of the effective population sizes of Zhoushan (green) and Wenling (orange) cattle over the past 100 generations.
Figure 3
Figure 3
Genomic regions associated with dark black coat colour of Zhoushan cattle. (a) Manhattan plot for average Fst values in 40 kb windows with 10 kb steps between Zhoushan cattle plus Angus and other B. indicus. A region with an average Fst of more than 0.6 is coloured in green. The arrow indicates the highest peak. The x-axis represents chromosomal positions, and the y-axis represents the average Fst values. (b) Manhattan plot on chromosome 18 for average Fst values in 40 kb windows with 10 kb steps between Zhoushan cattle, Angus, and other B. indicus. (c) Regional plot around the MC1R gene. The genotype of each individual at each variant site is shown. The genotype homozygous for the reference allele is coloured grey. Heterozygous variants are coloured blue. The homozygous genotype for alternative alleles is coloured light blue. Note that homozygous genotypes for alternative alleles are enriched in Zhoushan and Angus cattle in this region. (d) Regional plot showing the mutations around MC1R gene.
Figure 4
Figure 4
Secondary structure of MC1R and protein sequence alignment of MC1R orthologs. (a) Regional highlight of the c.583 T > C mutation of MC1R. The genomic region from 51,094,590 to 51,094,598 bp on chromosome 18 is shown. Note that MC1R is located on the reverse strand. (b) Secondary structure of MC1R. MC1R is a seven-transmembrane receptor. The p.F195L mutation is located in the 5th transmembrane region and enclosed by the red circle. This figure is generated by using the Protter server application. (c) Multiple sequence alignment of MC1R orthologs. The black rectangle highlights the 195th phenylalanine residues. The red rectangle encloses the p.F195L mutation in Zhoushan cattle. The cladogram of the species is shown to the left of the species name. The cladogram topology is derived from a previous study.
Figure 5
Figure 5
Read depth distribution, genome alignment and admixture analysis of the MC1R region. (a) Read depth distributions in the MC1R region. The left panel shows the read depth distributions in the region from 51,058,185 to 51,148,307 bp on chromosome 18. The right panel shows the read depth distributions in the region from 51,090,618 to 51,099,796 bp on chromosome 18. For each breed, the sequencing reads were integrated. The first track represents read depth distribution in each breed, and the second track represents read alignments to the reference genome. For a given base position, if the base call in the sequencing read and the corresponding base in the reference genome are different, adenine is shown in green, thymine in red, guanine in orange, and cytosine in blue. (b) Dot plots showing the genome alignments of the MC1R regions of the UOA_Angus_1 assembly (chr18:49,477,288–49,566,766 bp) and the UOA_Brahman_1 assembly (chr18:51,058,185–51,148,307 bp). The left panel shows the genome alignment by minimap2 aligner and the right one shows the genome alignment by LASTZ aligner. The region corresponding to the MC1R gene body is highlighted in red. (c) Admixture analysis of the MC1R region. The SNPs located in the MC1R region (chr18:51,058,185–51,148,307 bp) were collected and subjected to admixture analysis. The order of the samples is the same as in Fig. 2a.

References

    1. Porter V, Alderson L, Hall S, Sponenberg P. Mason’s World Encyclopedia of Livestock Breeds and Breeding. CAB International; 2016.
    1. Youlin J. Report on Domestic Animal Genetic Resources in China. China Agriculture Publishers; 2004.
    1. Chen N, et al. Whole-genome resequencing reveals world-wide ancestry and adaptive introgression events of domesticated cattle in East Asia. Nat. Commun. 2018;9:2337. doi: 10.1038/s41467-018-04737-0. - DOI - PMC - PubMed
    1. Jiang, Y. Where is the Chinese yellow cattle from?. Nat. Ecol. Evol.https://natureecoevocommunity.nature.com/posts/34309-where-is-the-chines.... (2018).
    1. Chen Y-C. Four interesting endangered breeds of animals in China. Anim. Genet. Resour. Inf. 1995;16:29–35. doi: 10.1017/S101423390000047X. - DOI

Publication types

Substances