. 2021 Aug 30;4(1):1015.
doi: 10.1038/s42003-021-02554-8.

Campylobacter jejuni genotypes are associated with post-infection irritable bowel syndrome in humans

Affiliations

Campylobacter jejuni genotypes are associated with post-infection irritable bowel syndrome in humans

Stephanie Peters et al. Commun Biol. .

Abstract

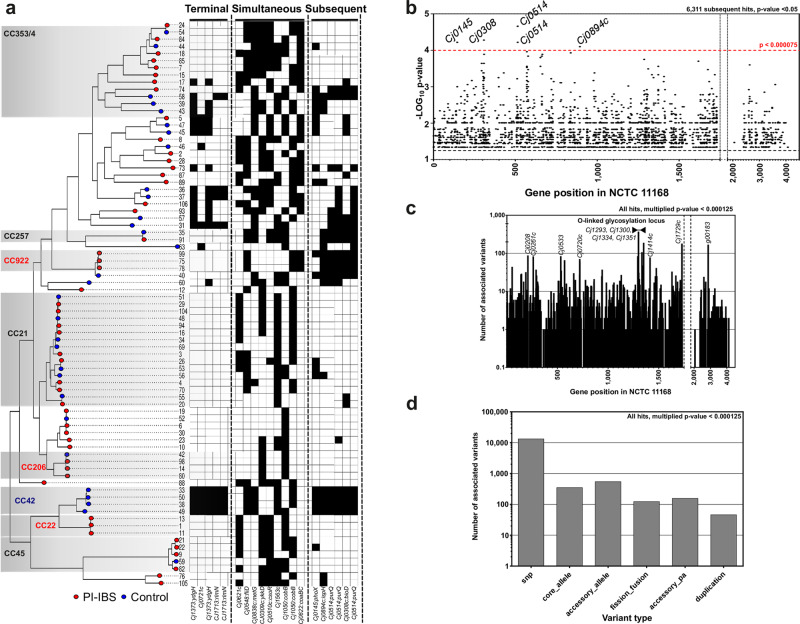
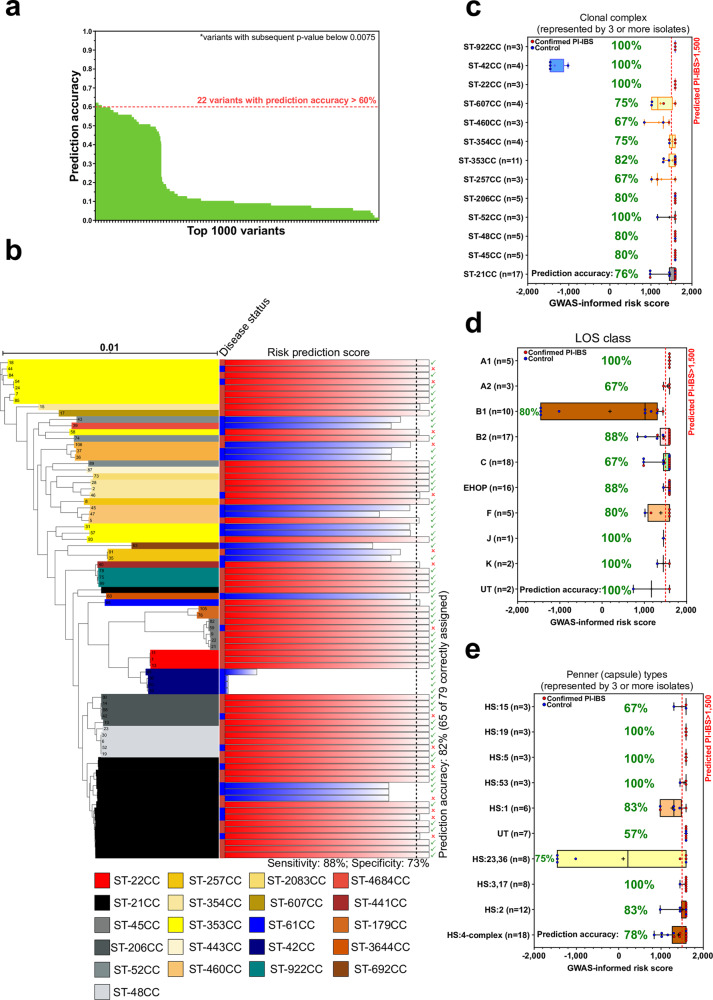
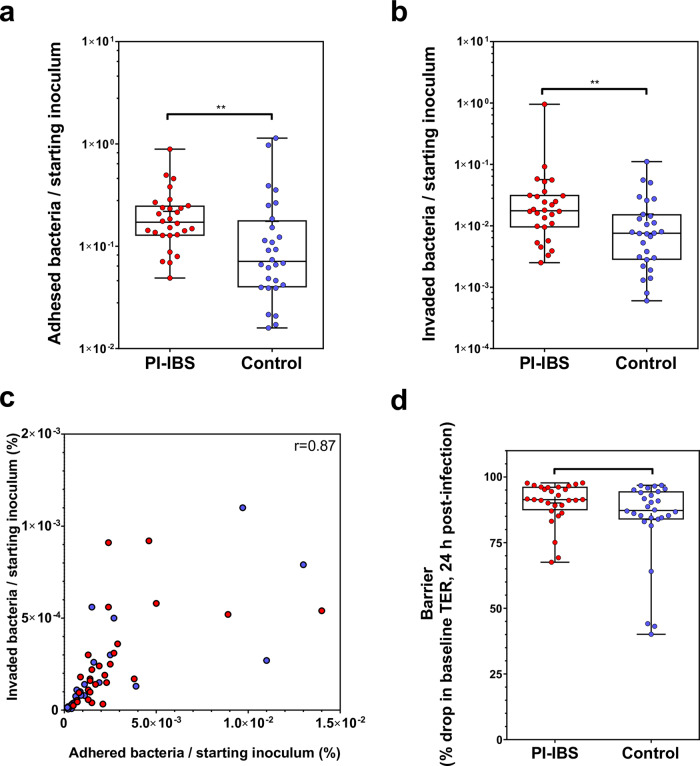
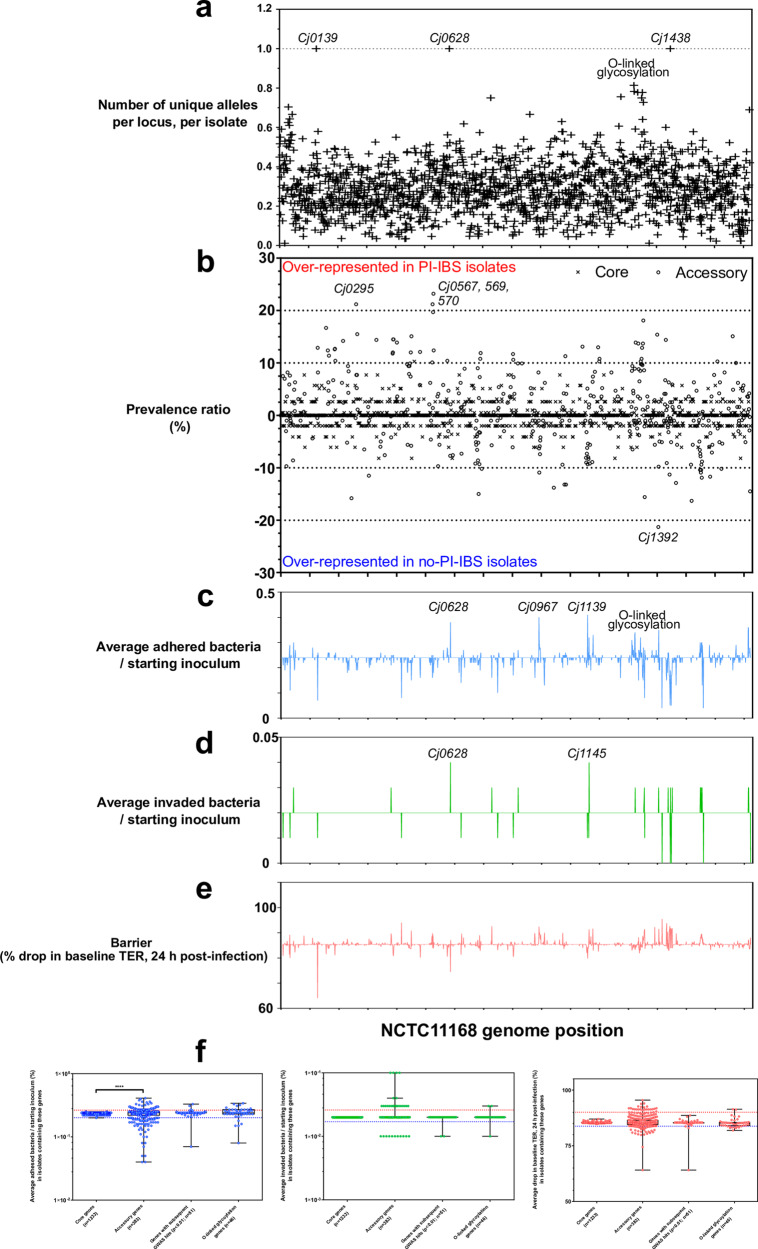
Campylobacter enterocolitis may lead to post-infection irritable bowel syndrome (PI-IBS) and while some C. jejuni strains are more likely than others to cause human disease, genomic and virulence characteristics promoting PI-IBS development remain uncharacterized. We combined pangenome-wide association studies and phenotypic assays to compare C. jejuni isolates from patients who developed PI-IBS with those who did not. We show that variation in bacterial stress response (Cj0145_phoX), adhesion protein (Cj0628_CapA), and core biosynthetic pathway genes (biotin: Cj0308_bioD; purine: Cj0514_purQ; isoprenoid: Cj0894c_ispH) were associated with PI-IBS development. In vitro assays demonstrated greater adhesion, invasion, IL-8 and TNFα secretion on colonocytes with PI-IBS compared to PI-no-IBS strains. A risk-score for PI-IBS development was generated using 22 genomic markers, four of which were from Cj1631c, a putative heme oxidase gene linked to virulence. Our finding that specific Campylobacter genotypes confer greater in vitro virulence and increased risk of PI-IBS has potential to improve understanding of the complex host-pathogen interactions underlying this condition.


Conflict of interest statement

The authors declare no competing interests.

Figures

Fig. 1
Fig. 1. Population structure of Campylobacter isolates collected in this study.
a A maximum-likelihood phylogeny was constructed with IQ-TREE, using a GTR model and ultrafast bootstrapping (1000 bootstraps; version 1.6.8), from an alignment of all isolates (n = 94). Scale bar represents a genetic distance of 0.01. Leaves from isolates that lead to an onset of PI-IBS are colored red and those that did not (control) are blue; isolates for which follow up date was incomplete are gray. The tree is annotated with MLST, LOS, and Penner (capsule) types, presence (colored block) and absence (no block) of common Campylobacter virulence factors (VFdB), antimicrobial resistance genes (ARG-ANNOT) and the presence of two previously characterized plasmids (pTet: NC008790 and pVir: NC008770; presence indicated if 75% of more plasmid genes present). Interactive visualization is available on Microreact: https://microreact.org/project/CampyIBS. b Ratio of how many isolates from each MLST clonal complexes (CC) lead to the onset of PI-IBS. Only CCs represented by three or more isolates are shown. Frequency of c clonal complexes, d LOS classes and e Penner types identified. p-value < 0.05 indicated with (*); Fisher’s LSD test. Raw data for (be) available in Supplementary Data 4.
Fig. 2
Fig. 2. Genome-wide association of genetic variants with onset of PI-IBS.
a ClonalFrame-ML phylogeny of PI-IBS isolates, with recombination masked. Red leaves are isolates from PI-IBS patients and leaves with blue circles are from control patients. Common disease-associated clonal complexes (CCs) are highlighted. Interactive visualization is available on Microreact: https://microreact.org/project/CampyIBS-CF. Matrix shows presence of variants most associated with IBS, which are labeled below (terminal, n = 5; simultaneous, n = 9; subsequent, n = 6). b Pangenome position of associated GWAS results (subsequent p-value < 0.05; n = 6,311; Table S4). Each circle represents a variant mapped to a position in the C. jejuni reference strain NCTC11168 or inferred pangenome from this study (Supplementary Data 5). Variants with the strongest association (p-value < 0.000075; n = 6) from four genes with homologs in NCTC11168 are annotated (Cj0145:phoX, Cj0308:bioD, Cj0514:purQ, and Cj0894c:ispH). c Hot spots of associated variants. The number of associated variants per gene in NCTC11168 and the pangenome (any association p-value < 0.05). Genes with more than 100 associated variants are annotated, including four from the O-linked glycosylation locus. d Breakdown of associated variant types (core genome SNPs, core and accessory alleles, gene fission/fusions, accessory gene presence, and gene duplications; any association p-value < 0.05, raw data are available in Supplementary Data 6).
Fig. 3
Fig. 3. Predicting risk of PI-IBS using risk markers derived from the primary GWAS.
a Ability of top 1,000 (of 6,311) variants from the GWAS to predict the onset of PI-IBS (variants with subsequent p-value below 0.0075). b ClonalFrame-ML phylogeny of IBS isolates, with recombination masked. IBS onset is denoted by red (PI-IBS) and blue (control) squares. Common disease-associated clonal complexes (CCs) are highlighted. Predicted risk score indicated by the red or blue bars (color denoting predicted outcome). High risk isolates scored above 1500 and small tick (✓) or cross (✗) indicated whether the prediction observed disease status. c Repartition of risk scores on 83 isolates used in the GWAS from acute C. jejuni infection, according to the onset of PI-IBS within 9 months. Each point corresponds to the risk score associated with a single isolate. Risk score was calculated by weighting the association score of the top 22 PI-IBS predictive variants (Table 2). PI-IBS was predicted with a score above 1500, which showed variation between lineages (disease outcome was correctly predicted in 65 of 83 isolates). d Repartition of risk-score prediction by LOS class and e Penner types. *All box plots show the 25th and 75th percentile, whiskers extending to the min and max values with all data points shown. Raw data for  (be) are available in Supplementary Data 9.
Fig. 4
Fig. 4. In vitro pathogenicity phenotypes of PI-IBS and control C. jejuni isolates.
a PI-IBS causing C. jejuni isolates demonstrate greater adhesion to T84 epithelial cells. b Using gentamycin protection assay, PI-IBS isolates demonstrate greater intracellular invasion compared to the control isolates. c Positive correlation between adhered and invaded bacteria on T84 colonocytes (non-parametric Spearman correlation, r = 0.87; p-value < 0.0001). d T84 colonocytes were grown as epithelial monolayers with transepithelial resistance (TER) > 750 Ω cm2. No differences in % drop in TER in monolayers exposed to PI-IBS causing C. jejuni isolates compared to control isolates. (n = 28/group, Mann–Whitney U test). *All box plots show the 25th and 75th percentile, whiskers extending to the min and max values with all data points shown. Raw data are available in Supplementary Data 9.
Fig. 5
Fig. 5. Effect of genome-wide variation on in vitro pathogenicity-related phenotypes.
a Allelic diversity of NCTC 11168 homologs in 83 isolates used in the GWAS. b Gene prevalence of all NCTC 11168 genes. Genes over-represented in PI-IBS or control isolates appear further away from the mid-point. c Correlation of gene presence with pathogenicity-related phenotypes. Average number of adhered bacteria as a ratio to starting inoculum when NCTC 11168 genes are present in an isolate. d Average number of invaded bacteria as a ratio to starting inoculum when NCTC 11168 genes are present in an isolate. e Average drop in baseline TER when NCTC 11168 genes are present in an isolate. f Summary of variation in in vitro pathogenicity phenotypes grouped by core (present in ≥95% of isolates) and accessory genes. Significantly more variation (t-test, Mann–Whitley, p-value = 0.0012) was attributed to the accessory genome in adhesion assays (blue), than invasion assays (green) or barrier integrity assays (red). Raw data are available in Supplementary Data 10. *All box plots show the 25th and 75th percentile, whiskers extending to the min and max values with all data points shown.
Fig. 6
Fig. 6. Cytokine responses in colonocytes following exposure to PI-IBS and control C. jejuni isolates.
T84 epithelial monolayers were exposed to C. jejuni isolates for 24 h followed by collection of media from apical and basolateral compartments. a Apical IL-8 concentration higher in PI-IBS C. jejuni exposed colonocytes than exposed to control isolates. b Apical hemokine (C–C motif) ligand 2 (CCL2) or monocyte chemoattractant protein 1 (MCP-1) concentration lower in PI-IBS C. jejuni than control isolates. c Basolateral TNF-alpha concentration higher in PI-IBS C. jejuni than control isolates. d Basolateral C-X-C motif chemokine ligand 10 (CXCL10) or interferon gamma-induced protein 10 (IP-10) concentration higher in PI-IBS C. jejuni than control isolates. e Differences in apical IL-8 concentration, apical MCP-1 concentration, basolateral TNF-alpha concentration and basolateral IP-10 concentration in response to C. jejuni infection grouped by clonal complexes, LOS class and Penner type. Red and blue bars highlight high and low risk lineages, respectively. (n = 28/group, Mann–Whitney U test). *All box plots show the 25th and 75th percentile, whiskers extending to the min and max values with all data points shown. Raw data are available in Supplementary Data 9.

References

    1. Mearin, F. et al. Bowel disorders. Gastroenterology10.1053/j.gastro.2016.02.031 (2016).
    1. Barbara G, et al. Rome foundation working team report on post-infection irritable bowel syndrome. Gastroenterology. 2019;156:46–58.e47. doi: 10.1053/j.gastro.2018.07.011. - DOI - PMC - PubMed
    1. Berumen, A. et al. Characteristics and risk factors of post-infection irritable bowel syndrome following campylobacter enteritis. Clin Gastroenterol Hepatol.10.1016/j.cgh.2020.07.033 (2020). - PMC - PubMed
    1. Marshall JK, et al. Incidence and epidemiology of irritable bowel syndrome after a large waterborne outbreak of bacterial dysentery. Gastroenterology. 2006;131:445–450; quiz 660. doi: 10.1053/j.gastro.2006.05.053. - DOI - PubMed
    1. Thabane M, Simunovic M, Akhtar-Danesh N, Marshall JK. Development and validation of a risk score for post-infectious irritable bowel syndrome. Am. J. Gastroenterol. 2009;104:2267–2274. doi: 10.1038/ajg.2009.302. - DOI - PubMed

Publication types