. 2021 Sep;18(9):1038-1045.
doi: 10.1038/s41592-021-01249-6. Epub 2021 Aug 30.

LIVECell-A large-scale dataset for label-free live cell segmentation

Affiliations

LIVECell-A large-scale dataset for label-free live cell segmentation

Christoffer Edlund et al. Nat Methods. 2021 Sep.

Abstract

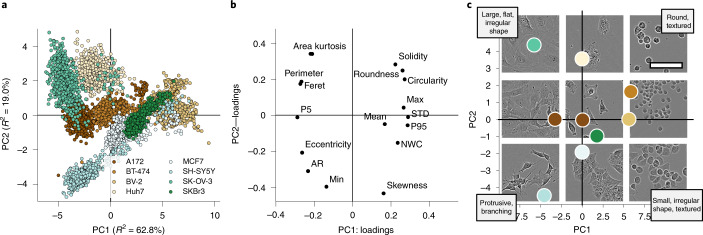
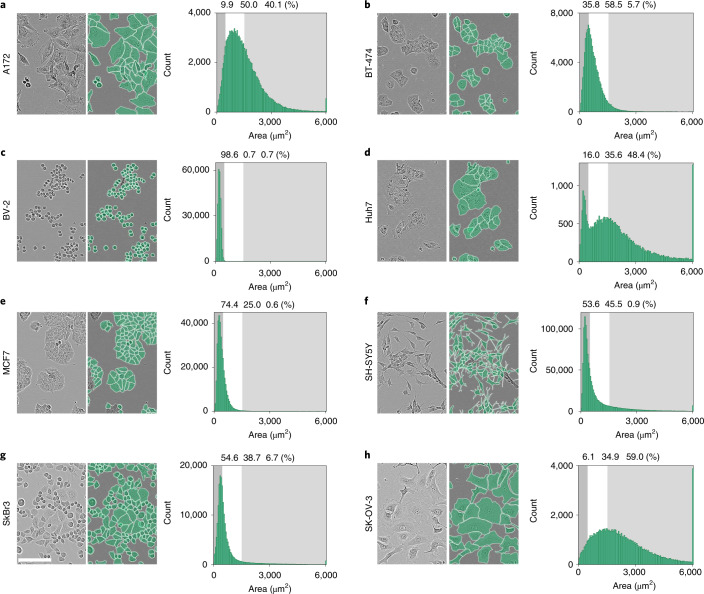
Light microscopy combined with well-established protocols of two-dimensional cell culture facilitates high-throughput quantitative imaging to study biological phenomena. Accurate segmentation of individual cells in images enables exploration of complex biological questions, but can require sophisticated imaging processing pipelines in cases of low contrast and high object density. Deep learning-based methods are considered state-of-the-art for image segmentation but typically require vast amounts of annotated data, for which there is no suitable resource available in the field of label-free cellular imaging. Here, we present LIVECell, a large, high-quality, manually annotated and expert-validated dataset of phase-contrast images, consisting of over 1.6 million cells from a diverse set of cell morphologies and culture densities. To further demonstrate its use, we train convolutional neural network-based models using LIVECell and evaluate model segmentation accuracy with a proposed a suite of benchmarks.


Conflict of interest statement

C.E., T.R.J., N.B., T.D., J.T. and R.S. are currently employed by Sartorius that funded the image annotation and provided the Incucyte Live-Cell Analysis system used to acquire the images in LIVECell. The remaining authors declare no competing interests.

Figures

Fig. 1
Fig. 1. Morphological diversity of cell types comprising LIVECell visualized using PCA.
a, Scatter plot of the first two principal components demonstrate the diverse spread of morphologies represented by images in LIVECell between and within cell types. b, Loading plot of PCA shows how each morphology metrics influence the directions of the component values. c, Representative examples of images on each axis and quadrant of the principal component plot with their principal component values plotted. Morphological interpretations, based on the loading values, are provided for each quadrant. Abbreviated metrics names are explained in the Methods. Scale bar represents 100 µm and applies to all images.
Fig. 2
Fig. 2. Illustrative examples of annotated phase-contrast microscopy images and histograms showing cell size distributions of all cell types in LIVECell.
Example images for a, A172, b, BT-474, c, BV-2, d, Huh7, e, MCF7, f, SH-SY5Y, g, SkBr3 and h, SK-OV-3 cells are shown in pairs, with the original phase-contrast image on the left and the overlaid annotations shown on the right in green. Images demonstrate morphological variety represented by the chosen cell types. Histograms show cell size distributions in µm2 for each cell type. On each histogram, the vertical color panes indicate the different cell size categories used for model evaluation and the percentages above each pane indicate how many in each cell type belong to each size category. The left-hand gray pane indicates small cells (defined as smaller than 320 µm2), the middle white pane indicates medium-sized cells (between 320 and 970 µm2) and the right-hand gray pane indicates large cells (larger than 970 µm2). Scale bar represents 150 µm and applies to all images.
Fig. 3
Fig. 3. Performance evaluation of CNN models trained on LIVECell.
af, Bar charts of cell segmentation performance, as reported by mask AP (%), for the LIVECell-wide train and evaluate task (a) and single cell-type train and evaluate task (c), cell detection performance, as reported by mask AFNR (%) for the LIVECell-wide train and evaluate task (b) and single cell-type train and evaluate task (d), as well as heatmaps for all possible transfers on the single cell-type model transferability test for the anchor-free (e) and anchor-based model (f) as reported by AP.
Fig. 4
Fig. 4. Validation of anchor-free and anchor-based model using fluorescent nuclei count.
ah, Predicted model counts are compared to fluorescence nuclei counts on A172 and A549 cells. Time course graphs show per-image object counts across different cell seeding densities over time for fluorescent nuclei and the models for the anchor-free (a) and anchor-based (c) model for A172 cells and the anchor-free (e) and anchor-based (g) model on A549 cells. Correlation plots for each image show R2 > 0.99 with a gradient close to 1 when comparing nuclei count and label-free predictions of the anchor-free (b) and anchor-based (d) models for A172 cells and anchor-free (f) and anchor-based (h) models for A549 cells. The yellow markers highlight data removed from the correlation calculations. On all graphs, the dotted line represents the 95% cell confluence level. Data are shown as mean ± s.e.m. for n = 4 images (a,c) and n = 3 images (e,g).
Fig. 5
Fig. 5. Impact of scale of dataset on segmentation performance.
Each model was trained on subsets of the LIVECell training set, corresponding to 2, 4, 5, 25, 50 and 100% of total number of images. a,d, The resulting models were then evaluated by calculating segmentation AP on the complete LIVECell test (a) and AFNR (d). To further explore the effects of increasing the dataset size we broke down the metrics to each IoU level between 50 and 95% with a step size of 5%. b,c,e,f, The precision per IoU for the anchor-free (b) and anchor-based (c) models trained on different amounts of the dataset was calculated, as well as the FNR for the same anchor-free (e) and anchor-based models (f).

References

    1. Liu H-S, Jan M-S, Chou C-K, Chen P-H, Ke N-J. Is green fluorescent protein toxic to the living cells? Biochem. Biophys. Res. Commun. 1999;260:712–717. doi: 10.1006/bbrc.1999.0954. - DOI - PubMed
    1. Dixit R, Cyr R. Cell damage and reactive oxygen species production induced by fluorescence microscopy: effect on mitosis and guidelines for non-invasive fluorescence microscopy. Plant J. 2003;36:280–290. doi: 10.1046/j.1365-313X.2003.01868.x. - DOI - PubMed
    1. Baens M, et al. The dark side of EGFP: defective polyubiquitination. PLoS ONE. 2006;1:e54. doi: 10.1371/journal.pone.0000054. - DOI - PMC - PubMed
    1. Agbulut O, et al. GFP expression in muscle cells impairs actin-myosin interactions: implications for cell therapy. Nat. Methods. 2006;3:331–331. doi: 10.1038/nmeth0506-331. - DOI - PubMed
    1. Cekanova M, Rathore K. Animal models and therapeutic molecular targets of cancer: utility and limitations. Drug Des. Devel. Ther. 2014;8:1911–1922. doi: 10.2147/DDDT.S49584. - DOI - PMC - PubMed