. 2021 Oct;22(10):1256-1267.
doi: 10.1038/s41590-021-01013-0. Epub 2021 Aug 30.

Effector differentiation downstream of lineage commitment in ILC1s is driven by Hobit across tissues

Affiliations

Effector differentiation downstream of lineage commitment in ILC1s is driven by Hobit across tissues

Christin Friedrich et al. Nat Immunol. 2021 Oct.

Abstract

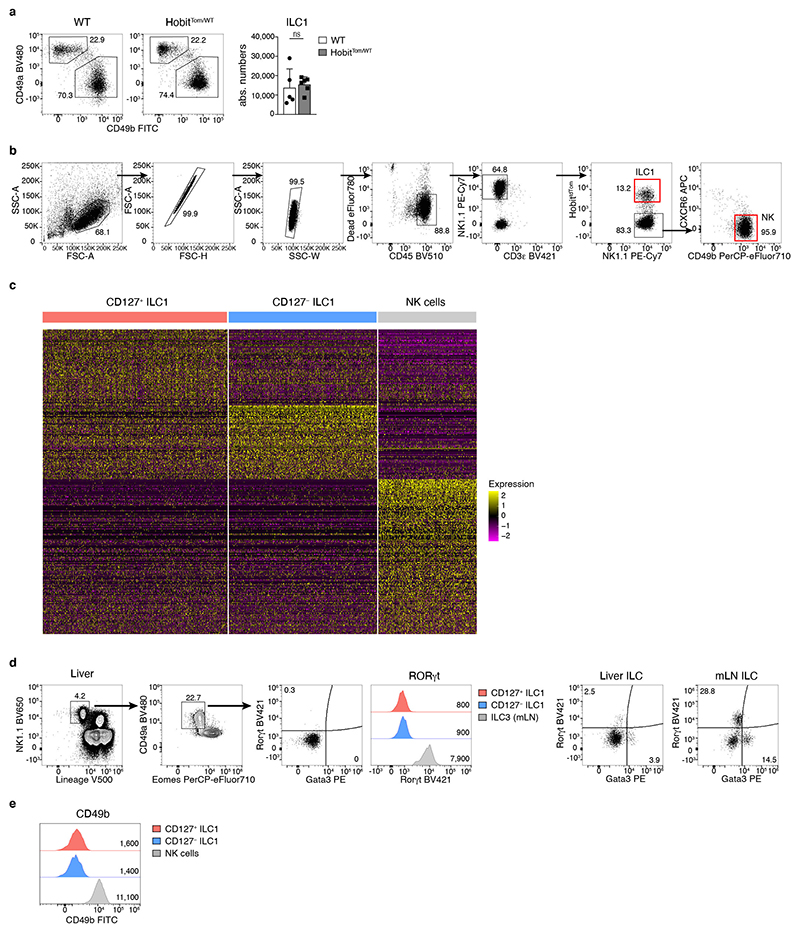
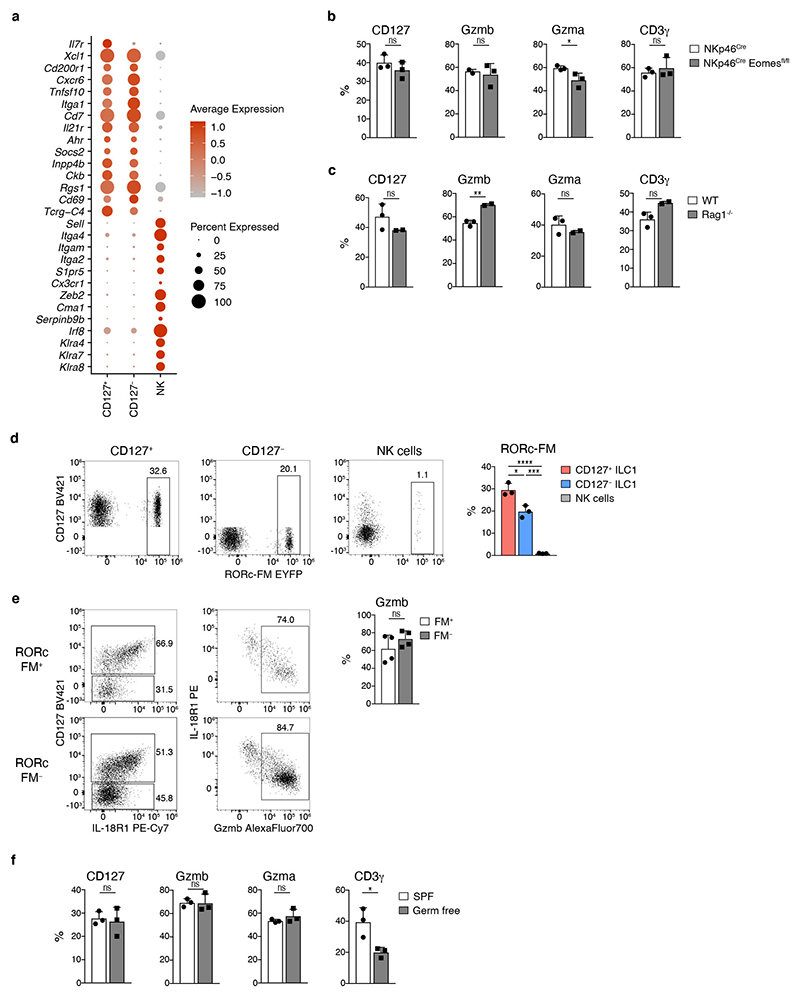
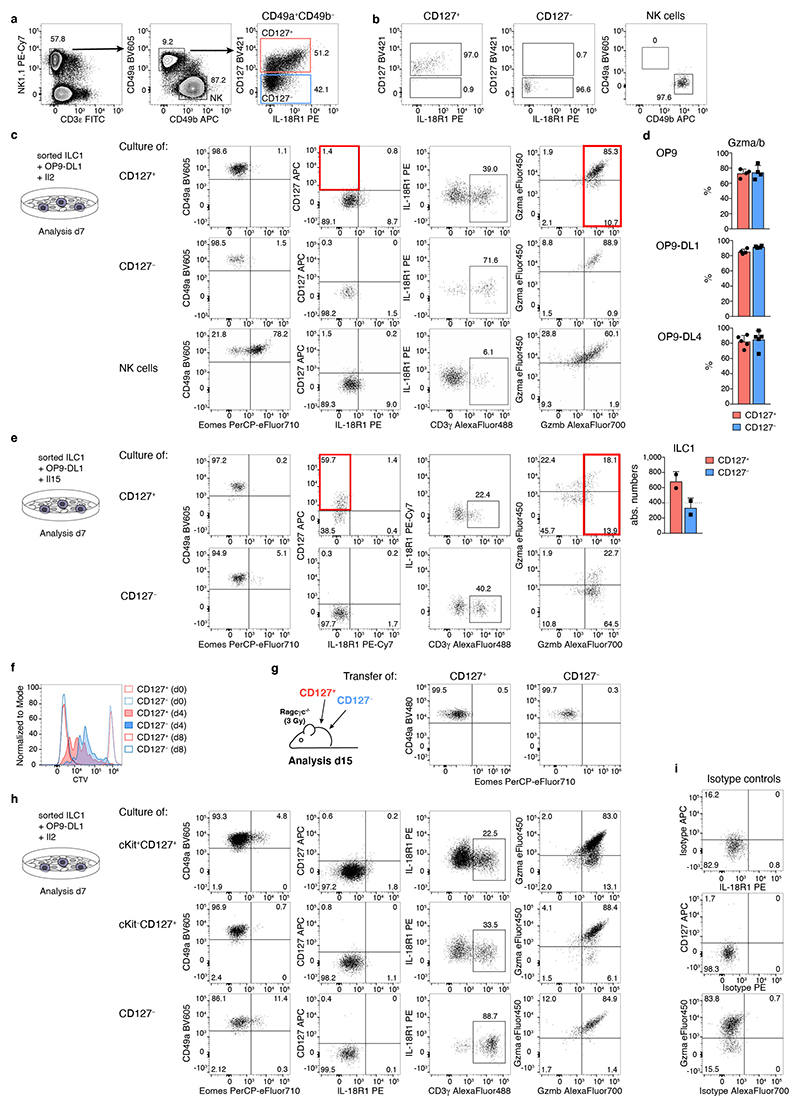
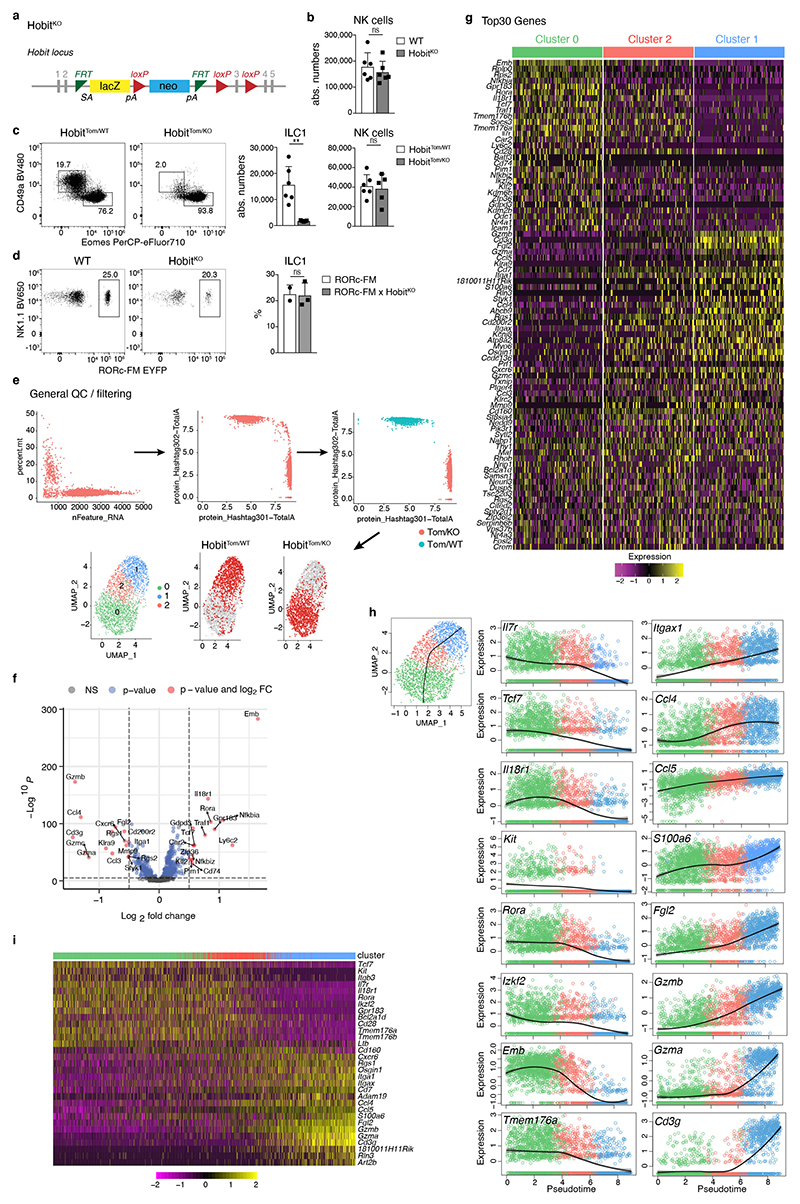
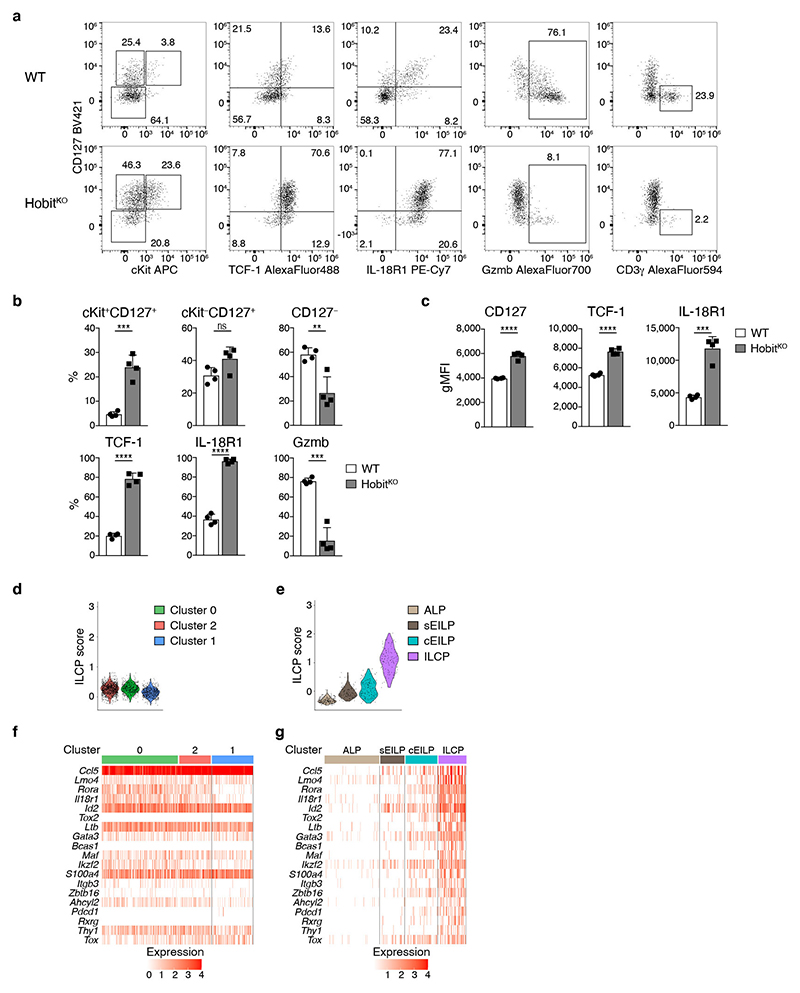
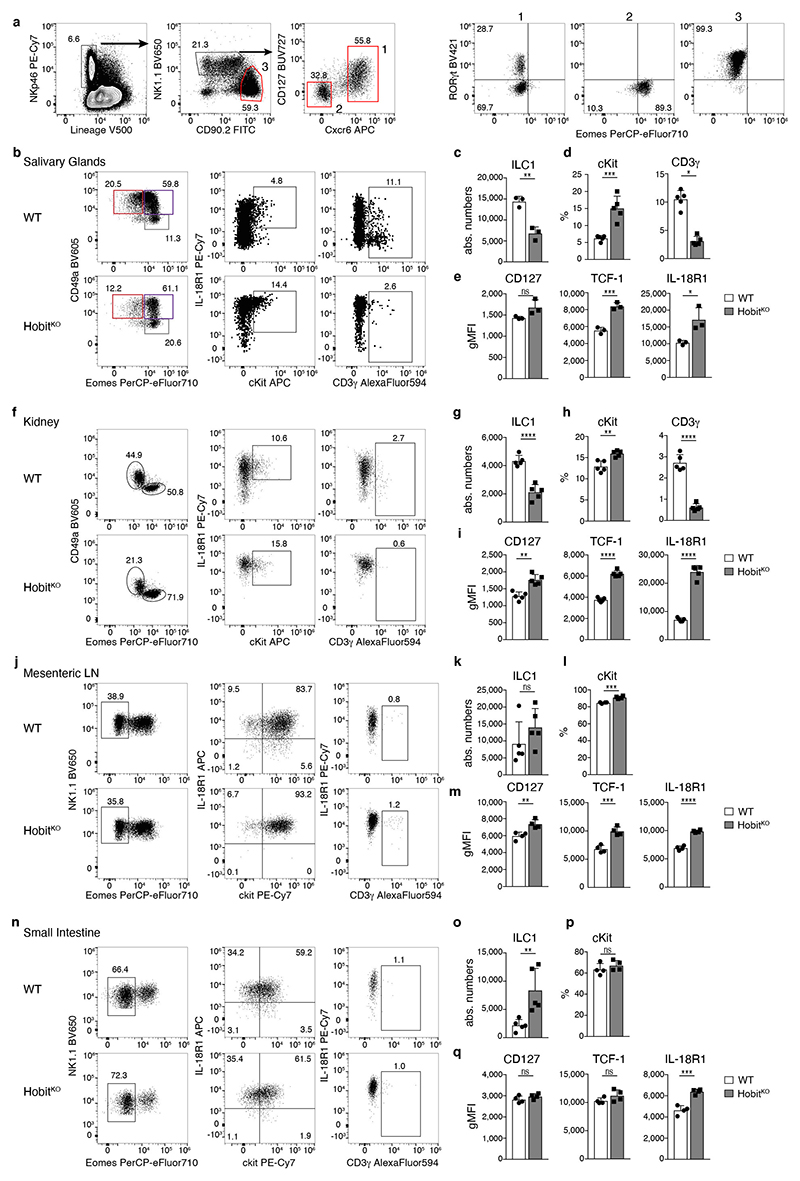
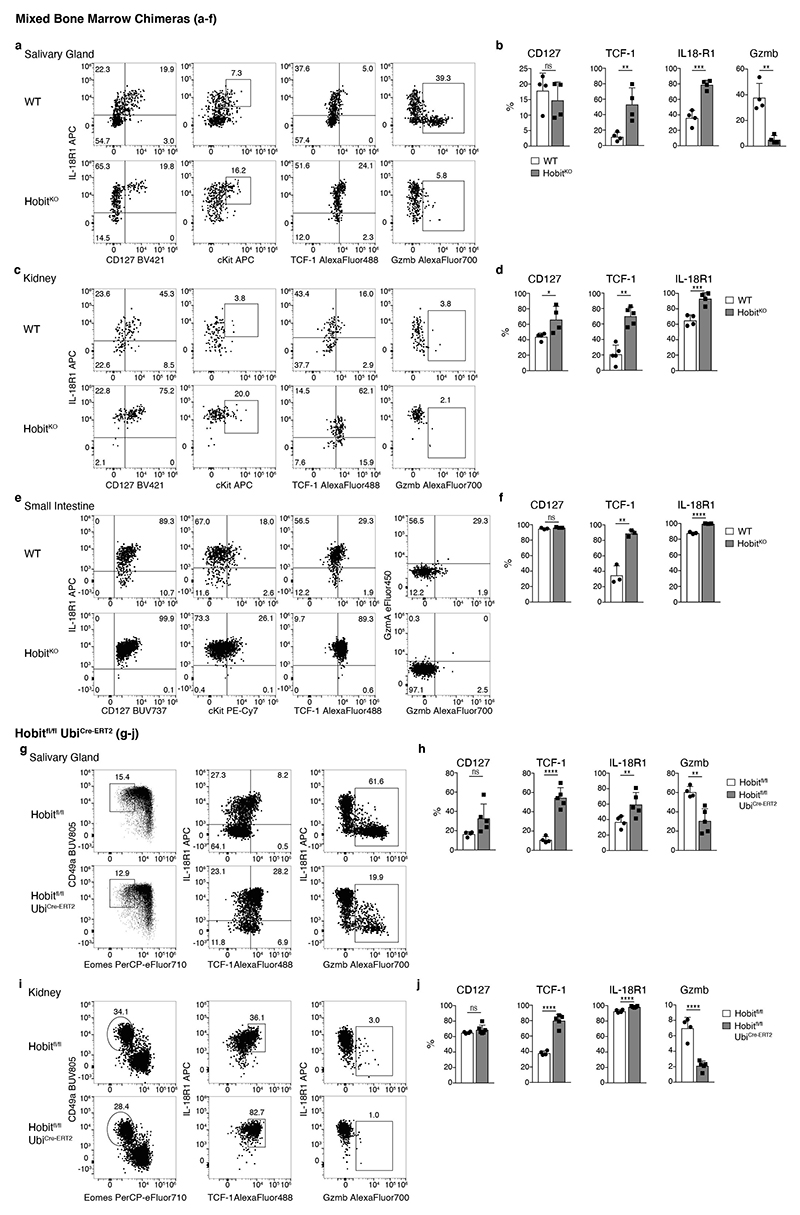
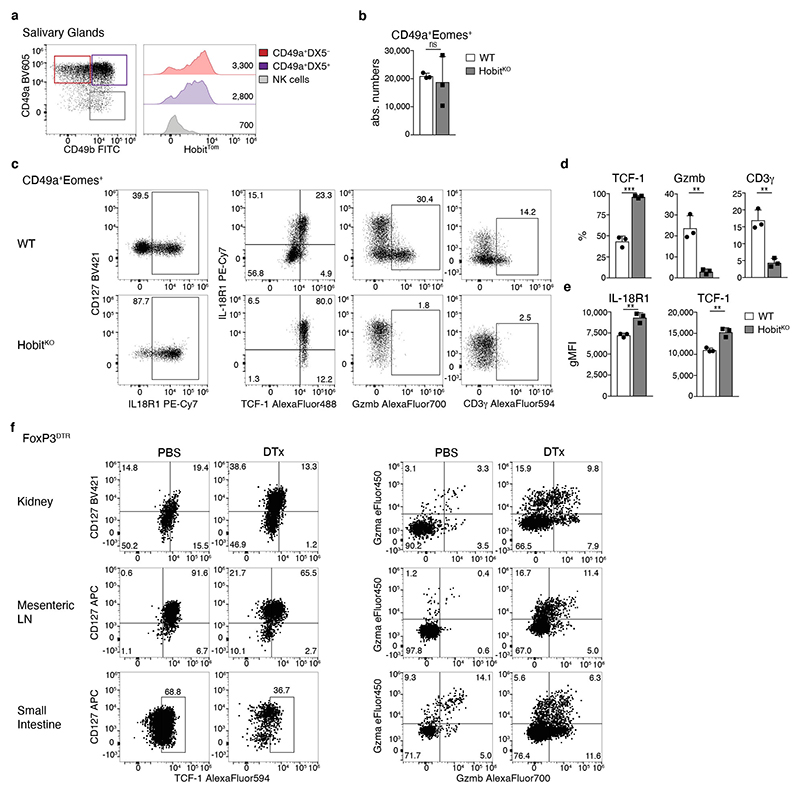
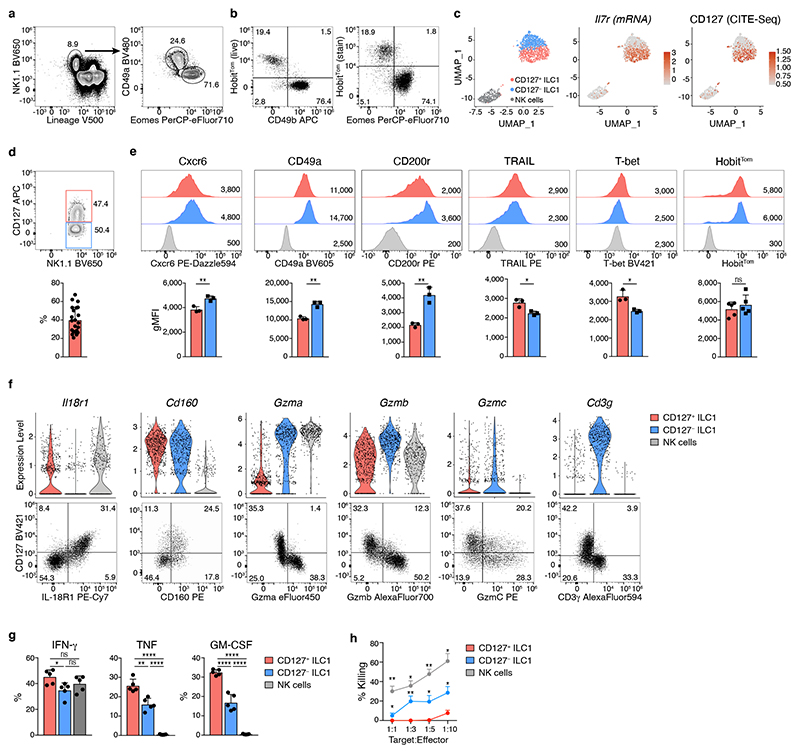
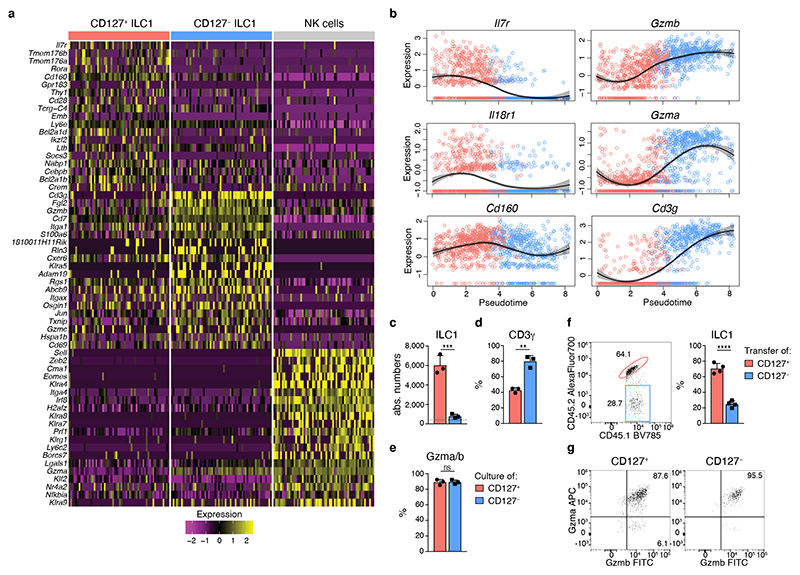
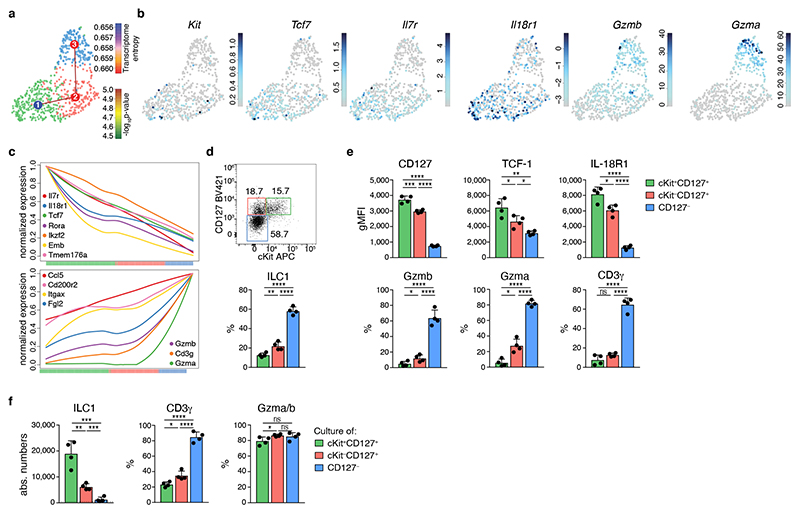
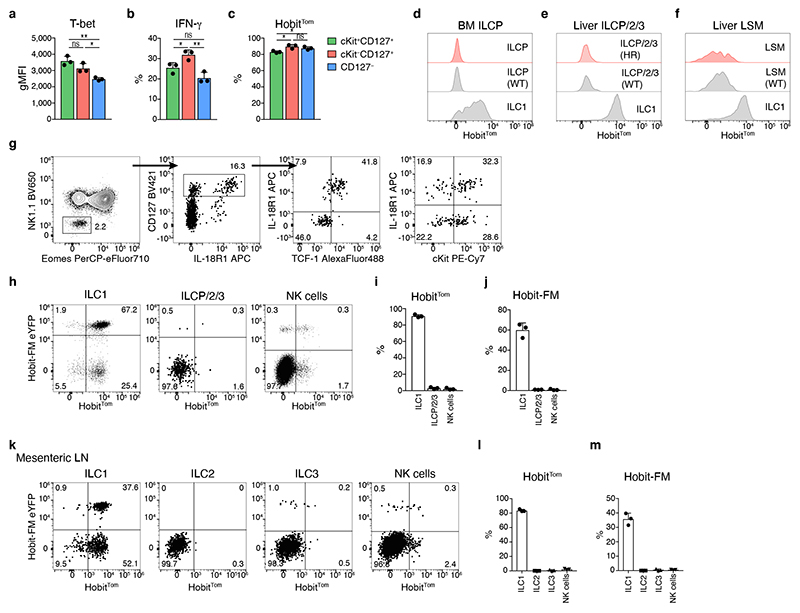
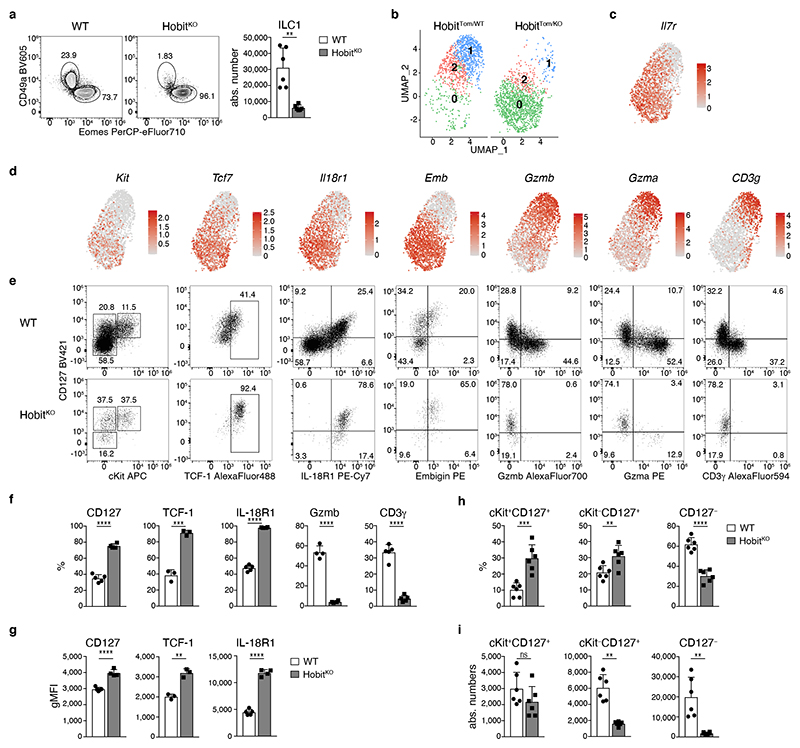
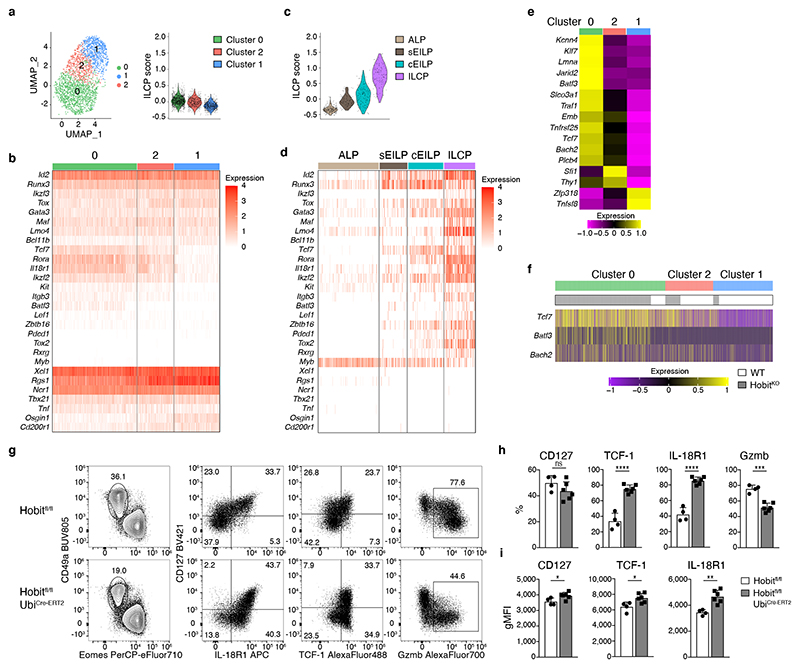
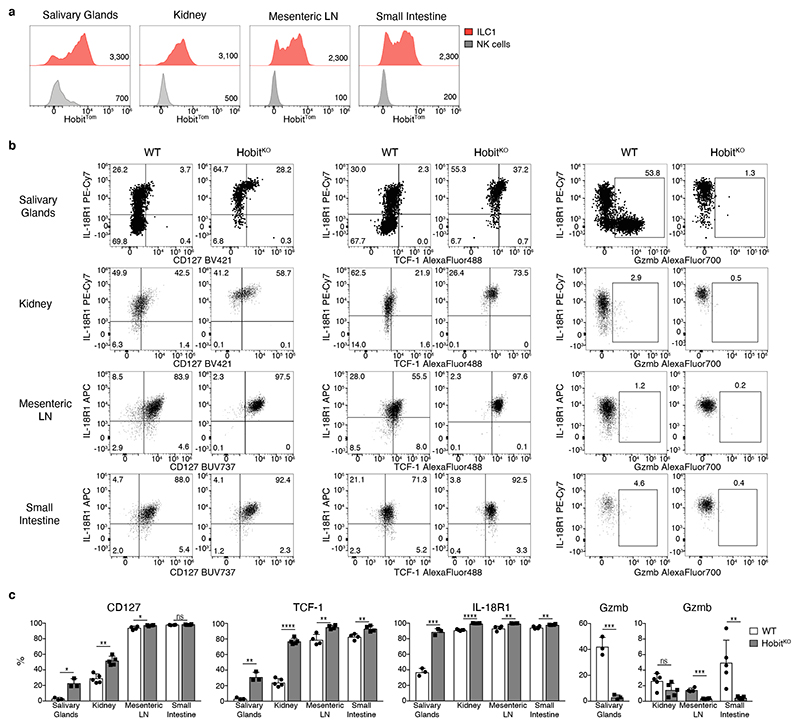
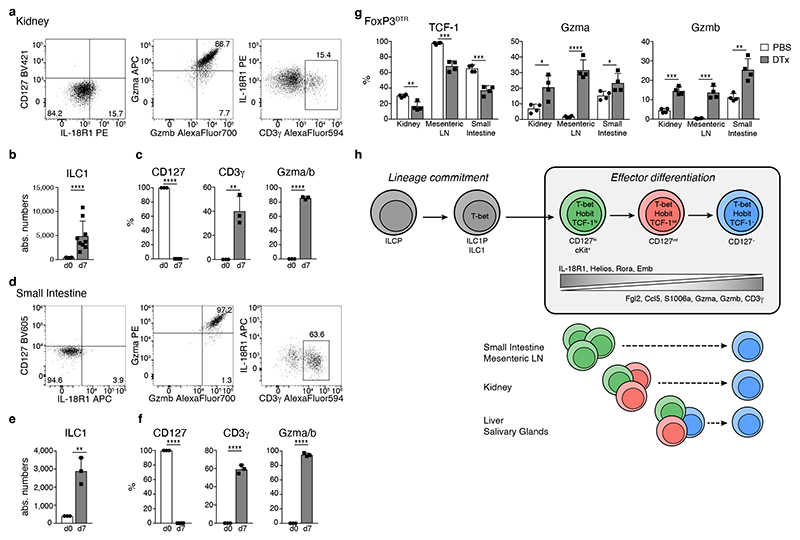
Innate lymphoid cells (ILCs) participate in tissue homeostasis, inflammation, and early immunity against infection. It is unclear how ILCs acquire effector function and whether these mechanisms differ between organs. Through multiplexed single-cell mRNA sequencing, we identified cKit+CD127hiTCF-1hi early differentiation stages of T-bet+ ILC1s. These cells were present across different organs and had the potential to mature toward CD127intTCF-1int and CD127-TCF-1- ILC1s. Paralleling a gradual loss of TCF-1, differentiating ILC1s forfeited their expansion potential while increasing expression of effector molecules, reminiscent of T cell differentiation in secondary lymphoid organs. The transcription factor Hobit was induced in TCF-1hi ILC1s and was required for their effector differentiation. These findings reveal sequential mechanisms of ILC1 lineage commitment and effector differentiation that are conserved across tissues. Our analyses suggest that ILC1s emerge as TCF-1hi cells in the periphery and acquire a spectrum of organ-specific effector phenotypes through a uniform Hobit-dependent differentiation pathway driven by local cues.


Conflict of interest statement

Competing interests

The authors declare no competing interests. K.K. is an employee of Morphosys AG and former employee of the Roche Innovation Center Munich.

Figures

Extended Data Fig. 1
Extended Data Fig. 1. Characterization of hepatic group 1 ILCs and gating strategy.
a Representative FACS plots display LinNK1.1+ cells of WT and HobitTom/WT mice. Bar graphs indicate absolute numbers of liver ILC1. Data are pooled from 2 independent experiments with n=2 and 3 mice per group. b Full sorting strategy for liver ILC1 and NK cells from negatively enriched liver lymphocytes of HobitTom/WT mice. c Heat map overview of significantly differentially expressed genes of ILC1 and NK cell clusters from Fig. 1c using Seurat. d, e Gating strategy to identify Lin NK1.1+ Eomes CD49a+ liver ILC1 and histograms showing Gata3, RORγt (d) and CD49b (e) protein expression within liver ILC1. Mesenteric lymph node are gated on Lin CD127+ cells to display Gata3 and RORyt expression. Data are representative of 2 individual experiments with n=3 mice. Bar graphs indicate individual mice (symbols) and mean (bar), error bars display means ± SD. Statistical significance was calculated by unpaired two-tailed t-test; ns – not significant.
Extended Data Fig. 2
Extended Data Fig. 2. CD127 cytotoxic-like cells are bona-fide ILC1s.
a Dot plot representation of selected ILC1 and NK cell marker gene expression associated with the clusters identified in Fig. 1c. Color indicates z-score of mean expression across clusters and dot size represents fraction of cells in the cluster expressing the respective gene. b, c, f Frequency of liver ILC1s expressing indicated proteins in NKp46Cre versus NKp46Cre Eomesfl/fl mice (b), WT versus Rag1-/- mice (c) and SPF versus germ free mice (f). Data are representative of 2 independent experiments with n=2 and 3 mice per group (b, c, f). d, e Representative FACS analysis of liver ILC1 of RORc-eYFP fate mapper (FM) mice. (d) FACS analysis and bar graph shows frequency of RORc fate mappositive cells within CD127+ and CD127 liver ILC1 and NK cells. Data are representative of 2 independent experiments with n=3 mice per group. (e) FACS plots show marker protein expression of RORc fate mapper-positive (top) and negative (bottom) liver ILC1. Bar graphs show frequency of Gzmb-positive cells within FM-positive and FM-negative ILC1. Data are pooled from 2 independent experiments with n=2 mice per group. Bar graphs indicate individual mice (symbols) and mean (bar), error bars display means ± SD. Statistical significance was calculated by unpaired two-tailed t-test; *p < 0.05, **p < 0.01, ***p < 0.001, ****p < 0.0001, ns – not significant.
Extended Data Fig. 3
Extended Data Fig. 3. CD127+ ILC1s give rise to CD127 cytotoxic-like ILC1s in vitro and in vivo.
a, b Sorting strategy for CD127+ and CD127 liver ILC1 and NK cells from WT mice, gated on live CD45+ cells. b Sorting purity. c-f, h, i In vitro cultures of indicated liver ILC1 subsets with IL-2 (c, d, f, h, i) or IL-15 (e) and OP9-DL1 cells (c, e, h, i) or the indicated stromal cell line (d) for 7 days. Representative FACS analysis showing phenotype of NK1.1+ cells. Red quadrants on FACS plots highlight phenotypic differences of CD127+ ILC1 cultured in the presence of IL-2 versus IL-15. d Frequency of Gzma+Gzmb+ cells on day 7. e Absolute numbers on d7. Dashed line indicates number of cells on d0 (input=400 cells). f In vitro proliferation of ILC1 subsets assessed by cell tracer violet dilution analyzed on the indicated days. Data are representative of 2 independent experiments with n=4 and 5 (d), n=2 (e), n=4 (f) replicates per experiment. g In vivo co-transfer of congenically marked CD127+ and CD127 liver ILC1 into sublethally irradiated Rag2-/-γc-/- mice. Representative FACS analysis of liver ILC1 derived from indicated transferred ILC1 subsets on d15. i Isotype control stainings of ILC1 cultured in vitro as in h. Bar graphs indicate replicates (symbols) and mean (bar), error bars display means ± SD.
Extended Data Fig. 4
Extended Data Fig. 4. scRNA-seq analysis of hepatic ILC1 from WT and HobitKO mice.
a Schematic representation of the Hobit locus of HobitKO mice. b Absolute numbers of liver NK cells of WT and HobitKO mice. c Representative FACS analysis displaying LinNK1.1+ hepatic ILC1 and NK cells in HobitTom/WT and HobitTom/KO mice. Bar graphs indicate absolute numbers of liver ILC1. Data in (b) and (c) are pooled from 2 independent experiments with n=3 (b) and n=2 and 3 (c) mice per group. d Representative FACS analysis of liver ILC1 of HobitKO x RORc-eYFP fate mapper (FM) mice. Bar graph shows frequency of RORc fate map-positive cells within CD127+ and CD127 liver ILC1. Data are representative of 2 independent experiments with n=2-3 mice per group. e-g scRNA-seq of hash-tagged liver ILC1 sorted from HobitTom/WT and HobitTom/KO mice. e General QC, low quality cells (feature counts > 1000 and percentage of genes mapped to mitochondrial genome < 8) and cell doublets filtering and demultiplexing of Hashtag (HT) antibodies allows to separate HobitKO/Tom (KO) and HobitTom/WT (WT). Single cell transcriptome visualization using a UMAP color-coded by clusters and the sample WT or KO as indicated by the binary detection of the HT Abs. f Volcano plot displaying significantly differentially expressed genes between WT and HobitKO ILC1, using Wilcoxon test. Thresholds are displayed at Log2 FC equal 0.5 and Adjusted P value of 0.05. Genes on the right are overexpressed in KO, genes on the left are overexpressed in WT. g Heat map of marker gene expression differentially expressed across liver ILC1s. Cluster number refers to panel (e). h, i Pseudo-temporal ordering of ILC1 single cell transcriptomes with Slingshot. Expression of candidate genes across pseudotime within hash-tagged liver ILC1s sorted from HobitTom/WT and HobitTom/KO mice. Color barcode in (h) indicates cluster identity (as identified in e). Heatmap of expression of selected genes in ILC1 populations along pseudotime (i). Bar graphs indicate individual mice (symbols) and mean (bar), error bars display means ± SD. Statistical significance was calculated by unpaired two-tailed t-test; **p < 0.01, ns – not significant.
Extended Data Fig. 5
Extended Data Fig. 5. Hobit drives the development and effector maturation of hepatic ILC1 and is expressed in committed ILC1.
a-c Representative FACS analysis of liver ILC1 in mixed bone marrow chimeric mice containing a congenically marked WT and HobitKO compartment (a). Frequency of liver ILC1 expressing indicated marker (b) and gMFI of CD127, TCF-1 and IL-18R1 expression within the respective marker-positive cells (c). Data are representative of 3 individual experiments with n=4 mice per group (ac). d-g Analysis of an unbiased ILCP core signature derived from a scRNA-seq dataset of M progenitors generated by Harly et al . Violin plots display ILCP score calculation and heat maps display individual gene expression across identified clusters (d, f) and in the dataset generated by Harly et al (e, g). Bar graphs indicate individual mice (symbols) and mean (bar), error bars display means ± SD. Statistical significance was calculated by unpaired two-tailed t-test; **p < 0.01, ***p < 0.001, ****p < 0.0001, ns – not significant.
Extended Data Fig. 6
Extended Data Fig. 6. Effector differentiation of ILC1 is regulated by Hobit across tissues.
a Gating strategy identifying ILC1 among live CD45+ cells in the small intestine lamina propria for data depicted in Fig. 7a. To preserve the HobitTom signal, cells were gated without transcription factor staining. ILC1 (1) were enriched as Lin NKp46+ NK1.1hiCD90int CXCR6+ CD127+ cells, NK cells (2) were gated as LinNKp46+ NK1.1hi CD90int CXCR6 CD127 cells, NKp46+ ILC3 were gated as Lin NKp46+ CD90hi cells. Purity of gating strategy is displayed by analysis of RORγt and Eomes (right). b-q Analysis of ILC1 in salivary glands (b-e), kidneys (f-i), mesenteric lymph nodes (LN) (j-m) and small intestine lamina propria (n-q). b, f, j, n Representative FACS analysis of LinNK1.1+ cells (left row of FACS plots) and Eomes CD49a+ ILC1s (middle and right row) of WT and HobitKO mice. b Representative FACS plot identifying ILC1 (Eomes CD49a+), Eomes+CD49a+NK1.1+ cells (Eomes+CD49a+) and cNK cells (Eomes+CD49a) within Lin NK1.1+ cells (left panel). c, g, k, o Bar graphs indicate absolute numbers of ILC1. d, h, l, p Frequency of ILC1s expressing indicated marker proteins. e, i, m, q gMFI of CD127, TCF-1 and IL-18R1 expression within ILC1 that are gated as positive for the respective marker. Data are representative of 3 independent experiments with n=3 (c, e), n=4 (j, l, m, p, q) and n=5 (b, d, f-i, k, o) mice per group. Bar graphs indicate individual mice (symbols) and mean (bar), error bars display means ± SD. Statistical significance was calculated by unpaired two-tailed t-test; *p < 0.05, **p < 0.01, ***p < 0.001, ****p < 0.0001, ns - not significant.
Extended Data Fig. 7
Extended Data Fig. 7. Analysis of ILC1 in mixed bone marrow chimeric mice and upon inducible deletion of Hobit.
Representative FACS analysis of ILC1 in salivary glands (a, b, g, h), kidneys (c, d, i, j) and small intestine lamina propria (e, f) of mixed bone marrow chimeric mice (a-f) or UbiCre-ERT2 Hobitfl/fl mice and littermate controls on d35 after Tamoxifen treatment (g-j). Bar graphs indicate frequency of ILC1s expressing indicated proteins. Data are representative of 2 (e, f) or 3 (a-d, g-j) individual experiments with n=3 (f), n=4 (a-d, g-j) and n=5 (d, h, j) mice per group. Bar graphs indicate individual mice (symbols) and mean (bar), error bars display means ± SD. Statistical significance was calculated by unpaired two-tailed t-test; *p < 0.05, **p < 0.01, ***p < 0.001, ****p < 0.0001, ns - not significant.
Extended Data Fig. 8
Extended Data Fig. 8. Hobit regulates the effector differentiation of Eomes+CD49a+ group 1 ILCs, and phenotype of ILC1 in Treg-cell depleted mice.
a-e FACS analysis of Eomes+CD49a+ tissue-resident NK1.1+ cells in salivary glands of WT and HobitKO mice. a Representative FACS analysis of HobitTom expression within ILC1 (CD49b CD49a+), Eomes+CD49a+NK1.1+ cells (identified by gating as CD49b+CD49a+, to avoid permeabilization for the analysis of the HobitTom reporter signal) and cNK cells (CD49b+CD49a) within Lin NK1.1’ cells. b Absolute numbers of Eomes+CD49a+NK1.1+ cells. c Representative FACS analysis showing indicated marker expression. d Frequency of marker-positive cells. e gMFI of TCF-1 and IL-18R1 expression within marker-positive cells. Data are representative of 3 independent experiments with n=3 mice per group. f Representative FACS plots show expression of indicated proteins of ILC1s in kidneys, mesenteric lymph nodes and small intestine lamina propria of FoxP3DTR mice on d8 of Treg cell depletion (DTx). Data are representative of 2-3 independent experiments with n=4 mice per group. Bar graphs indicate individual mice (symbols) and mean (bar), error bars display means ± SD. Statistical significance was calculated by unpaired two-tailed t-test; **p < 0.01, ***p < 0.001, ns – not significant.
Fig. 1
Fig. 1. Differential expression of CD127 identifies “helper-like” and “cytotoxic-like” hepatic ILC1
a, b Representative FACS analysis showing gating strategy to identify liver CD45+LinNK1.1+CD49a+Eomes ILC1 (a) and tdTomato (Tom) Hobit reporter signal in LinNK1.1+ cells in HobitTom mice (b). c, f Cellular indexing of transcriptomes and epitopes by sequencing (CITE-seq) of liver ILC1 and NK cells sorted from HobitTom/WT mice. c Uniform Manifold Approximation and Projection (UMAP) visualization of 1545 single cell transcriptomes delineating liver ILC1 and NK cell clusters identified on the basis of their transcriptional signatures (left), and colored according to the expression of Il7r mRNA (middle) and protein (CITE-seq) (right). d Representative FACS analysis of CD127 expression on liver ILC1. Bar graph shows frequency of CD127+ cells within liver Lin NK1.1+ Eomes CD49a+ ILC1. Data are pooled from 7 independent experiments with n=2-5 mice (total n=22 mice). e Representative histograms showing expression of indicated markers by CD127+ and CD127 liver ILC1 and NK cells of WT and HobitTom/WT mice. Bar graphs show geometric mean of fluorescence intensity (gMFI) of protein and reporter expression. Data are representative of more than 3 individual experiments with n=3 WT mice, or pooled from 2 individual experiments with n=2 and 3 HobitTom/WT mice. f Violin plots displaying expression levels of indicated genes across clusters (top row) and their associated representative FACS plots showing protein expression within hepatic ILC1 (bottom row). g Frequency of IFN-γ, TNF and GM-CSF-producing cells within CD127+ and CD127 liver ILC1 and NK cells of WT mice 4h after in vitro stimulation with PMA/Ionomycin and Brefeldin A. Data are representative of 2 independent experiments with n=5 mice per experiment. h In vitro killing of YAC target cells by CD127+ and CD127 liver ILC1 and NK cells at indicated target:effector ratios. Data are representative of 3 independent experiments with 2-3 replicates per condition. Bar graphs indicate individual mice (symbols) and mean (bar), error bars display means ± SD. Statistical significance was calculated by unpaired two-tailed t-test; *p < 0.05, **p < 0.01, ***p < 0.001, ****p < 0.0001, ns – not significant.
Fig. 2
Fig. 2. CD127+ ILC1s are precursors of CD127 cytotoxic-like ILC1s
a Heat map of marker gene expression associated with identified clusters of sc-RNA-Seq analysis depicted in Fig. 1c. b Pseudo-temporal ordering of ILC1 single cell transcriptomes with Slingshot. Expression of selected genes along the pseudotime. Colors indicate cluster identity as in 1c. Black curve shows the local polynomal regression of the distribution and gray area the confidence interval. c-e In vitro culture of CD127+ and CD127 liver ILC1 with IL-Figures und Reporting Summary2 and OP9-DL1 cells for 7 days. Absolute numbers (c) and frequency of CD3γ+ (d) and Gzma+Gzmb+ cells (e) on d7 is shown. Dashed line indicates number of cells on d0 (input=400 cells). Data are representative of 3 independent experiments with n=3 replicates per experiment (c-e). f, g In vivo co-transfer of congenically marked CD127+ and CD127 liver ILC1 into sublethally irradiated Rag2-/-γc-/-. Representative FACS analysis and bar graphs show relative frequency (f) and granzyme expression (g) of liver ILC1 derived from indicated transferred ILC1 subsets on d15. Data are representative of 2 independent experiments with n=4 mice (f, g). Bar graphs indicate replicates (c-e) or individual mice (f) (symbols) and mean (bar), error bars display means ± SD. Statistical significance was calculated by unpaired two-tailed t-test; **p < 0.01, ***p < 0.001, ****p < 0.0001, ns – not significant.
Fig. 3
Fig. 3. TCF-1hi early ILC1s give rise to downstream effector ILC1s
a-c scRNA-seq analysis of hepatic ILC1. a UMAP visualization of single-cell liver ILC1 transcriptomes clustered with RaceID3 and overlaid with lineage inference using StemID2. Node color depicts transcriptome entropy and link color indicates p-value of StemID2 links (p < 0.05, Methods). b UMAP visualization showing log2 normalized expression of selected genes. c Pseudo-temporal gene expression profile of indicated marker genes of Tcf7 hi (left) and Tcf7 lo ILC1 (right) along the inferred differentiation. Color bars indicate cluster identity. d, e Representative FACS analysis of hepatic ILC1 subsets based on CD127 and cKit expression. Histogram indicates the relative abundance within liver ILC1 (d). gMFI of CD127, TCF-1 and IL-18R1 expression within ILC1 subsets (top) and frequency of Gzmb, Gzma and CD3γ-positive cells within indicated ILC1 subsets (bottom) (e). f In vitro culture of sort-purified indicated hepatic ILC1 subsets cultured in the presence of IL-2 and OP9-DL1 cells for 7 days. Absolute numbers and frequency of CD3γ+ and Gzma+Gzmb+ cells on d7 is shown. Dashed line indicates number of cells on d0 (input=400 cells). Data are representative of 3 independent experiments (d-f) with n=3 mice per group (d, e) or n=4 replicates per experiment (f). Bar graphs indicate individual mice (d,e) or replicates (f) (symbols) and mean (bar), error bars display means ± SD. Statistical significance was calculated by unpaired two-tailed t-test; *p < 0.05, **p < 0.01, ***p < 0.001, ****p < 0.0001, ns – not significant.
Fig. 4
Fig. 4. Hobit marks lineage-committed ILC1s.
a gMFI of T-bet expression within subsets of hepatic ILC1. b Frequency of IFN-γ-producing cells within indicated subsets 4h after in vitro stimulation with IL-12/IL-18 and Brefeldin A. c Frequency of Hobit-positive ILC1 within indicated subsets. d-f Representative histograms showing expression of HobitTom indicated cell types in bone marrow (BM) and livers of WT and HobitTom/WT mice. BM ILCP were gated as LinNK1.1CD127+IL-18R1+ST2 cells. BM ILC1 were gated as LinNK1.1+NKp46+CD49a+CD49b cells. Liver ILCP/2/3 were gated as in (g). Liver LSM were gated as LinNK1.1NKp46CD11b+Sca1+ cells. g Gating strategy identifying and phenotyping LinNK1.1 CD127+ liver ILCP/2/3. h-m Representative FACS analysis of HobitTom and HobiteYFP fatemap (FM) labeling across different ILC lineages in the liver (h-j) and mesenteric LN (k-m). ILC2 were gated as LinNK1.1NKp46CD127+KLRG1+. ILC3 were gated as Lin NK1.1NKp46CD127+KLRG1CD90+ cells. Data are representative of 3 (a, c, e, g) or 2 (b, d, f, h-m) independent experiments with n=3 mice per experiment. Bar graphs indicate individual mice (symbols) and mean (bar), error bars display means ± SD. Statistical significance was calculated by unpaired two-tailed t-test; *p < 0.05, **p < 0.01, ns – not significant.
Fig. 5
Fig. 5. Hobit drives the effector differentiation of lineage-committed ILC1
a Representative FACS analysis displaying LinNK1.1+ hepatic ILC1 and NK cells in WT and HobitKO mice. Bar graphs indicate absolute numbers of liver ILC1. b-d scRNA-seq analysis of 2549 hash-tagged liver ILC1 sorted from HobitTom/WT and HobitTom/KO mice. UMAP visualization of liver ILC1 clusters (b), and colored according to the normalized expression of selected genes (c, d). e-g Representative FACS analysis of indicated marker expression of ILC1 from livers of WT and HobitKO mice. f Frequency of ILC1s expressing indicated marker proteins of WT and HobitKO mice. g gMFI of CD127, TCF-1 and IL-18R1 expression within marker-positive ILC1. h, i Frequency (h) and absolute numbers (i) of indicated ILC1 subsets in WT and HobitKO mice. Data in (a), (h) and (i) are pooled from 2 independent experiment with n=3 mice per group. Data in (f) and (g) show one representative of 3 independent experiments with n=3, 4 and 5 mice per group. Bar graphs indicate individual mice (symbols) and mean (bar), error bars display means ± SD. Statistical significance was calculated by unpaired two-tailed t-test; **p < 0.01, ***p < 0.001, ****p < 0.0001, ns – not significant.
Fig. 6
Fig. 6. Hobit is continuously required to regulate the differentiation of TCF-1hi Gzmlo vs TCF-1lo Gzmhi effector ILC1s
a-d UMAP visualization of liver ILC1 clusters as in Fig. 5b. Violin plots display ILCP score calculation of selected ILCP genes across identified clusters (a) and in a scRNA-seq dataset of indicated BM progenitors generated by Harly et al (c). b, d Heat maps of marker gene expression associated with ILCPs across identified (b) and published (d) clusters. e Heat map of expression of potential Hobit target genes (derived from Mackay et al. ChIP Seq data of T cells) across identified clusters. f Expression of Tcf7, Batf3 and Bach2 within liver ILC1 from WT and HobitKO mice. g-i Representative FACS analysis of liver ILC1 in UbiCre-ERT2 x Hobitfl/fl mice and littermate controls on d35 after Tamoxifen treatment, gated on LinNK1.1+ (left) and ILC1 (g). Frequency of indicated marker-positive cells within ILC1 (h) and gMFI of CD127, TCF-7 and IL-18R1 expression within marker-positive liver ILC1 (i). Data show one representative of 3 individual experiments with n=4 or 6 mice per group (g-i). Bar graphs indicate individual mice (symbols) and mean (bar), error bars display means ± SD. Statistical significance was calculated by unpaired two-tailed t-test; *p < 0.05, **p < 0.01, ***p < 0.001, ****p < 0.0001, ns – not significant.
Fig. 7
Fig. 7. Effector differentiation of ILC1 is regulated by Hobit across tissues
a Representative histograms displaying HobitTom signal in ILC1 and NK cells isolated from indicated organs of HobitTom/WT mice. To maintain the reporter signal, ILC1s SG and kidney were gated as Lin NK1.1 NKp46 CD49a DX5 cells; in the mesenteric LN and SI ILC1s were gated as Lin NK1.1+ NKp46+ CD127+ CXCR6+ cells as shown in Extended Figure 6a. Data are representative of 2 individual experiments with n=3-4 mice per group. b, c Representative FACS analysis of indicated marker expression of Lin NK1.1+ CD49a+ Eomes RORγt ILC1 from indicated organs of WT and HobitKO mice (b). Frequency of ILC1s expressing indicated marker proteins of WT and HobitKO mice (c). Data in (b) and (c) show one representative of 3 independent experiments with n=3 (salivary gland), 4 (mesenteric LN, small intestine) and 5 (kidney) mice per group. Bar graphs indicate individual mice (symbols) and mean (bar), error bars display means ± SD. Statistical significance was calculated by unpaired two-tailed t-test; *p < 0.05, **p < 0.01, ***p < 0.001, ****p < 0.0001, ns – not significant.
Fig. 8
Fig. 8. The developmental potential of ILC1s is conserved across tissues
a-fIn vitro culture of CD127+ kidney (a-c) and small intestinal (d-f) ILC1 in the presence of IL-2 and OP9-DL1 feeder cells. a, d Representative FACS plots on d7. b, e Absolute numbers of cells on d0 (input=400 cells) and d7. c, f Frequency of CD127+, CD3γ+ and Gzma+Gzmb+ cells. Data representative of 3 independent experiments with n=3 replicates per experiment. g FACS analysis of ILC1s from indicated organs of Treg depleted or mock treated FoxP3DTR mice on d8 of DT treatment (DTx). Histograms indicate the frequency of ILC1s expressing indicated proteins is depicted. Data are representative of 3 independent experiments with n=4 mice per group. h Schematic summarizing sequential mechanisms of ILC1 lineage commitment and effector differentiation downstream of TCF-1hi “early” ILC1s, which is transcriptionally regulated by Hobit. ILC1s across tissues have a uniform capacity to differentiate towards TCF-1lo Gzmhi cells. Bar graphs indicate replicates (b, c, e, f) or individual mice (g) (symbols) and mean (bar), error bars display means ± SD. Statistical significance was calculated by unpaired two-tailed t-test; *p < 0.05, **p < 0.01, ***p < 0.001, ****p < 0.0001.

References

    1. Colonna M. Innate Lymphoid Cells: Diversity, Plasticity, and Unique Functions in Immunity. Immunity. 2018;48:1104–1117. - PMC - PubMed
    1. Vivier E, et al. Innate Lymphoid Cells: 10 Years On. Cell. 2018;174:1054–1066. - PubMed
    1. Riggan L, Freud AG, O’Sullivan TE. True Detective: Unraveling Group 1 Innate Lymphocyte Heterogeneity. Trends Immunol. 2019;40:909–921. - PMC - PubMed
    1. Zeis P, et al. In Situ Maturation and Tissue Adaptation of Type 2 Innate Lymphoid Cell Progenitors. Immunity. 2020;53:775–792.:e779. - PMC - PubMed
    1. Ghaedi M, et al. Single-cell analysis of RORa tracer mouse lung reveals ILC progenitors and effector ILC2 subsets. J Exp Med. 2020;217:1–19.:e20182293 - PMC - PubMed

Publication types

LinkOut - more resources