[Preprint]. 2021 Aug 26:rs.3.rs-802084.
doi: 10.21203/rs.3.rs-802084/v1.

Immune responses in COVID-19 respiratory tract and blood reveal mechanisms of disease severity

Affiliations

Immune responses in COVID-19 respiratory tract and blood reveal mechanisms of disease severity

Wuji Zhang et al. Res Sq. .

Update in

  • SARS-CoV-2 infection results in immune responses in the respiratory tract and peripheral blood that suggest mechanisms of disease severity.
    Zhang W, Chua BY, Selva KJ, Kedzierski L, Ashhurst TM, Haycroft ER, Shoffner-Beck SK, Hensen L, Boyd DF, James F, Mouhtouris E, Kwong JC, Chua KYL, Drewett G, Copaescu A, Dobson JE, Rowntree LC, Habel JR, Allen LF, Koay HF, Neil JA, Gartner MJ, Lee CY, Andersson P, Khan SF, Blakeway L, Wisniewski J, McMahon JH, Vine EE, Cunningham AL, Audsley J, Thevarajan I, Seemann T, Sherry NL, Amanat F, Krammer F, Londrigan SL, Wakim LM, King NJC, Godfrey DI, Mackay LK, Thomas PG, Nicholson S, Arnold KB, Chung AW, Holmes NE, Smibert OC, Trubiano JA, Gordon CL, Nguyen THO, Kedzierska K. Zhang W, et al. Nat Commun. 2022 May 19;13(1):2774. doi: 10.1038/s41467-022-30088-y. Nat Commun. 2022. PMID: 35589689 Free PMC article.

Abstract

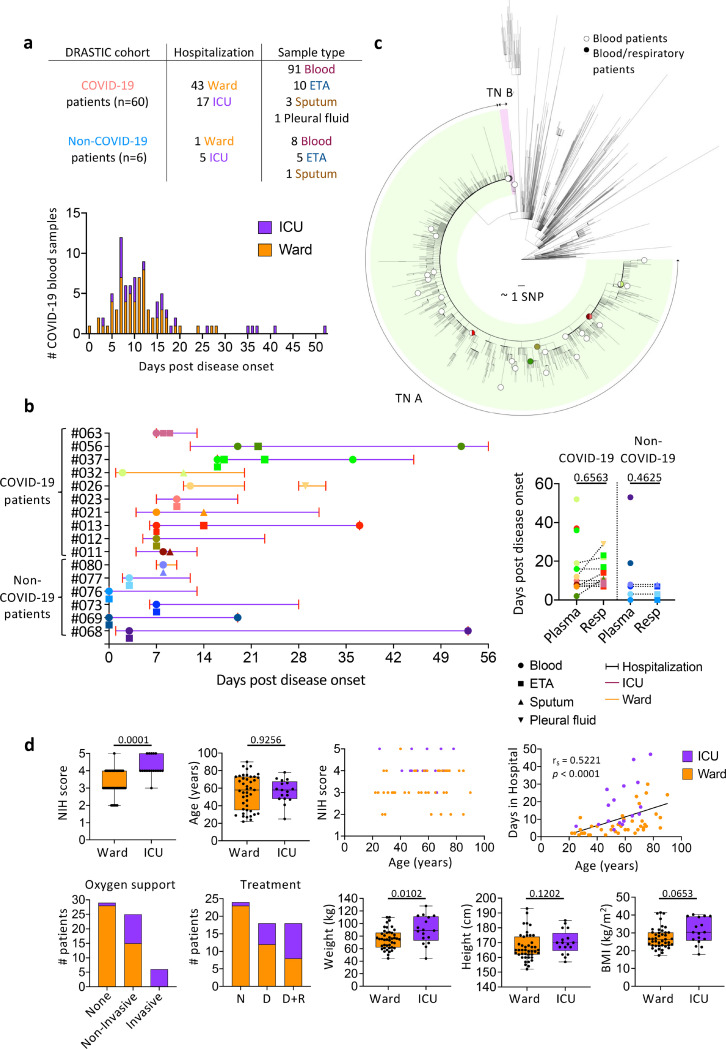
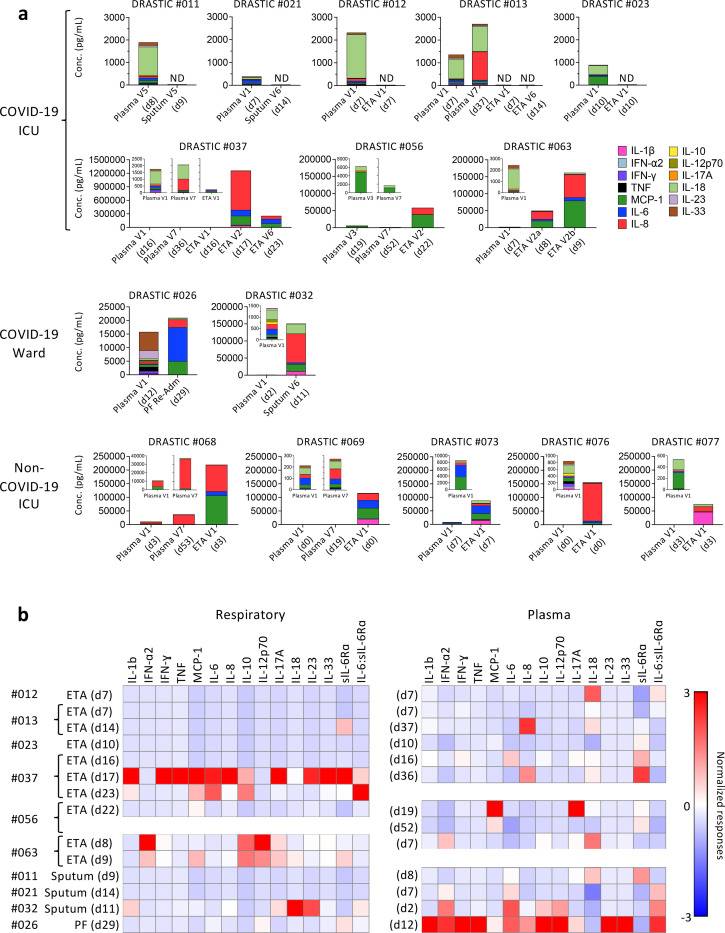
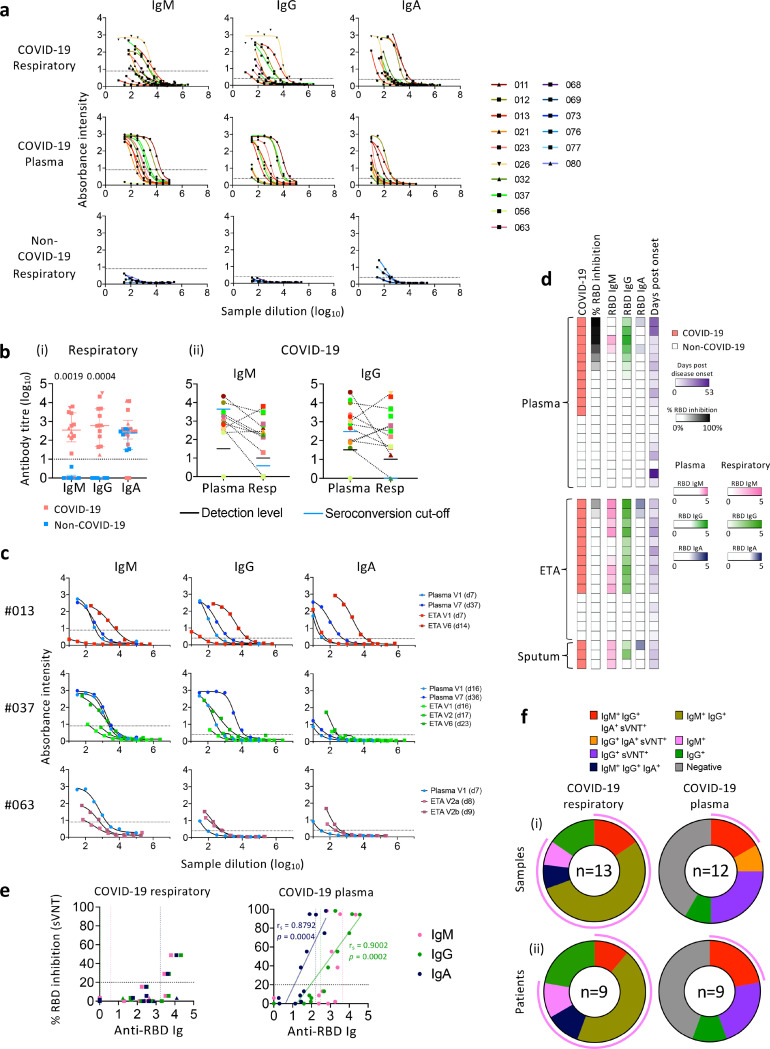
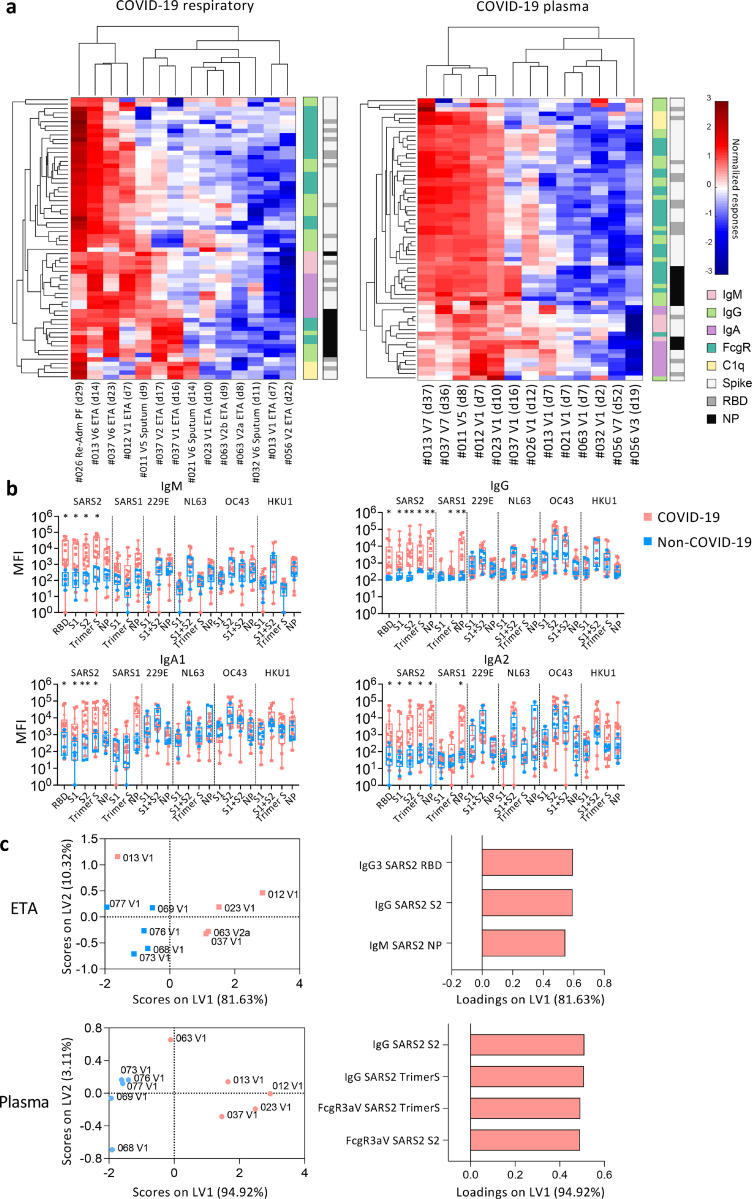
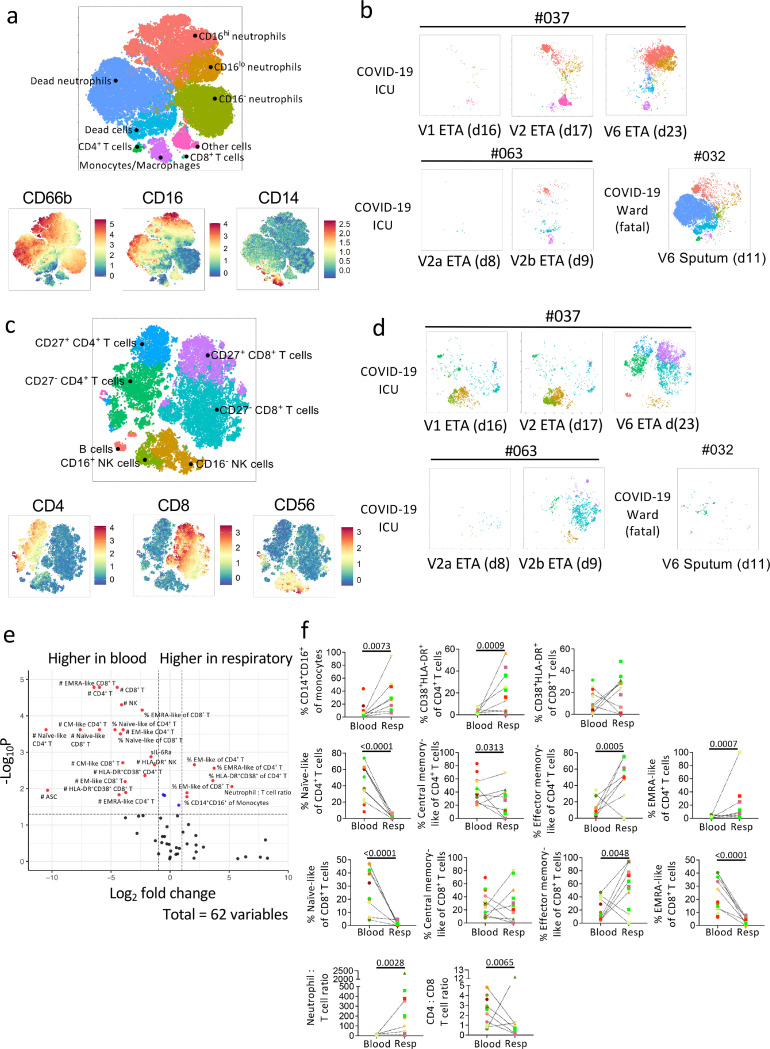
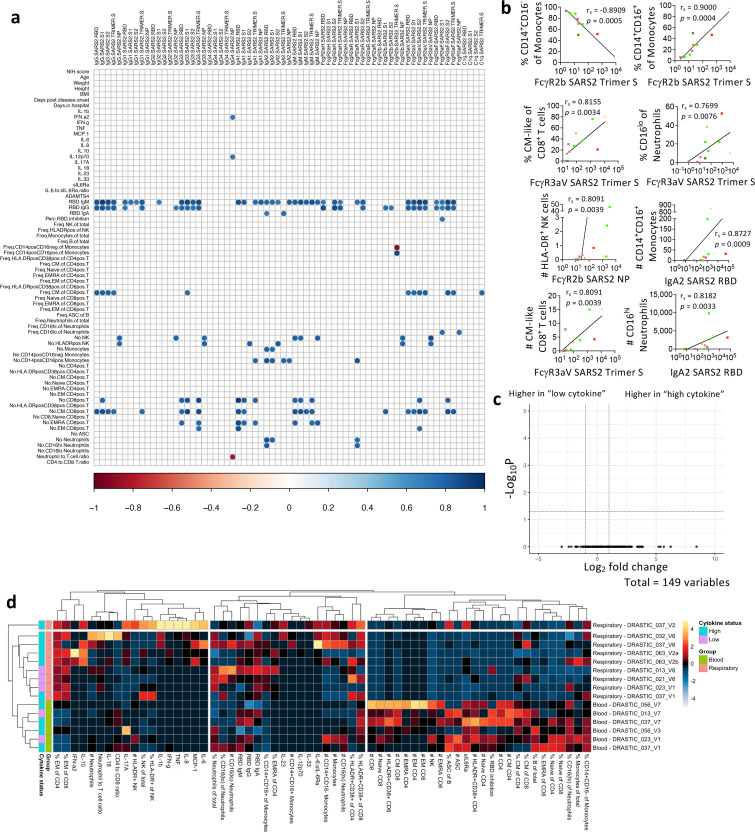
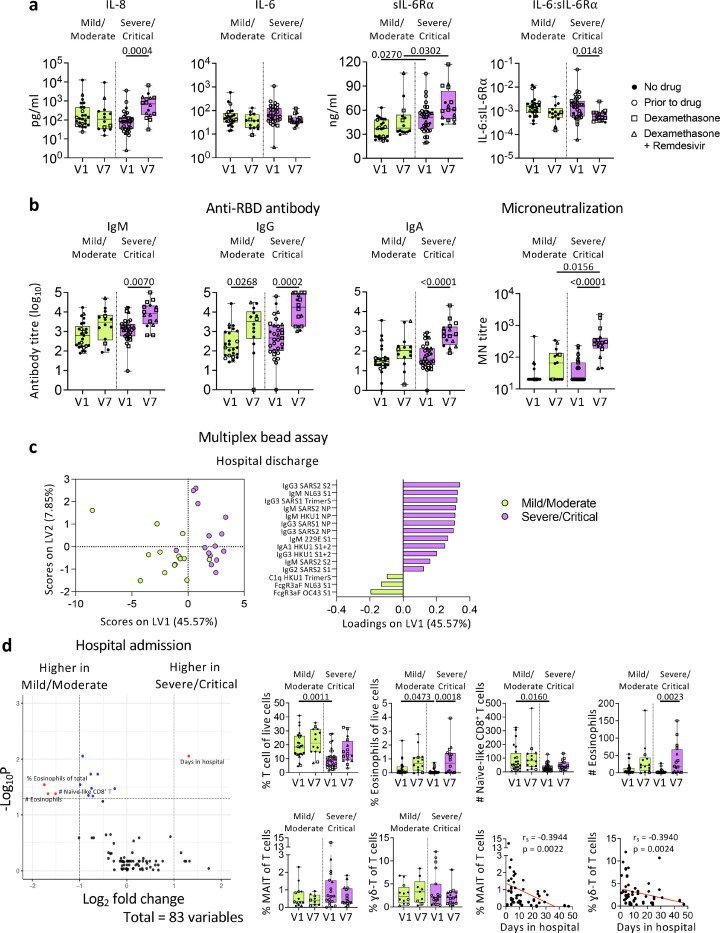
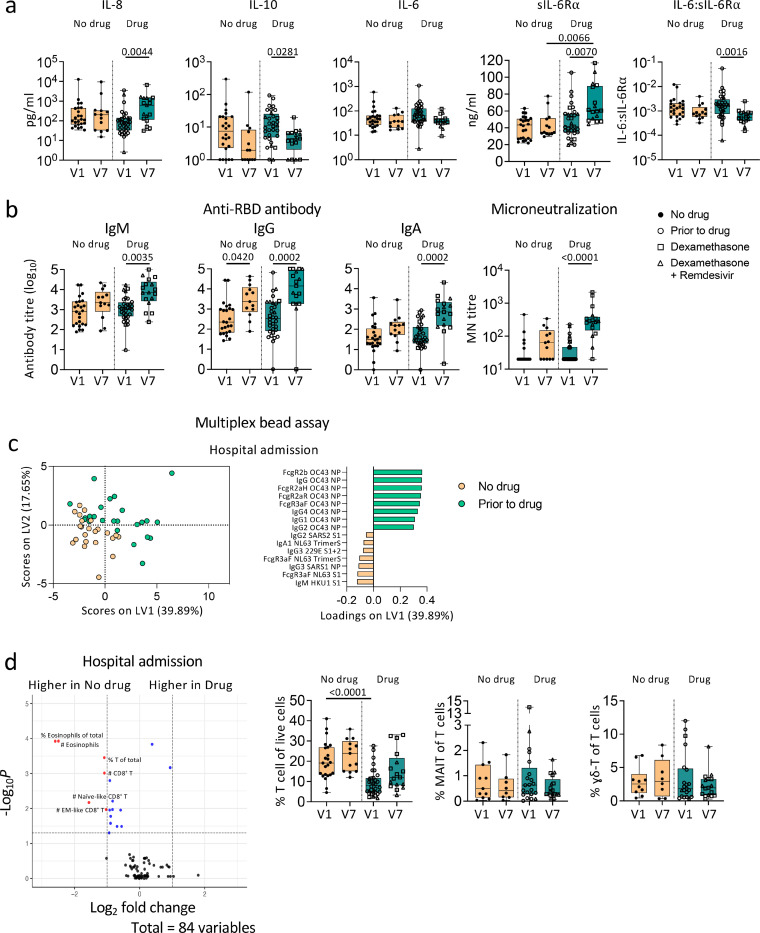
Although the respiratory tract is the primary site of SARS-CoV-2 infection and the ensuing immunopathology, respiratory immune responses are understudied and urgently needed to understand mechanisms underlying COVID-19 disease pathogenesis. We collected paired longitudinal blood and respiratory tract samples (endotracheal aspirate, sputum or pleural fluid) from hospitalized COVID-19 patients and non-COVID-19 controls. Cellular, humoral and cytokine responses were analysed and correlated with clinical data. SARS-CoV-2-specific IgM, IgG and IgA antibodies were detected using ELISA and multiplex assay in both the respiratory tract and blood of COVID-19 patients, although a higher receptor binding domain (RBD)-specific IgM and IgG seroconversion level was found in respiratory specimens. SARS-CoV-2 neutralization activity in respiratory samples was detected only when high levels of RBD-specific antibodies were present. Strikingly, cytokine/chemokine levels and profiles greatly differed between respiratory samples and plasma, indicating that inflammation needs to be assessed in respiratory specimens for the accurate assessment of SARS-CoV-2 immunopathology. Diverse immune cell subsets were detected in respiratory samples, albeit dominated by neutrophils. Importantly, we also showed that dexamethasone and/or remdesivir treatment did not affect humoral responses in blood of COVID-19 patients. Overall, our study unveils stark differences in innate and adaptive immune responses between respiratory samples and blood and provides important insights into effect of drug therapy on immune responses in COVID-19 patients.


Conflict of interest statement

Declaration of Interests

The authors declare no competing interests.

Figures

Figure 1
Figure 1
PreDictoRs of diseAse Severity in criTically Ill COVID-19 patient (DRASTIC) cohort. a Number of patients recruited in the DRASTIC cohort and samples collected (top panel) and days post disease onset of COVID-19 blood samples (bottom panel). b Collection timepoints of respiratory samples (endotracheal tube aspirate (ETA), sputum, and pleural fluid) and paired blood samples from the same patients (left panel). Comparison of days post disease onset between blood and respiratory samples for COVID-19 and non-COVID-19 patients (right panel) using Mann-Whitney test. c Maximum likelihood phylogenetic tree of SARS-CoV-2 sequences from Victoria from 28 January 2020 to 28 October 2020 (including context sequences from rest of Australia and New Zealand). Phylogenetic tree includes randomly subsampled sequences from transmission networks (TN) A and TN B in Victoria, with a total number of 10941 and 145 cases respectively. The outermost tip of each radial line represents a single sequence; the sum of each radial line between two tips represents the genetic distance between two sequences. Each radial stepwise progression represents approximately one single nucleotide polymorphism (SNP). Sequences from study patients are shown as open circles (patient with blood samples only) or solid-coloured circles (patients with blood and respiratory samples, same colours as in section b). Half-filled circles are used when samples are located close to each other. d Distribution of clinical data in ward and intensive care unit (ICU) COVID-19 patients. Box and bars indicate first and third quartiles, and range respectively. Statistical significance was determined with the Fisher’s exact test for the National Institutes of Health (NIH) score, and Mann-Whitney test for age, weight, height, and body weight index (BMI). Correlation was determined with Spearman’s correlation.
Figure 2
Figure 2
Discordant levels of cytokines and chemokines in COVID-19 respiratory samples compared to paired plasma samples. a Absolute concentrations of 13 cytokines and chemokines (IL-1β, IFN-2, IFN-γ, TNF, MCP-1, IL-6, IL-8, IL-10, IL-12p70, IL-17A, IL-18, IL-23, and IL-33) in each individual with respiratory and plasma samples. b Standardized levels of cytokines/chemokines for COVID-19 respiratory and plasma samples separately. Red color indicates higher cytokine/chemokine levels. PF, pleural fluid; Re-Adm, re-admission.
Figure 3
Figure 3
Higher anti-RBD IgM seroconversion rate in respiratory samples compared to paired blood samples of COVID-19 patients. a ELISA titration curves against the SARS-CoV-2 receptor-binding domain (RBD) for IgM, IgG, and IgA in COVID-19 respiratory and paired blood samples and non-COVID-19 respiratory samples. Dotted lines within each graph indicates the cut-off used to determine end-point titres. b Endpoint titres of SARS-CoV-2 RBD antibodies between (i) respiratory samples of COVID-19 and non-COVID-19 patients, and (ii) plasma and respiratory samples of COVID-19 patients. (i) Bars indicate median with interquartile range. Dotted line indicates the detection level. (ii) Dotted lines connect the most closely matched plasma and respiratory samples from each patient. Statistical significance was determined with Mann-Whitney test. c ELISA titration curves against the SARS-CoV-2 RBD for 3 COVID-19 patients with serial respiratory samples. d Heatmap of percentage (%) inhibition tested by surrogate virus neutralization test (sVNT) and anti-RBD ELISA titres. e Correlation between anti-RBD antibody titres and (%) sVNT inhibition. Correlation was determined with Spearman’s correlation. f Number of (i) samples and (ii) patients with seroconverted anti-RBD IgM, IgG, IgA and positive % sVNT inhibition. Pink curved lines surrounding the donut graphs indicate the samples/patients with seroconverted IgM. Earliest samples were used for each patient when determining seroconversion which was defined as average titre +2xSD of non-COVID-19 samples. Positive % sVNT inhibition was defined as % sVNT inhibition ≥ 20%.
Figure 4
Figure 4
Higher anti-SARS2-NP IgM in COVID-19 ETA than non-COVID-19 ETA. a Heatmaps with unsupervised clustering of SARS-CoV-2-specific antibodies in COVID-19 respiratory and plasma samples. b median fluorescence intensity of IgM, IgG, IgA1, and IgA2 antibodies between COVID-19 and non-COVID-19 respiratory samples. Statistical significance was determined with Mann-Whitney test. c Partial Least-Squares Discriminant Analysis (PLSDA) scores and loading plots of ETA and plasma from five COVID-19 and five non-COVID-19 patients with the smallest difference in days post disease onset between ETA and plasma samples.
Figure 5
Figure 5
Higher frequencies of activated immune cells and EM-like CD4+ and CD8+ T cells in COVID-19 respiratory compared to paired blood samples. Flow Self-Organizing Map (FlowSOM) analyses of cellular content in the respiratory tract. a-d Metacluster of cells and expression level of the a myeloid antibody panel and c lymphocyte antibody panel. Multiple respiratory samples from patients 037 and 063 as well as one fatal patient 032 were shown as example b, d. e Volcano plot showing fold difference of 62 immunological features between paired respiratory and blood samples. f Comparisons of cellular immune features between respiratory and paired blood samples. Statistical significance was determined with Mann-Whitney test. Dotted lines connect the most closely matched plasma and respiratory samples from each patient.
Figure 6
Figure 6
Airway SARS-CoV-2-specific antibody levels positively correlated with several immune cell types. a-b Correlation matrix and graphs in COVID-19 respiratory samples between multiplex and non-multiplex immune features. Correlation was determined with Spearman’s correlation and p-values of the correlation matrix were adjusted with False Discovery Rate adjustment. c Volcano plot showing fold difference of 149 cellular features in respiratory samples between patients with “low cytokine” (013, 021, 023) and “high cytokine” (026, 032, 037, 056, 063). d Heatmaps with unsupervised clustering of serological and cellular features in COVID-19 respiratory and blood samples.
Figure 7
Figure 7
COVID-19 patients with higher NIH scores display more robust humoral immune responses towards SARS-CoV-2. a Levels of cytokines, sIL-6R, and IL-6:sIL-6R ratio, b anti-RBD IgM, IgG, and IgA titres, microneutralization titres and c PLSDA scores and loadings plot of antibodies against human coronavirus between mild/moderate and severe/critical COVID-19 patients. d Volcano plot showing fold difference of 83 immunological features in blood samples between mild/moderate and severe/critical COVID-19 patients, and comparisons of cellular subset frequencies and correlation with days stayed in hospital. Statistical significance was determined with Kruskal-Wallis test followed by Dunn’s multiple comparisons test. Partial Least-Squares Discriminant Analysis was performed for antibodies measured with multiplex bead array assay. Volcano plots were created using a Wilcoxon rank-sum test and statistics were corrected with FDR adjustment. Correlation was determined with Spearman’s correlation. V1, hospital admission; V7, hospital discharge.
Figure 8
Figure 8
Figure 8 Dexamethasone treatment does not alter humoral immune responses towards SARS-CoV-2 in COVID-19 patients. a Levels of cytokines, sIL-6R, and IL-6:sIL-6R ratio, b anti-RBD IgM, IgG, and IgA titres, microneutralization titres and c antibodies against human coronavirus d cellular immune subset frequencies between COVID-19 patients with or without dexamethasone treatment (with/without remdesivir). Statistical significance was determined with Kruskal-Wallis test followed by Dunn’s multiple comparisons test. Partial Least-Squares Discriminant Analysis was performed for antibodies measured with multiplex bead array assay. Volcano plots were created using a Wilcoxon rank-sum test and statistics were corrected with FDR adjustment. V1, hospital admission; V7, hospital discharge.

References

    1. Gallo Marin B, et al.Predictors of COVID-19 severity: A literature review. Reviews in Medical Virology 31, e2146 (2021). - PMC - PubMed
    1. Baden LR, et al.. Efficacy and Safety of the mRNA-1273 SARS-CoV-2 Vaccine. New England Journal of Medicine 384, 403–416 (2020). - PMC - PubMed
    1. Xia S, et al.. Safety and immunogenicity of an inactivated SARS-CoV-2 vaccine, BBIBP-CorV: a randomised, double-blind, placebo-controlled, phase 1/2 trial. The Lancet Infectious Diseases 21, 39–51 (2021). - PMC - PubMed
    1. Keech C, et al.Phase 1–2 Trial of a SARS-CoV-2 Recombinant Spike Protein Nanoparticle Vaccine. New England Journal of Medicine 383, 2320–2332 (2020). - PMC - PubMed
    1. Rana MA, et al.. Comparison of Efficacy of Dexamethasone and Methylprednisolone in Improving PaO2/FiO2 Ratio Among COVID-19 Patients. Cureus 12, e10918–e10918 (2020). - PMC - PubMed

Publication types

LinkOut - more resources