[Preprint]. 2021 Aug 24:2021.08.24.457187.
doi: 10.1101/2021.08.24.457187.

Profiling Transcription Initiation in Peripheral Leukocytes Reveals Severity-Associated Cis-Regulatory Elements in Critical COVID-19

Affiliations

Profiling Transcription Initiation in Peripheral Leukocytes Reveals Severity-Associated Cis-Regulatory Elements in Critical COVID-19

Michael Tun Yin Lam et al. bioRxiv. .

Update in

Abstract

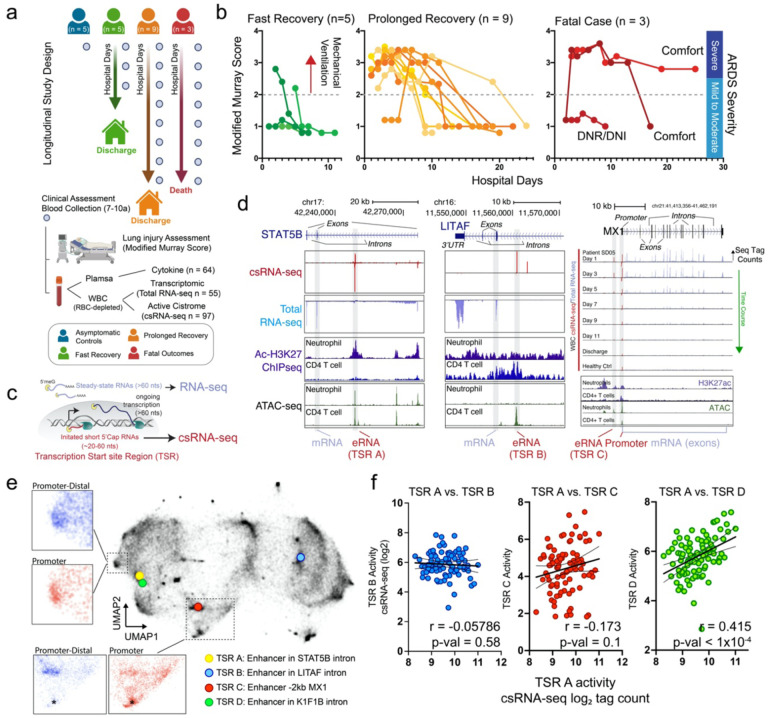
The contribution of transcription factors (TFs) and gene regulatory programs in the immune response to COVID-19 and their relationship to disease outcome is not fully understood. Analysis of genome-wide changes in transcription at both promoter-proximal and distal cis-regulatory DNA elements, collectively termed the 'active cistrome,' offers an unbiased assessment of TF activity identifying key pathways regulated in homeostasis or disease. Here, we profiled the active cistrome from peripheral leukocytes of critically ill COVID-19 patients to identify major regulatory programs and their dynamics during SARS-CoV-2 associated acute respiratory distress syndrome (ARDS). We identified TF motifs that track the severity of COVID- 19 lung injury, disease resolution, and outcome. We used unbiased clustering to reveal distinct cistrome subsets delineating the regulation of pathways, cell types, and the combinatorial activity of TFs. We found critical roles for regulatory networks driven by stimulus and lineage determining TFs, showing that STAT and E2F/MYB regulatory programs targeting myeloid cells are activated in patients with poor disease outcomes and associated with single nucleotide genetic variants implicated in COVID-19 susceptibility. Integration with single-cell RNA-seq found that STAT and E2F/MYB activation converged in specific neutrophils subset found in patients with severe disease. Collectively we demonstrate that cistrome analysis facilitates insight into disease mechanisms and provides an unbiased approach to evaluate global changes in transcription factor activity and stratify patient disease severity.


Figures

Figure 1.
Figure 1.
Activated immune cistrome from peripheral leukocytes of hospitalized COVID-19 patients. a-b. Longitudinal study design sampled plasma and peripheral leukocytes of hospitalized COVID-19 patients across different stages of lung injury quantified by the Modified Murray Lung Injury Score. Ninety-seven samples were included for active cistrome analysis using capped-short RNA-seq (csRNA-seq). For fatal cases, the collection ended after patients transitioned to comfort care. One patient declined resuscitation or intubation (DNR/DNI). c) csRNA-seq captures short 5’ capped RNA species, including active cis-regulatory elements and gene promoters, collectively termed Transcription Start site Regions (TSRs). d) csRNA-seq identifies transcriptional activity (red) in putative enhancers (eRNAs) in the STAT5B (left), LITAF (middle) and MX1 (right) loci. The STAT5B enhancer resides in a neutrophil-specific active chromatin region (+ acetylated H3K27 and + ATAC-seq), whereas the LITAF enhancer resides in CD4 T cell active chromatin region. MX1 eRNA correlates with MX1 gene expression over time. e) Unbiased clustering of 93,465 TSRs grouped by similarity of their activity across 97 samples using Uniform Manifold Approximation Projection (UMAP). Inset shows TSRs residing in the promoter (red) or promoter-distal regions (blue). f) Pearson correlation of csRNA-seq levels from TSR A compared to TSR B (left), TSR C (middle), and TSR D (right).
Figure 2.
Figure 2.
Differential activation of the immune cistrome at different disease states. A) UMAP of TSRs, shaded based on the correlation of their activity profile with lung injury score B) Spearmen correlation analysis of the activities of TSR A (left) and TSR B (right) with modified Murray Lung Injury Score. C) Open-chromatin ATAC-seq enrichment in neutrophils, plasmablasts, monocytes, and Th1 precursor lymphocytes from each TSR visualized on the immune cistrome UMAP (16, 17). Red delineates high ATAC-seq enrichment relative to other hematopoietic cell types. D) Genome-wide relative average TSR activity in asymptomatic controls (n=5) and patients with fast (n=5) or prolonged recovery (n=9) on the first day of enrollment.
Figure 3.
Figure 3.
Distinct cistrome clusters identify co-enrichment of transcription factor (TF) motifs suggestive of co-regulatory mechanisms. a) A logistic regression analysis (MEIRLOP) identified transcription factor (TF) motifs enriched in regulatory elements associated with high (violet) or low (orange) lung injury indices. Each dot represents the enrichment coefficient of TF motifs in TSRs with activity profiles highly correlated with the lung injury index. Error bars represent the lower and upper 95% confidence intervals. The enrichments of all motifs, except for T1ISRE, are all statistically significant (adj. p < 0.0001). b) UMAP representation showing discrete TSR clusters labeled by representative TFs exhibiting the highest enrichment in each cluster. c) Motif analysis depicts co-enrichment of signal-dependent, lineage-determining, and promoter TF motifs. Red depicts the Log2 ratio enrichment of the motif frequency in the TSR cluster relative to all TSRs; blue, depletion. The dot size represents the Fisher Exact Test p-value. Functional enrichment/GO analysis identifies top pathways from genes associated with each TSR cluster.
Figure 4.
Figure 4.
The natural progression of transcriptional programs during the clinical course of COVID19 ARDS. a) Genome-wide kinetic correlation analysis for cistrome activity to hospital days in critically ill COVID19 ARDS survivors (n = 9) with prolonged recovery (the median number of time points is 7 per patient; total = 63 samples). Correlation coefficients for each TSR activity to hospital time are overlaid on the UMAP. Purple indicates higher activity early in the hospital course; yellow, later hospital course. b-e) Time course of TF-activity in clusters enriched for (b) STAT/BCL6, (c) T1ISRE/STAT, (d) NFkB/RBPJ, X-Box/NFY/CRE, and YYI, e) ETS/YY1, CEBP/PU1, and ARE/AP1/SMAD. TF activity represents the median log2 csRNA-seq signals of all TSRs in a given cluster. f-g) Serum cytokines for (f) IL6 and (g) IP-10 implicated in the STAT and Interferon pathway, respectively. Each point represents the median log2 of TSR cluster activity with the color indicating the lung injury score at those time points (violet = high; gold = low). The line and shaded region correspond to the smooth conditional mean and 95% confidence intervals, respectively. h) Gene pathways enriched in the early (purple) and late (yellow) TF programs. Ridge plot shows the time-TSR activity correlation coefficient of genes in the respective pathways.
Figure 5.
Figure 5.
Distinct TSR clusters exhibit significant enrichment of single nucleotide polymorphisms associated with COVID-19 clinical outcome. a) The LZTFL1 locus in chromosome 3p21.31 harbors numerous SNPs associated with COVID-19 clinical outcome (p-value < 5 × 10⁻⁸). SNP A (rs34460587, −log p-value > 15, hospitalization vs. non-hospitalized COVID-19 cases) lies within −300 to + 100 bp of a transcription start sites (TSS) located in the intergenic region between the CCR1 and XCR1 genes. c) UMAP showing the distribution of TSRs with COVID-19 associated SNPs overlap. d) Statistical analysis for enrichment of COVID-19 associated SNPs in TSRs based on lung injury index (left) or TSR clustering (right) using Regulatory Element Locus Intersection (RELI) (31). The color represents the RELI corrected p-values that account for the underlying genetic structure.
Figure 6.
Figure 6.
Dysregulated E2F/MYB, STAT/BCL6, and T1ISRE/STAT programs are associated with severe COVID-19. a) Framework for applying aggregate TF-network target gene expression as a representation of TF activity to validate cistrome-disease relationships in patient clinical outcome and cellular subtypes. b. Pair-wise Pearson’s correlation analysis of TF activity as determined by cistrome (csRNA-seq) and target gene expression (total RNA-seq) for E2F/MYB, STAT/BCL6, and T1ISRE/STAT using 55 matched samples. Correlation coefficients and the p-values for each pair-wise comparison are indicated. c. Spearman correlation of clinical severity (HFD45) with E2F/MYB, STAT/BCL6, and T1ISRE/STAT activity in an external COVID19 cohort (n = 100) (32). Smooth conditional means and 95% confidence intervals are depicted. d) Scatterplot of individual patient samples from the external COVID19 cohort based on STAT/BCL6 (x-axis) and E2F/MYB (y-axis) activity. The color of each point represents clinical disease severity (Red = severe; green = mild). The dash lines demarcate the medians for STAT/BCL6 (vertical) and E2F/MYB (horizontal) activity. The fatal cases for each quadrant are significantly different (Chi-square, p-value = 0.004, two-tailed). e-g) The average HFD45 for patient subgroups based on the activity of (e) E2F/MYB and STAT/BCL6, (f) E2F/MYB and T1ISRE/STAT, and (g) T1ISRE/STAT and STAT/BCL6. Error bars represent 95% confidence intervals from the mean (horizontal lines). One-way ANOVA with multiple comparisons shows statistical differences between subgroups. Adjusted p-values * < 0.05, ** < 0.005, *** < 0.0005. h) Three neutrophil subsets identified from COVID19 peripheral leukocyte single-cell RNA-seq analysis (8). i) Distribution of activities in E2F/MYB, STAT/BCL6, and T1ISRE/STAT programs per cell in each neutrophil subset. j) The cellular distribution of neutrophil subsets in control and COVID19 patients with mild and severe disease.

References

    1. Liao M, Liu Y, Yuan J, Wen Y, Xu G, Zhao J, et al. Single-cell landscape of bronchoalveolar immune cells in patients with COVID-19. Nature medicine. 2020;26(6):842–4. - PubMed
    1. Wilk AJ, Rustagi A, Zhao NQ, Roque J, Martinez-Colon GJ, McKechnie JL, et al. A single-cell atlas of the peripheral immune response in patients with severe COVID-19. Nature medicine. 2020;26(7):1070–6. - PMC - PubMed
    1. Hadjadj J, Yatim N, Barnabei L, Corneau A, Boussier J, Smith N, et al. Impaired type I interferon activity and inflammatory responses in severe COVID-19 patients. Science (New York, NY). 2020;31:eabc6027–15. - PMC - PubMed
    1. Mathew D, Giles JR, Baxter AE, Oldridge DA, Greenplate AR, Wu JE, et al. Deep immune profiling of COVID-19 patients reveals distinct immunotypes with therapeutic implications. Science (New York, NY). 2020;369(6508). - PMC - PubMed
    1. Moderbacher CR, Ramirez SI, Dan JM, Grifoni A, Hastie KM, Weiskopf D, et al. Antigen-Specific Adaptive Immunity to SARS-CoV-2 in Acute COVID-19 and Associations with Age and Disease Severity. Cell. 2020;183(4):996–1012.e19. - PMC - PubMed

Publication types