[Preprint]. 2021 Sep 16:2021.08.18.21262258.
doi: 10.1101/2021.08.18.21262258.

TREATMENT WITH SOLUBLE CD24 ATTENUATES COVID-19-ASSOCIATED SYSTEMIC IMMUNOPATHOLOGY

Affiliations

TREATMENT WITH SOLUBLE CD24 ATTENUATES COVID-19-ASSOCIATED SYSTEMIC IMMUNOPATHOLOGY

No-Joon Song et al. medRxiv. .

Update in

  • Treatment with soluble CD24 attenuates COVID-19-associated systemic immunopathology.
    Song NJ, Allen C, Vilgelm AE, Riesenberg BP, Weller KP, Reynolds K, Chakravarthy KB, Kumar A, Khatiwada A, Sun Z, Ma A, Chang Y, Yusuf M, Li A, Zeng C, Evans JP, Bucci D, Gunasena M, Xu M, Liyanage NPM, Bolyard C, Velegraki M, Liu SL, Ma Q, Devenport M, Liu Y, Zheng P, Malvestutto CD, Chung D, Li Z. Song NJ, et al. J Hematol Oncol. 2022 Jan 10;15(1):5. doi: 10.1186/s13045-021-01222-y. J Hematol Oncol. 2022. PMID: 35012610 Free PMC article. Clinical Trial.

Abstract

Background: SARS-CoV-2 causes COVID-19 through direct lysis of infected lung epithelial cells, which releases damage-associated molecular patterns (DAMPs) and induces a pro-inflammatory cytokine milieu causing systemic inflammation. Anti-viral and anti-inflammatory agents have shown limited therapeutic efficacy. Soluble CD24 (CD24Fc) is able to blunt the broad inflammatory response induced by DAMPs in multiple models. A recent randomized phase III trial evaluating the impact of CD24Fc in patients with severe COVID-19 demonstrated encouraging clinical efficacy.

Methods: We studied peripheral blood samples obtained from patients enrolled at a single institution in the SAC-COVID trial (NCT04317040) collected before and after treatment with CD24Fc or placebo. We performed high dimensional spectral flow cytometry analysis of peripheral blood mononuclear cells and measured the levels of a broad array of cytokines and chemokines. A systems analytical approach was used to discern the impact of CD24Fc treatment on immune homeostasis in patients with COVID-19.

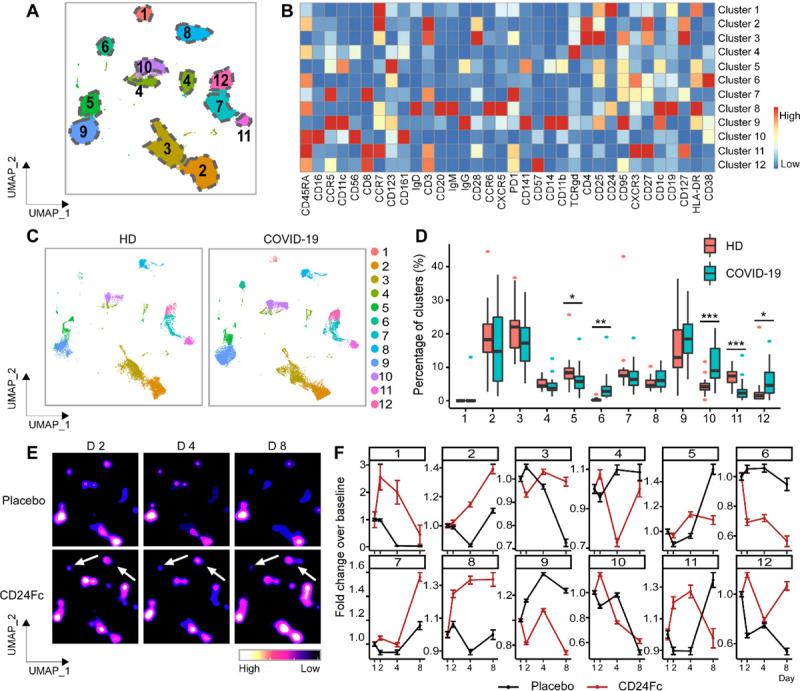
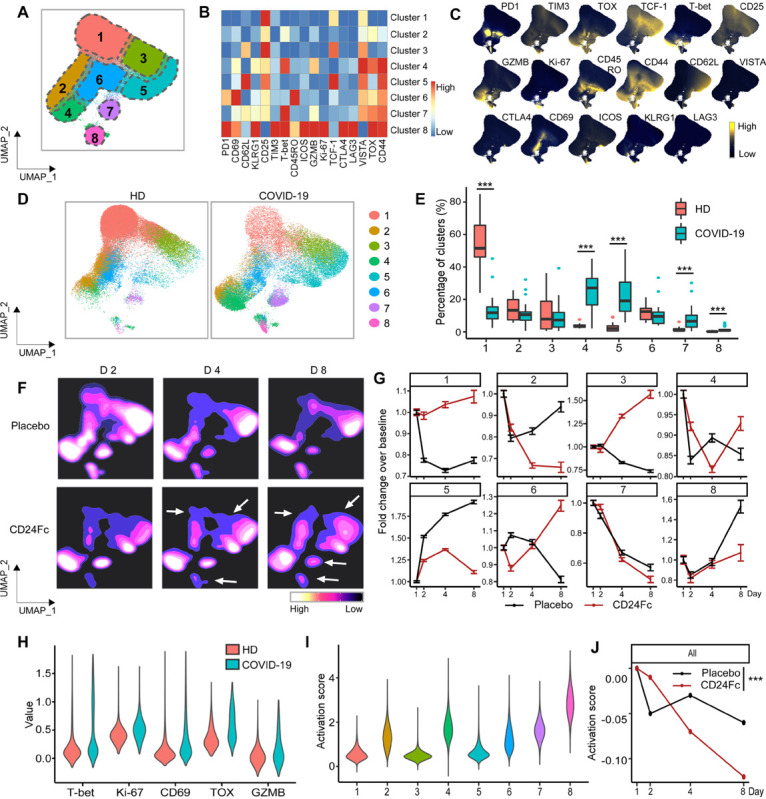
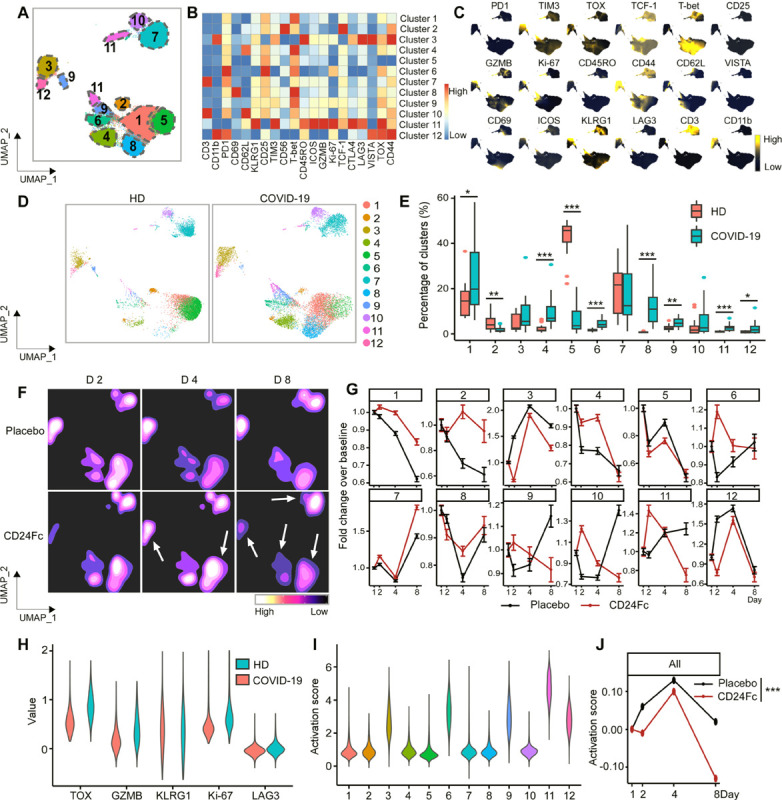
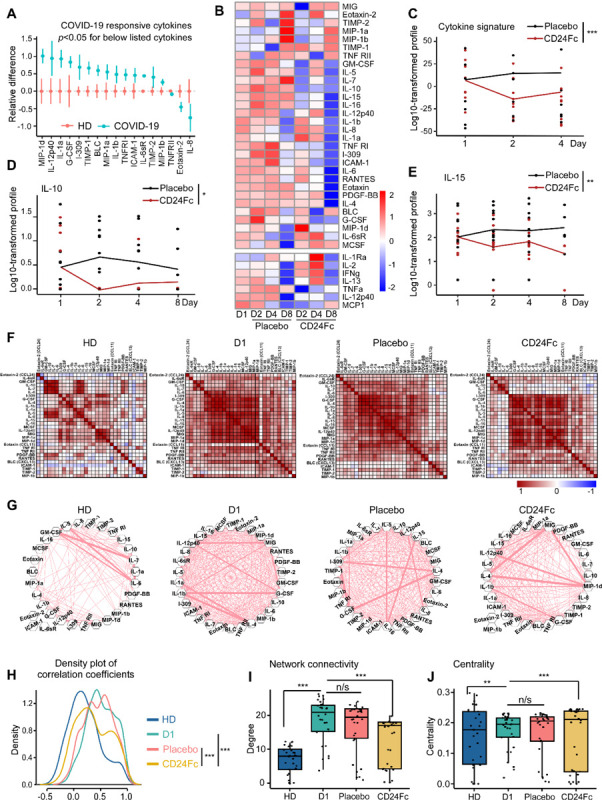
Findings: Twenty-two patients were enrolled, and the clinical characteristics from the CD24Fc vs. placebo groups were matched. Using high-content spectral flow cytometry and network-level analysis, we found systemic hyper-activation of multiple cellular compartments in the placebo group, including CD8+ T cells, CD4+ T cells, and CD56+ NK cells. By contrast, CD24Fc-treated patients demonstrated blunted systemic inflammation, with a return to homeostasis in both NK and T cells within days without compromising the ability of patients to mount an effective anti-Spike protein antibody response. A single dose of CD24Fc significantly attenuated induction of the systemic cytokine response, including expression of IL-10 and IL-15, and diminished the coexpression and network connectivity among extensive circulating inflammatory cytokines, the parameters associated with COVID-19 disease severity.

Interpretation: Our data demonstrates that CD24Fc treatment rapidly down-modulates systemic inflammation and restores immune homeostasis in SARS-CoV-2-infected individuals, supporting further development of CD24Fc as a novel therapeutic against severe COVID-19.

Funding: NIH.


Figures

Figure 1.
Figure 1.. Population dynamics of peripheral blood mononuclear cells from healthy donors vs. patients with COVID-19 treated with placebo or CD24Fc.
A total of 1,306,473 PBMCs from HD (n=17) and COVID-19 patients (n=22) were clustered using an unbiased multivariate t-mixture model, which identified 12 sub-clusters that reflect statistically distinct cell states. Visualization of the relative similarity of each cell and cell cluster on the two-dimensional UMAP space with a 10% downsampling (Panel A). Cluster-by-marker heatmap characterizing the expression patterns of individual clusters (Panel B). UMAP dot plots (Panel C) and cluster frequencies (Panel D) of HD vs. baseline COVID-19 patient samples (cluster 5, p=0.03; cluster 6, p=0.001; cluster 10, p<0.001; cluster 11, p<0.001). Contour plots representing the density of cells throughout regions of the UMAP space from COVID-19 patients D2, D4, and D8 after CD24Fc vs. placebo treatment (Panel E, white arrows indicate visual changes between CD24Fc vs. placebo contour plots). Selected cluster population dynamics as fold change over baseline for each group over time (Panel F) (D2: placebo n=12, CD24Fc n=10; D4: placebo n=11, CD24Fc n=9; D8: placebo n=4, CD24Fc n=3). The p-value was calculated using the Kenward-Roger method. *, p<0.05; **, p<0.01; ***, p<0.001.
Figure 2.
Figure 2.. Subcluster analysis of peripheral blood CD8+ T cells in COVID-19 patients: activation following SARS-CoV2 infection is dampened by CD24Fc treatment.
A total of 1,466,822 CD8+ cells from HD (n=17) and COVID-19 (n=22) patients were clustered using an unbiased multivariate t-mixture model, which identified 8 CD8+ sub-clusters that reflect statistically distinct CD8+ T cell activation states. The relative similarity of each cell and cell cluster on the two-dimensional UMAP space were visualized with a 10% downsampling (Panel A). Using median expression of flow cytometry markers, a cluster-by-marker heatmap was generated to characterize the subsets (Panel B) and visualize individual marker expression patterns on the UMAP space (Panel C). To understand the effect of SARS-CoV2 infection on cell population dynamics, a comparison was made with UMAP dot plots (Panel D) and cluster frequencies (Panel E) of HD vs. baseline COVID-19 patient samples (cluster 1, p<0.001; cluster 4, p<0.001; cluster 5, p<0.001; cluster 7, p<0.001; cluster 8, p<0.001). The samples from COVID-19 patients 2, 4, and 8 days after CD24Fc vs. placebo treatment were displayed using contour plots to represent the density of cells throughout regions of the UMAP space (Panel F, white arrows indicate visual changes between CD24Fc vs. placebo contour plots). The cluster population dynamics as fold change over baseline in each treatment group was shown (Panel G; sample distribution described in Fig 1F legend). To better characterize the activation status of CD8 T cells, a subset of markers (T-bet, Ki-67, CD69, TOX, GZMB) was linearly transformed to create a univariate cell-level activation score (Panel H), where highly activated cell clusters (such as cluster 8) had highest activation scores (Panel I). A GLMM was then to fit to the longitudinal cell-level activation scores to assess the effect of CD24Fc treatment on activation scores over time (Panel J). The p-value was calculated using the Kenward-Roger method. ***, p<0.001.
Figure 3.
Figure 3.. Subcluster analysis of peripheral blood NK cells in COVID-19 patients: activation of following SARS-CoV2 infection is dampened by CD24Fc treatment.
CD56+ cells (n=783,623) from HD (n=17) and COVID-19 (n=22) patients were clustered using an unbiased multivariate t-mixture model, which identified 12 sub-clusters that reflect statistically distinct CD56+ T cell activation states. The relative similarity of each cell and cell cluster on the two-dimensional UMAP space were visualized with a 10% downsampling (Panel A). Using median expression of flow cytometry markers, a cluster-by-marker heatmap were generated to characterize the subsets (Panel B) and visualize individual marker expression patterns on the UMAP space (Panel C). To understand the effect of SARS-CoV2 infection on NK cell population dynamics, a comparison was made with UMAP dot plots (Panel D) and cluster frequencies (Panel E) of HD vs. baseline COVID-19 patient samples. The day 2, 4, 8 samples from placebo and CD24Fc-treated patient groups were visualized using contour plots to represent the density of cells throughout regions of the UMAP space (Panel F, white arrows indicate visual changes between CD24Fc vs. placebo contour plots). The cluster population dynamics as fold change over baseline in each treatment group was shown (Panel G; sample distribution described in Fig 1 legend). To better characterize the activation status of NK cells, a subset of markers (TOX, GZMB, KLRG1, Ki-67, LAG-3) was linearly transformed to create a univariate cell-level activation score (Panel H), where highly activated cell clusters (such as cluster 11) had highest activation scores (Panel I). A GLMM was then fit to the longitudinal cell-level activation scores to assess the effect of CD24Fc treatment on activation scores over time (Panel J). The p-value was calculated using the Kenward-Roger method. *, p<0.05; **, p<0.01; ***, p<0.001.
Figure 4.
Figure 4.. CD24Fc treatment downregulates systemic cytokine response in patients with COVID-19.
The relative differences in plasma concentrations of cytokines/chemokines between HD (n=25) and COVID-19 patients (n=22) is shown. Values were log-transformed and evaluated using independent sample t-test. Only significantly up- and down-regulated markers are shown (Panel A). The heatmap analysis (Panel B) was used to visualize the relative levels of plasma cytokines/chemokines in placebo vs. CD24Fc-treated patients at indicated time points (Placebo: D1 n=12, D2 n=12, D4 n=11, D8 n=5; CD24Fc: D1 n=10, D2 n=10, D4 n=9, D8 n=3). To compare longitudinal patterns across groups, each cytokine had its group-specific baseline mean adjusted to match the overall mean at D1 and consequent time points are normalized accordingly, followed by scaling-by-row. The cytokine score was analyzed longitudinally using weighed sum approach (Panel C; p<0.001). Using log-10 transformation of cytokine concentrations (dots) and GLMM predicted fixed effects trends (lines), the changes in IL-10 (Panel D; p=0.05) and IL-15 (Panel E; p=0.002) levels in CD24Fc (red) and placebo (black) groups were revealed. Values and trend lines were centered at D1 mean. The p-value was calculated using the Kenward-Roger method. Using Pearson correlation matrices (Panel F; darker red indicates stronger correlation) and network maps (Panel G; weight of edge represents correlation coefficient), 30 plasma markers in HD (n=25), COVID-19 baseline (D1, n=22), placebo (pooled D2-D8, n=28), and CD24Fc-treated (pooled D2–D8, n=24) groups were visualized. Using these correlation coefficients, a density plot between 30 plasma cytokines (Panel H; D1 vs placebo, p=0.07; D1 vs CD24Fc, p<0.001; placebo vs CD24Fc, p<0.001) was constructed. Kolmogorov-Smirnov test was used to evaluate equality of densities between groups. Analysis of connectivity (Panel I) and centrality analysis of cytokine network (Panel J) display the cytokine expression relationships within each group. Network connectivity plots display highly correlated connections for each cytokine (i.e., node degree) and evaluated using paired t-test. Centrality analysis of cytokine network used eigenvector centrality score that considers global network connectivity and correlation coefficients between cytokines (HD vs D1, p<0.001; D1 vs placebo, p=0.08; D1 vs CD24Fc, p<0.001). Bartlett’s test was performed to evaluate the significance of variance of centrality scores (HD vs D1, p=0.013; D1 vs placebo, p=0.17; D1 vs CD24Fc, p=0.008). Each dot in Panel I and J represents a cytokine. *, p<0.05; **, p<0.01; ***, p<0.001.

References

    1. Hoffmann M, Kleine-Weber H, Schroeder S, et al. SARS-CoV-2 Cell Entry Depends on ACE2 and TMPRSS2 and Is Blocked by a Clinically Proven Protease Inhibitor. Cell 2020; 181(2): 271–80 e8. - PMC - PubMed
    1. Cicco S, Cicco G, Racanelli V, Vacca A. Neutrophil Extracellular Traps (NETs) and Damage-Associated Molecular Patterns (DAMPs): Two Potential Targets for COVID-19 Treatment. Mediators Inflamm 2020; 2020: 7527953. - PMC - PubMed
    1. Cao X. COVID-19: immunopathology and its implications for therapy. Nat Rev Immunol 2020; 20(5): 269–70. - PMC - PubMed
    1. Thompson MG, Burgess JL, Naleway AL, et al. Prevention and Attenuation of Covid-19 with the BNT162b2 and mRNA-1273 Vaccines. N Engl J Med 2021; 385(4): 320–9. - PMC - PubMed
    1. Planas D, Veyer D, Baidaliuk A, et al. Reduced sensitivity of SARS-CoV-2 variant Delta to antibody neutralization. Nature 2021; 596(7871): 276–80. - PubMed

Publication types