. 2021 Aug 13:10:e66417.
doi: 10.7554/eLife.66417.

Adult stem cell-derived complete lung organoid models emulate lung disease in COVID-19

Affiliations

Adult stem cell-derived complete lung organoid models emulate lung disease in COVID-19

Courtney Tindle et al. Elife. .

Abstract

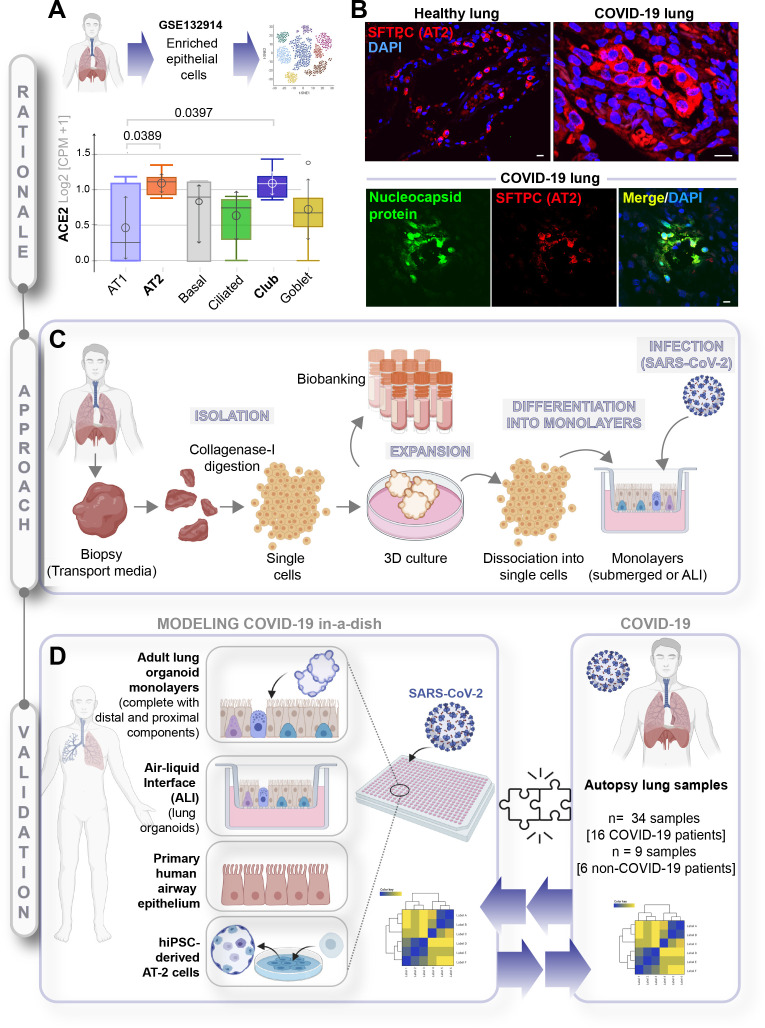
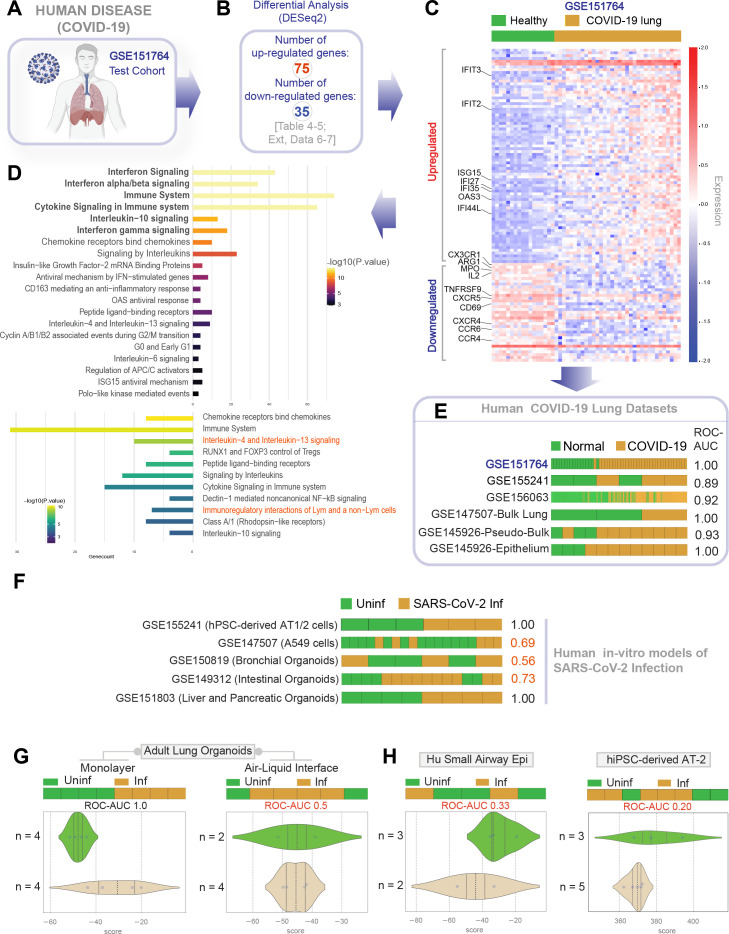
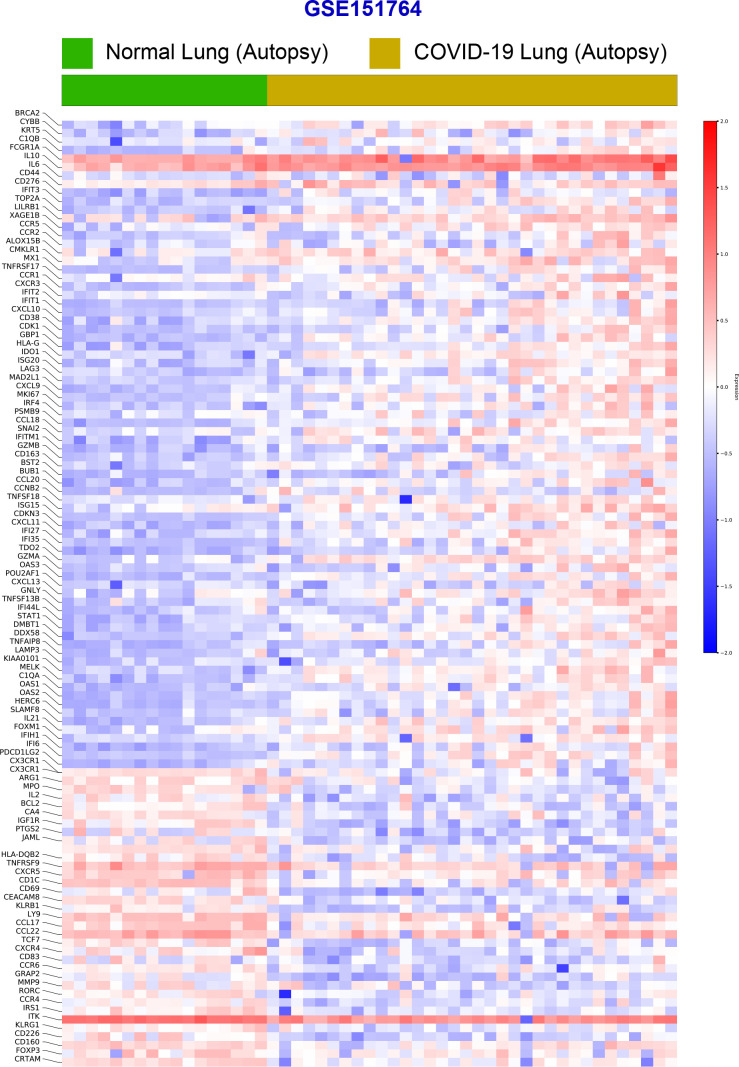
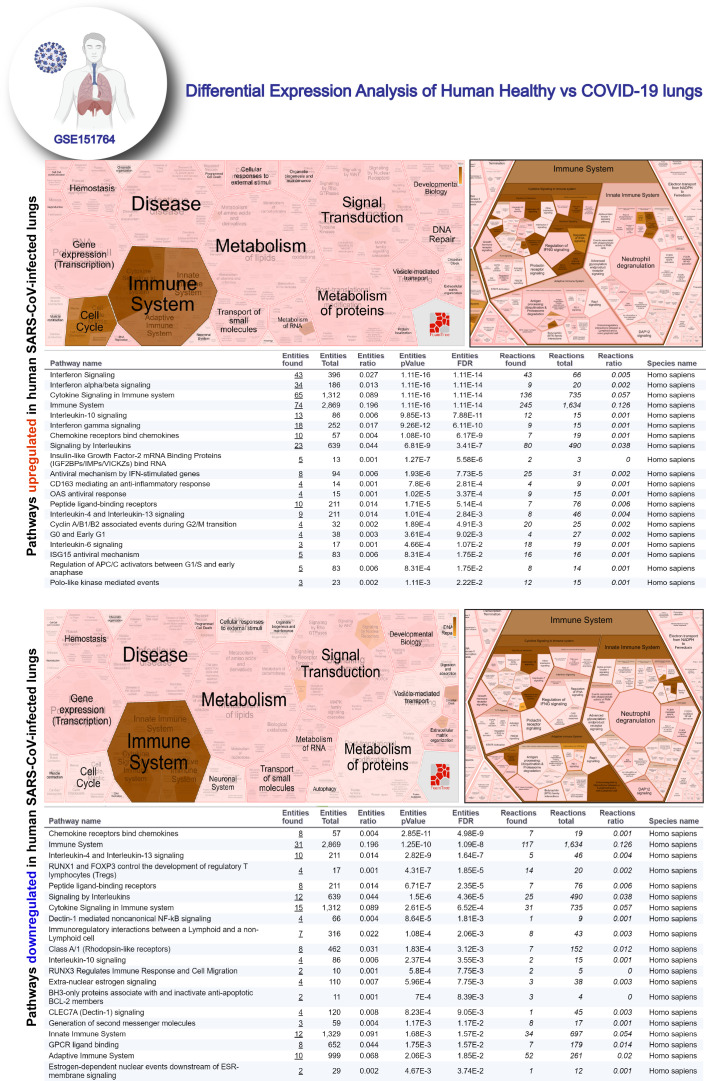
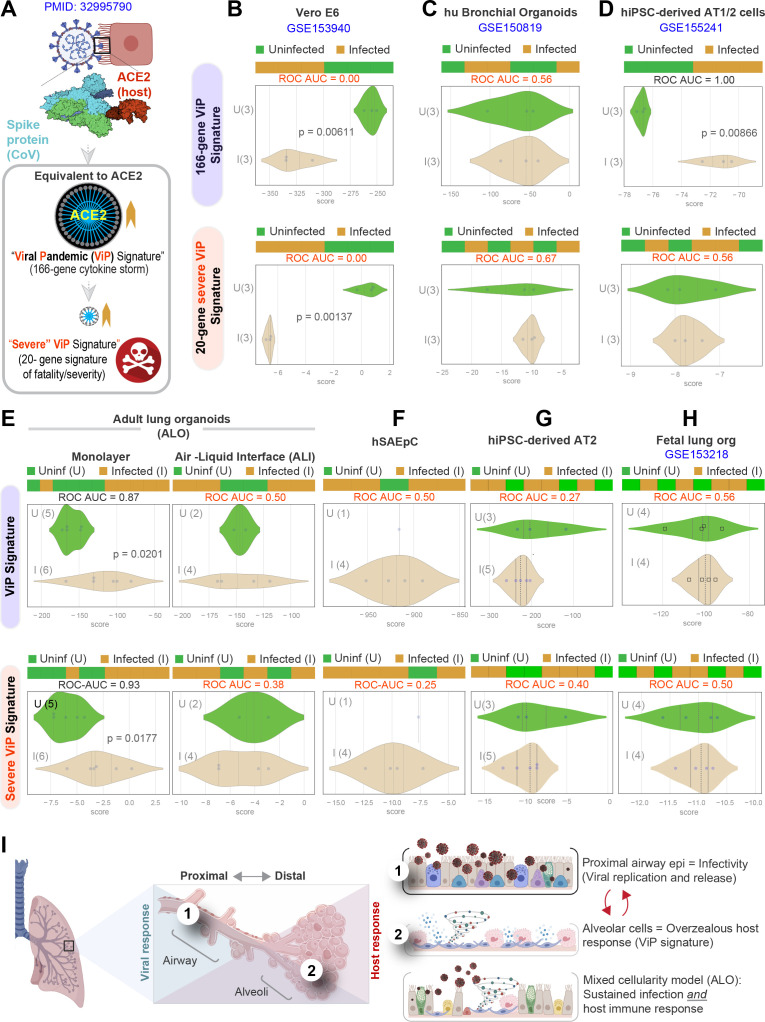
Background: SARS-CoV-2, the virus responsible for COVID-19, causes widespread damage in the lungs in the setting of an overzealous immune response whose origin remains unclear.

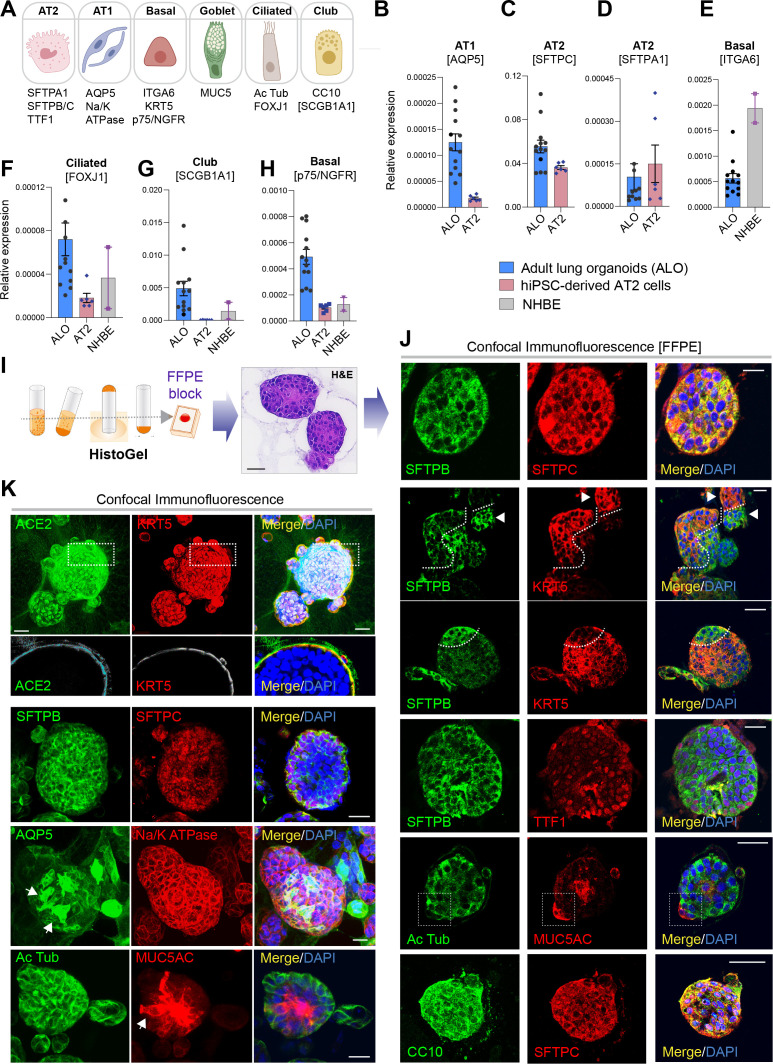
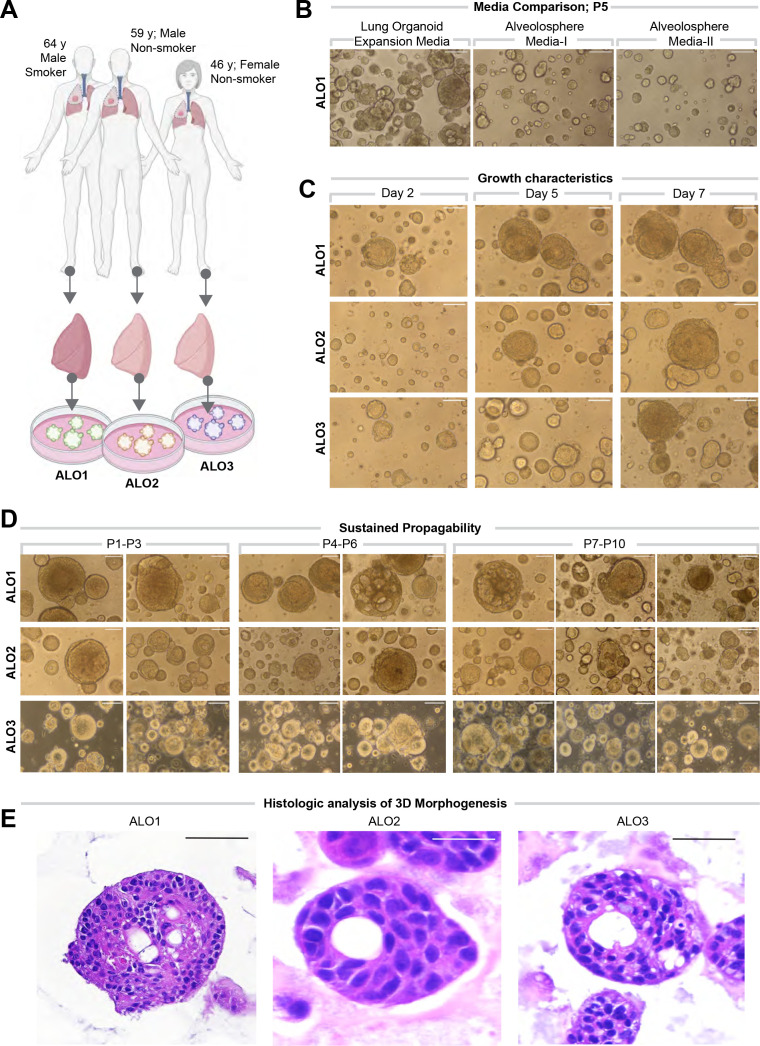
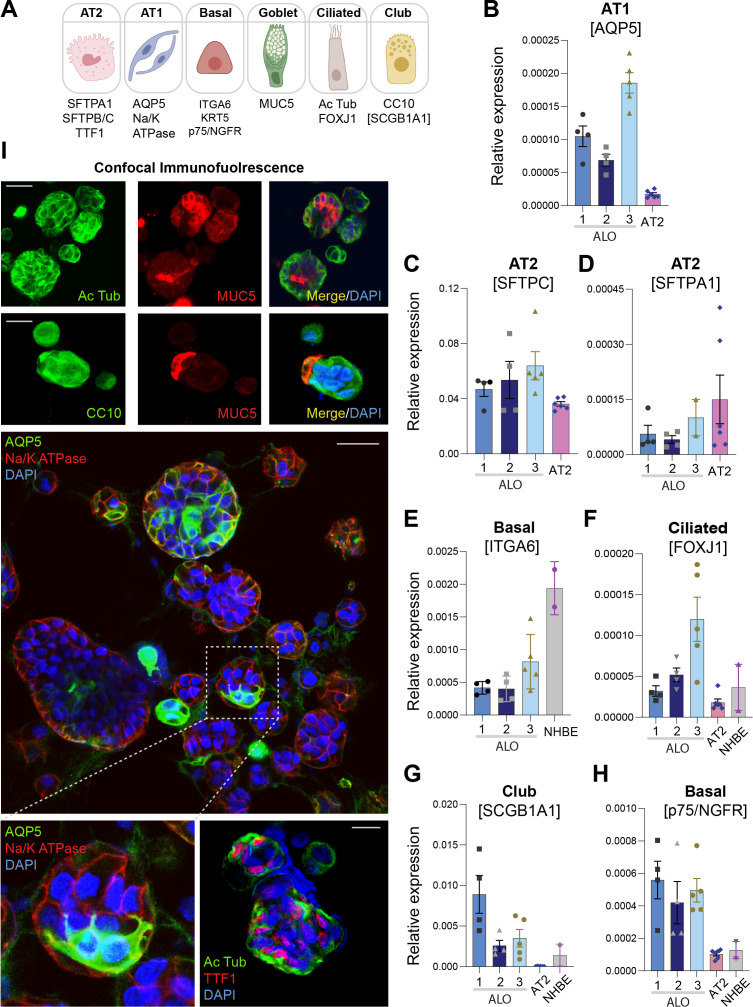
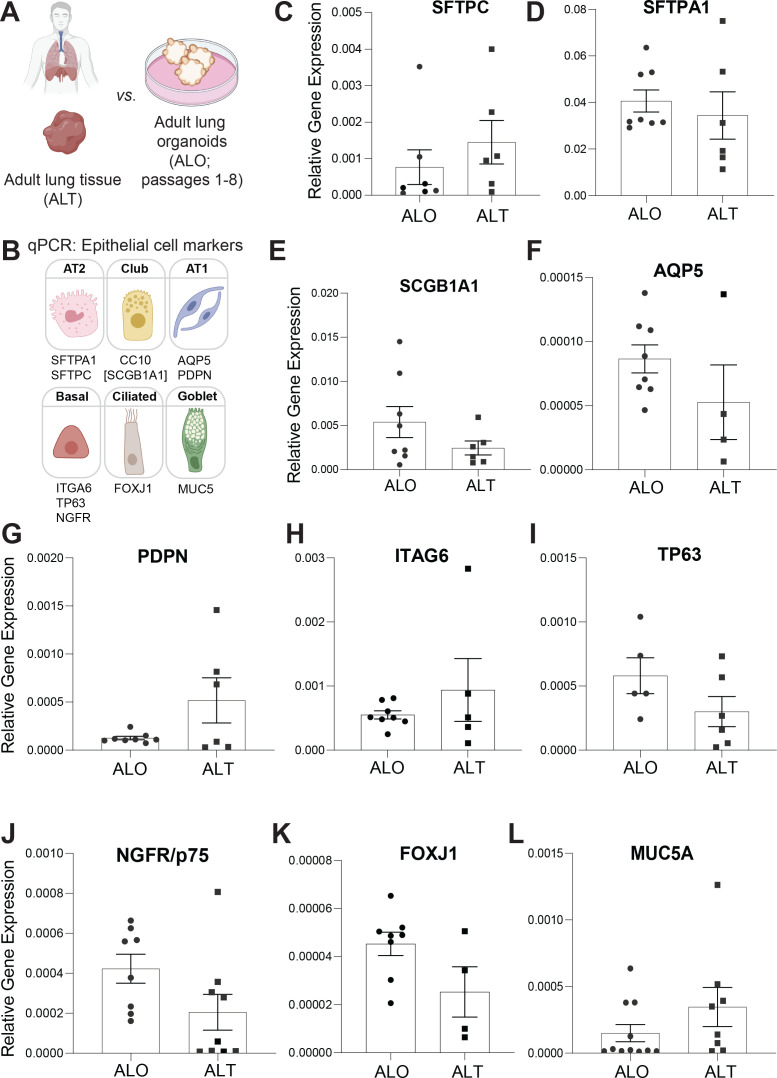
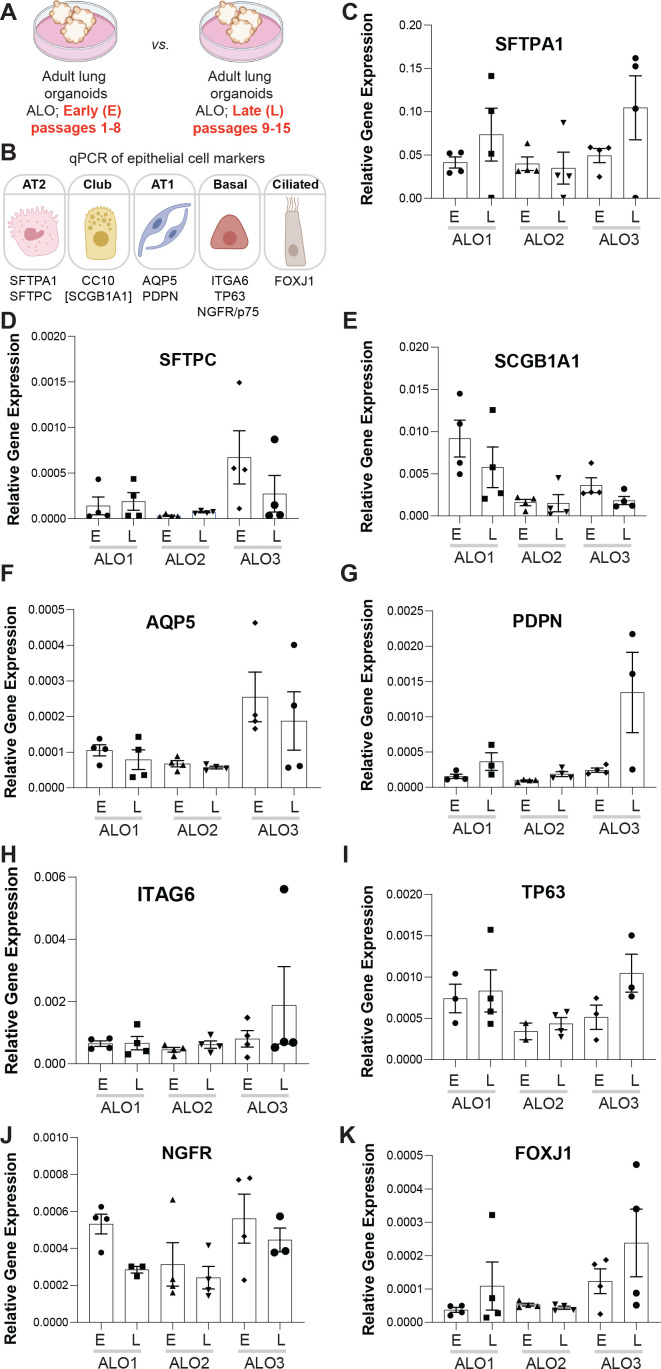
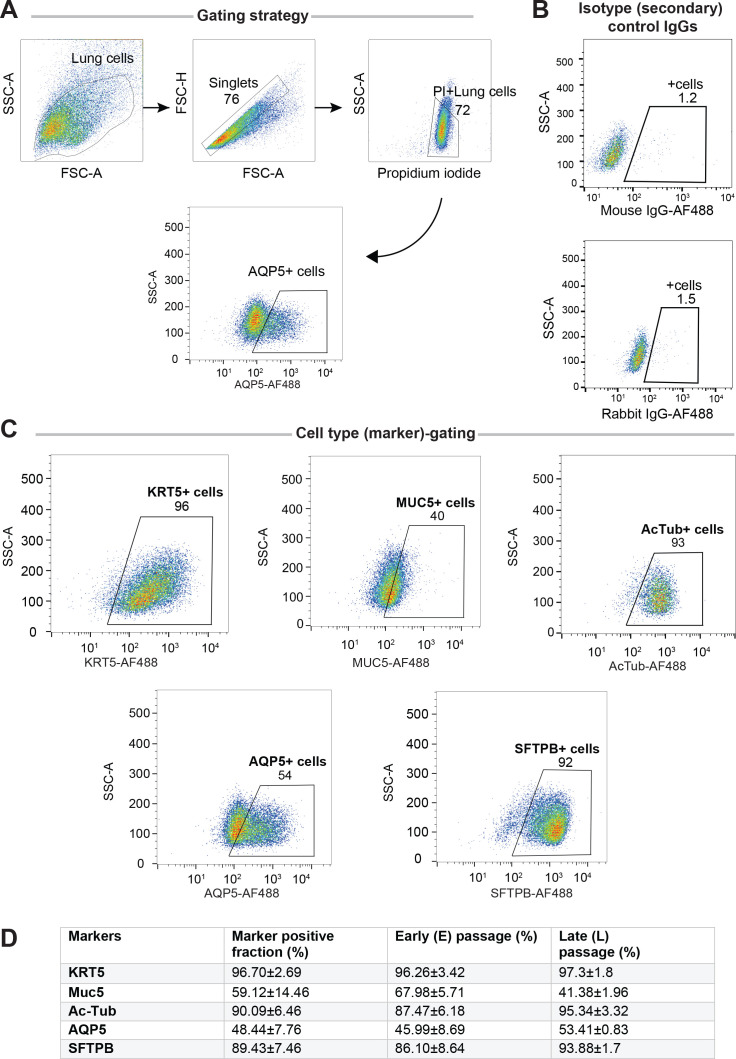
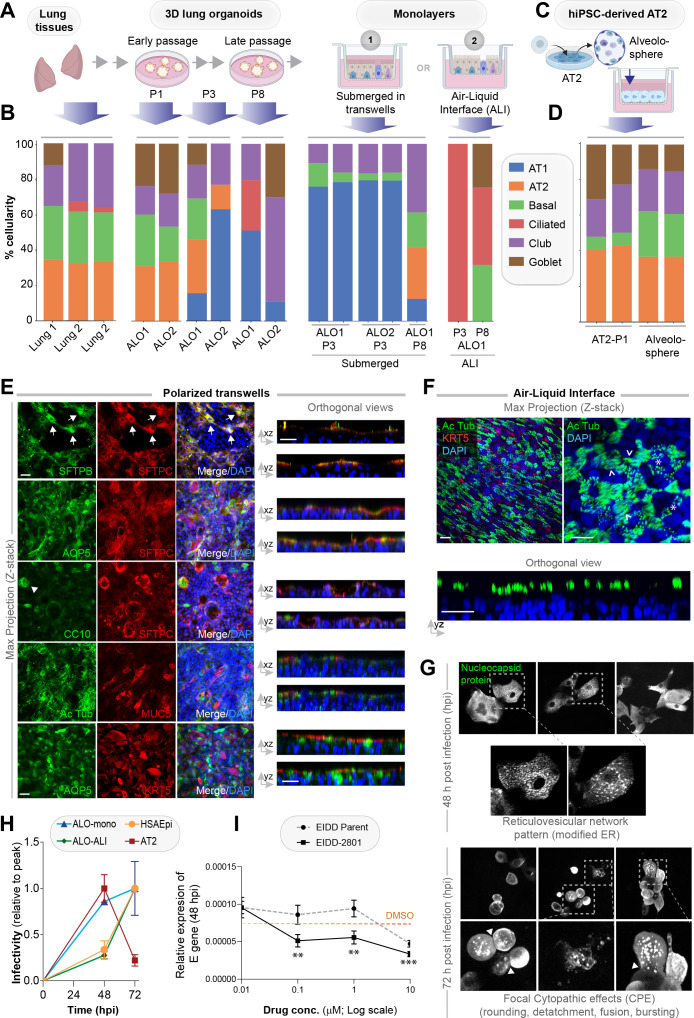
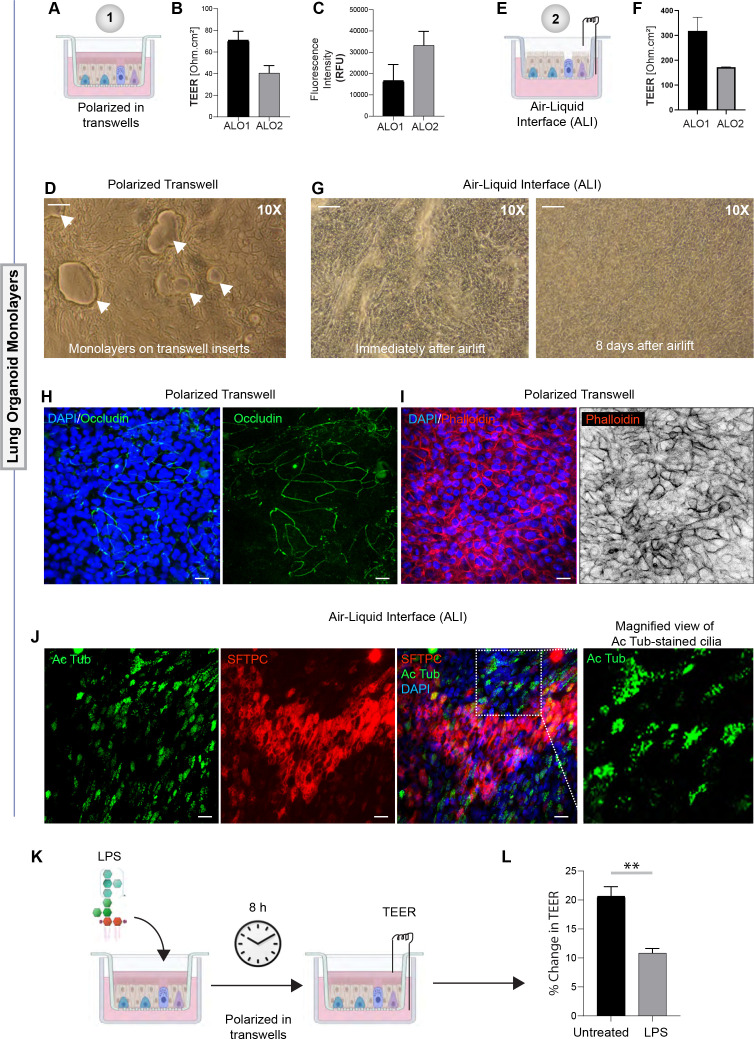
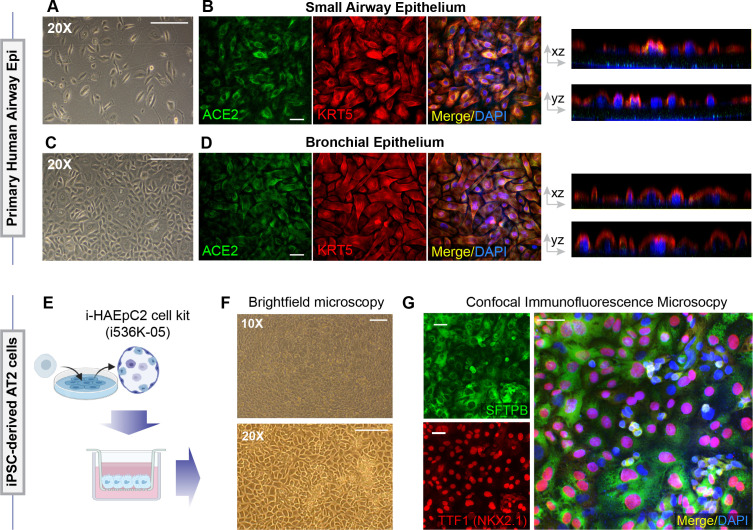
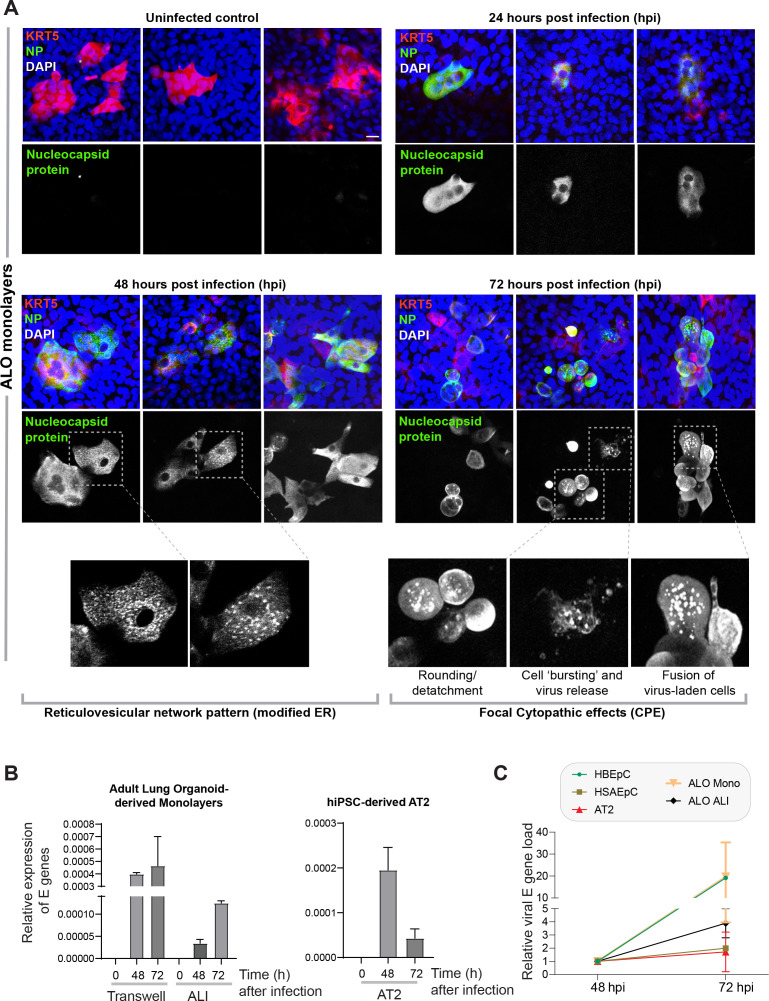
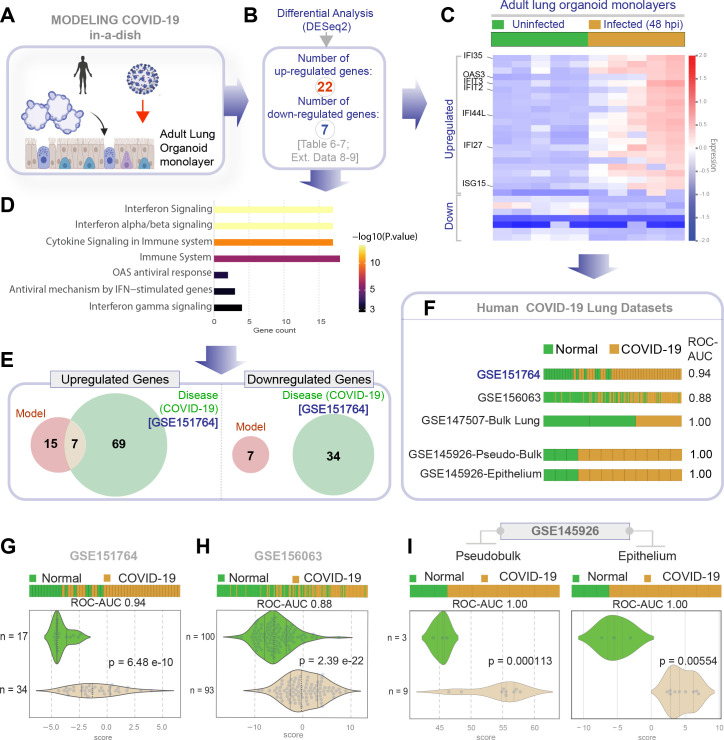
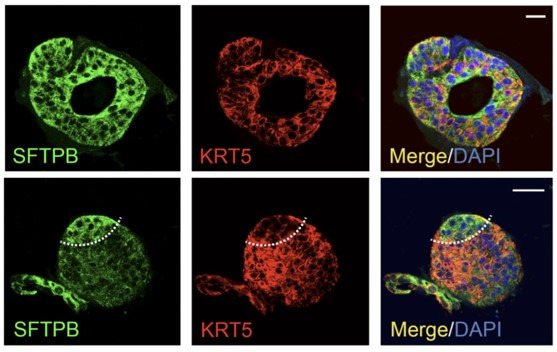
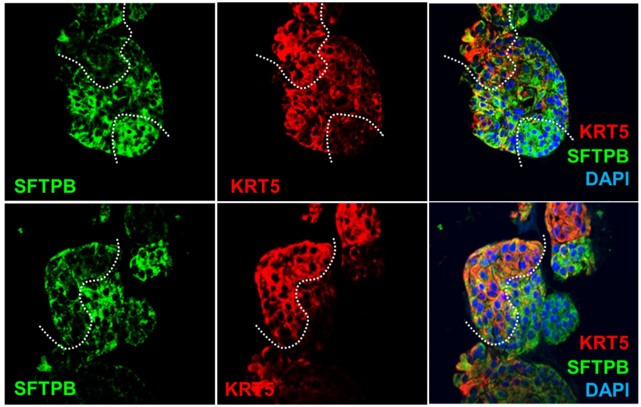
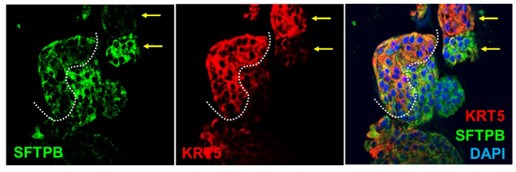
Methods: We present a scalable, propagable, personalized, cost-effective adult stem cell-derived human lung organoid model that is complete with both proximal and distal airway epithelia. Monolayers derived from adult lung organoids (ALOs), primary airway cells, or hiPSC-derived alveolar type II (AT2) pneumocytes were infected with SARS-CoV-2 to create in vitro lung models of COVID-19.

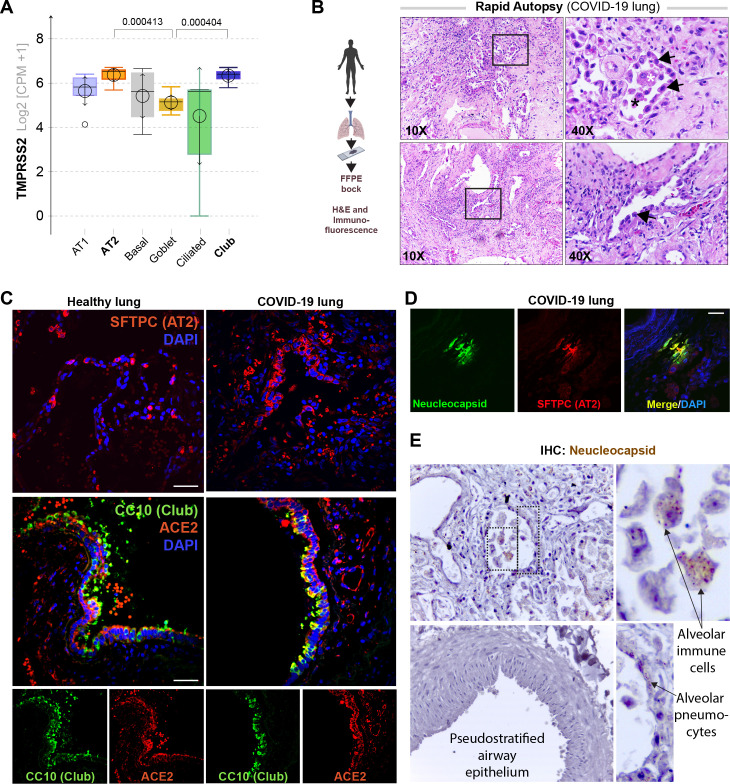
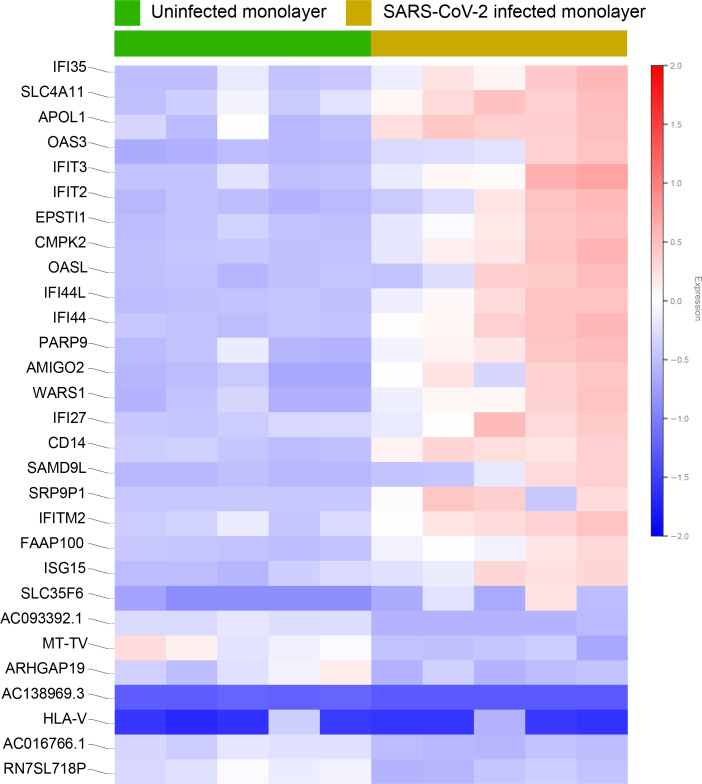
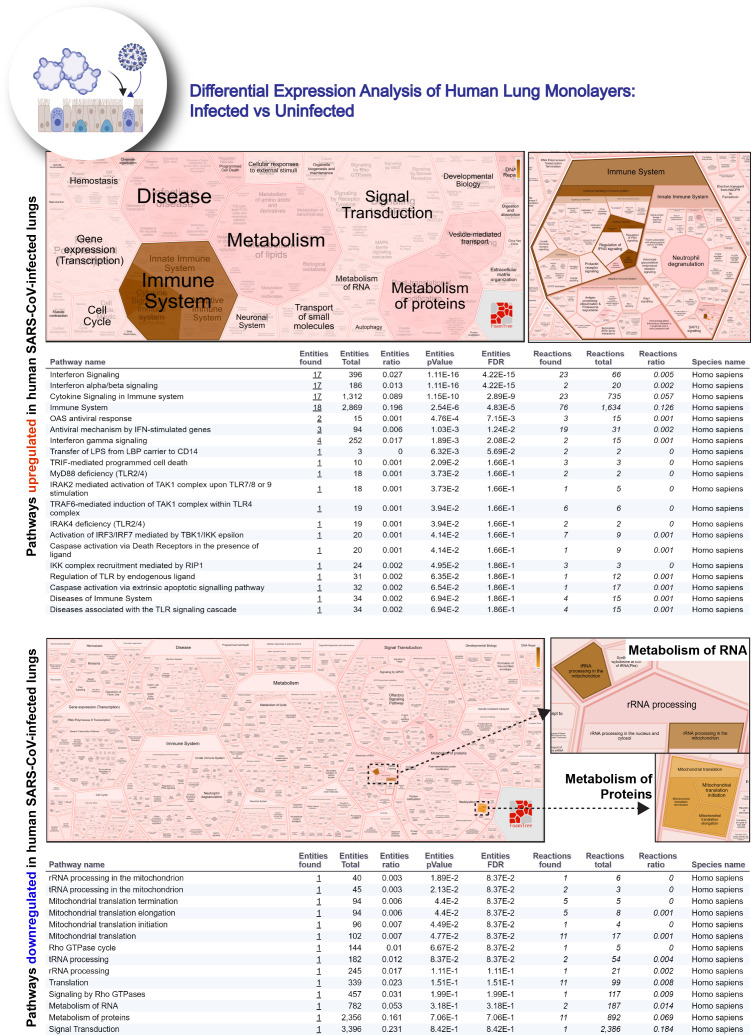
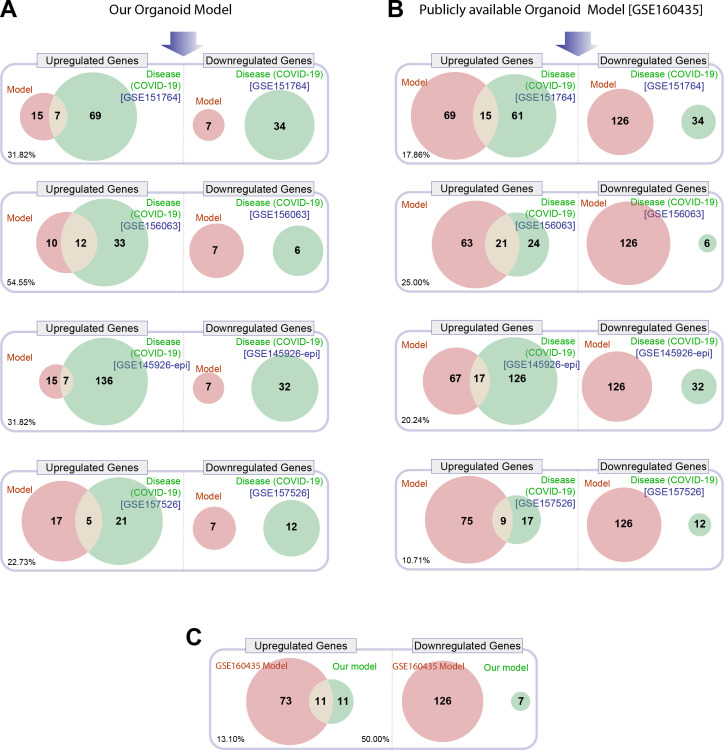
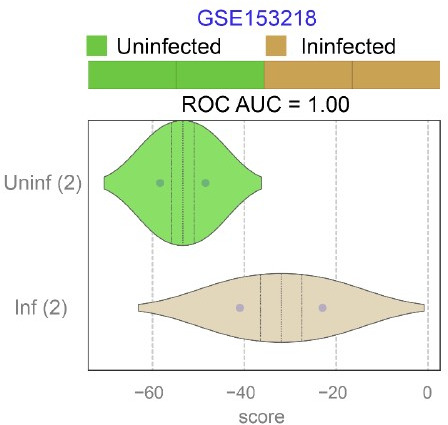
Results: Infected ALO monolayers best recapitulated the transcriptomic signatures in diverse cohorts of COVID-19 patient-derived respiratory samples. The airway (proximal) cells were critical for sustained viral infection, whereas distal alveolar differentiation (AT2→AT1) was critical for mounting the overzealous host immune response in fatal disease; ALO monolayers with well-mixed proximodistal airway components recapitulated both.

Conclusions: Findings validate a human lung model of COVID-19, which can be immediately utilized to investigate COVID-19 pathogenesis and vet new therapies and vaccines.

Funding: This work was supported by the National Institutes for Health (NIH) grants 1R01DK107585-01A1, 3R01DK107585-05S1 (to SD); R01-AI141630, CA100768 and CA160911 (to PG) and R01-AI 155696 (to PG, DS and SD); R00-CA151673 and R01-GM138385 (to DS), R01- HL32225 (to PT), UCOP-R00RG2642 (to SD and PG), UCOP-R01RG3780 (to P.G. and D.S) and a pilot award from the Sanford Stem Cell Clinical Center at UC San Diego Health (P.G, S.D, D.S). GDK was supported through The American Association of Immunologists Intersect Fellowship Program for Computational Scientists and Immunologists. L.C.A's salary was supported in part by the VA San Diego Healthcare System. This manuscript includes data generated at the UC San Diego Institute of Genomic Medicine (IGC) using an Illumina NovaSeq 6000 that was purchased with funding from a National Institutes of Health SIG grant (#S10 OD026929).

Keywords: AT2 differentiation; SARS-CoV2; computational; disease modeling; human; immune response; lung organoid; medicine; regenerative medicine; stem cells; viruses.


Conflict of interest statement

CT, AF, ST, SI, NB, GK, AC, VC, MH, HR, JD, LC, AT, GL, PT, RC, TR, DS, PG, SD None, MF none

Figures

Figure 1.
Figure 1.. A rationalized approach to building and validating human preclinical models of COVID-19.
A) Whisker plots display relative levels of angiotensin-converting enzyme II (ACE2) expression in various cell types in the normal human lung. The cell types were annotated within a publicly available single-cell sequencing dataset (GSE132914) using genes listed in Table 1. p-values were analyzed by one-way ANOVA and Tukey’s post hoc test. (B) Formalin-fixed paraffin-embedded sections of the human lung from normal and deceased COVID-19 patients were stained for SFTPC, alone or in combination with nucleocapsid protein and analyzed by confocal immunofluorescence. Representative images are shown. Scale bar = 20 µm. (C) Schematic showing key steps generating an adult stem cell-derived, propagable, lung organoid model, complete with proximal and distal airway components for modeling COVID-19-in-a-dish. See Materials and methods for details regarding culture conditions. (D) A transcriptome-based approach is used for cross-validation of in vitro lung models of SARS-CoV-2 infection (left) versus the human disease, COVID-19 (right), looking for a match in gene expression signatures.
Figure 1—figure supplement 1.
Figure 1—figure supplement 1.. Alveolar type II pneumocyte hyperplasia is a pathognomonic feature of lung injury in COVID-19.
(A) Whisker plots display relative levels of TMPRSS2 expression in various cell types in the normal human lung. The cell types were annotated within a publicly available single-cell sequencing dataset (GSE132914) using genes listed in Table 2. p-values were analyzed by one-way ANOVA and Tukey’s post hoc test. (B) Formalin-fixed paraffin-embedded (FFPE) sections of the human lung from deceased COVID-19 patients were analyzed by H&E staining. Representative fields are shown. Images on the right are magnified areas indicated with boxes on the left. Arrows indicate alveolar type II pneumocyte hyperplasia. (C, D) FFPE sections of the human lung from normal and deceased COVID-19 patients were stained for AT2 and club cell markers and either ACE2 or viral nucleocapsid protein and analyzed by confocal immunofluorescence. Representative images are shown. Scale bar = 50 µm. (E) FFPE sections of the human lung from normal and deceased COVID-19 patients were stained for viral nucleocapsid antibody. Representative images are shown. Arrows indicate infected cells.
Figure 2.
Figure 2.. Adult stem cell-derived lung organoids are propagatable models with both proximal and distal airway components.
(A) Schematic lists the various markers used here for qPCR and immunofluorescence to confirm the presence of all cell types in the 3D lung organoids here and in 2D monolayers later (in Figure 3). (B–H) Bar graphs display the relative abundance of various cell-type markers (normalized to 18S) in adult lung organoids (ALO), compared to the airway ( normal human bronchial epithelial cell [NHBE]) and/or alveolar (AT2) control cells, as appropriate. p-values were analyzed by one-way ANOVA. Error bars denote SEM; n = 3–6 datasets from three independent ALOs and representing early and late passages. See also Figure 2—figure supplement 2 for individual ALOs. (I, J). H&E-stained cell blocks were prepared using HistoGel (I). Slides were stained for the indicated markers and visualized by confocal immunofluorescence microscopy. Representative images are shown in (J). Scale bar = 50 µm. (K) 3D organoids grown in 8-well chamber slides were fixed, immunostained, and visualized by confocal microscopy as in (J). Scale bar = 50 µm. See also Figure 2—figure supplement 2. Top row (ACE2/KRT5-stained organoids) displays the single and merged panels as max projections of z-stacks (top) and a single optical section (bottom) of a selected area. For the remaining rows, the single (red/green) channel images are max projections of z-stacks; however, merged panels are optical sections to visualize the centers of the organoids. All immunofluorescence images showcased in this figure were obtained from ALO lines within passage #3–6. See also Figure 2—figure supplements 3–5 for additional evidence of mixed cellularity of ALO models, their similarity to lung tissue of origin, and stability of cellular composition during early (#1–8) and late (#8–15) passages, as determined by qPCR and flow cytometry.
Figure 2—figure supplement 1.
Figure 2—figure supplement 1.. Lung organoids are reproducibly established from three different donors and propagated in each case over 10 passages.
(A) Schematic displaying the key demographics of the patients who served as donors of the lung tissue as a source of adult stem cells for the generation of organoids. Three organoid lines were generated, ALO1-3. ALO, adult lung organoids. (B–D) Bright-field microscopy of organoids in 3D culture grown in different media/conditions (B), imaged serially over days (C), and at different passages (D). Scale bar = 100 µm. (E) Serial cuts of HistoGel-embedded organoids were analyzed by H&E staining. Scale bar = 50 µm.
Figure 2—figure supplement 2.
Figure 2—figure supplement 2.. Adult stem cell-derived lung organoids are propagatable models with both proximal and distal airway components.
(A) Schematic lists the various markers used here for qPCR and immunofluorescence to confirm the presence of all cell types in the 3D lung organoids here and in 2D monolayers later (in Figure 3). (B–H) Bar graphs display the relative abundance of various cell-type markers (normalized to 18S) in adult lung organoids (ALO), compared to the airway ( normal human bronchial epithelial cell [NHBE]) and/or alveolar (AT2) control cells, as appropriate. p-values were analyzed by one-way ANOVA. Error bars denote SEM; n = 3–6 datasets. (I) 3D organoids grown in 8-well chamber slides were fixed, immunostained, and visualized by confocal microscopy, as in Figure 2K. Scale bar = 50 µm.
Figure 2—figure supplement 3.
Figure 2—figure supplement 3.. Adult stem cell-derived lung organoids (ALO) generally recapitulate cell-type-specific gene expression patterns observed in the adult lung tissue (ALT) from which they originate.
(A, B) Schematics depict the study goal in this figure, that is, analysis of cell-type-specific transcripts in ALO vs. ALT. (C–L) Bar graphs display the relative abundance of various cell-type markers (normalized to 18S) in adult lung organoids from early passage (ALO), compared to the adult lung tissue (ALT) from which they were derived. p-values were analyzed by one-way ANOVA. Error bars denote SEM; n = 3–6 datasets. Statistically significant differences were not noted in any of the transcripts analyzed.
Figure 2—figure supplement 4.
Figure 2—figure supplement 4.. Adult stem cell-derived lung organoids (ALO) generally maintain their cellular composition from early (E) to late (L) passages, as determined by cell-type-specific gene expression by qPCR.
(A, B) Schematics depict the study goal in this figure, that is, analysis of cell-type-specific transcripts in early (E) vs. late (L) passages of ALO1-3 lines. (C–K) Bar graphs display the relative abundance of various cell-type markers (normalized to 18S) in adult lung organoids from either early (E) or late (L) passages of ALO lines 1–3. p-values were analyzed by one-way ANOVA. Error bars denote SEM; n = 3–6 datasets. Statistically significant differences were not noted in any of the transcripts analyzed.
Figure 2—figure supplement 5.
Figure 2—figure supplement 5.. Adult stem cell-derived lung organoids (ALO) comprised both proximal and distal airway epithelial population and generally maintain such diversity from early (E) to late (L) passages, as determined by FACS.
Lung monolayers were dissociated into single cells and analyzed using flow cytometry. Gating strategy depicted in (A), isotype controls in (B) and (C) show various lung cell types. Numbers denote %.Table in (D) lists marker-positive cell fractions in ALO1-3, presented either as averaged over both early and late passages combined (column 2), or separated into early (column 3) or late (column 4) passages. These findings are consistent with others’ findings by multichannel FACS (Bonser et al., 2021) showing that although many of these markers are highly expressed in a certain cell type, they are shared at lower levels among other cell types.
Figure 3.
Figure 3.. Monolayers derived from lung organoids differentiate into proximal and distal airway components.
(A, B) Samples collected at various steps of lung organoid isolation and expansion in culture, and from the two types of monolayers prepared using the lung organoids were analyzed by bulk RNA seq and the datasets were compared for % cellular composition using the deconvolution method, CYBERSORTx. Schematic in (A) shows the workflow steps, and bar plots in (B) show the relative proportion of various lung cell types. (C, D) hiPSC-derived AT2 cells and alveolospheres (C) were plated as monolayers and analyzed by RNA seq. Bar plots in (D) show % cellular composition. (E, F) Submerged adult lung organoids (ALO) monolayers in transwells (E) or monolayers were grown as air-liquid interphase (ALI) models (F) were fixed and stained for the indicated markers and visualized by confocal immunofluorescence microscopy. The representative max projected z-stack images (left) and the corresponding orthogonal images (right) are displayed. Arrows in (E) indicate AT2 cells; arrowheads in (E) indicate club cells; asterisk in (F) indicates bundles of cilia standing perpendicular to the plane of the ALI monolayers; arrowheads in (F) indicate bundles of cilia running parallel to the plane of the ALI monolayers. Scale bar = 20 µm. (G) Monolayers of ALO1-3 were challenged with SARS-CoV-2 for indicated time points prior to fixation and staining for KRT5, SARS-COV2 viral nucleocapsid protein and DAPI and visualized by confocal microscopy. A montage of representative images are shown, displaying reticulovesicular network patterns and various cytopathic effects. Scale bar = 15 µm. (H) Monolayers of ALO, hiPSC-derived AT2 cells, and other alternative models (see Figure 3—figure supplements 1–2) were infected or not with SARS-CoV-2 and analyzed for infectivity by qPCR (targeted amplification of viral envelope, E gene). See also Figure 3—figure supplement 3B, C for comparison of the degree of peak viral amplification across various models. (I) ALO monolayers pretreated for 4 hr with either vehicle (DMSO) control or EIDD-parent (NHC) or its metabolite EIDD-2801/MK-4482 were infected with SARS-CoV-2 and assessed at 48 hpi for infectivity as in (H). Line graphs display the relative expression of E gene. Error bars display SEM. p value **<0.01; ***<0.001.
Figure 3—figure supplement 1.
Figure 3—figure supplement 1.. Monolayers derived from adult lung organoids (ALO) can form an epithelial barrier.
(A–G) Two different types of 2D polarized monolayers are prepared using adult lung organoids. Schematics in (A) and (E) show growth as submerged or air-liquid interphase (ALI) models, respectively. Panel (B) shows bar graphs with transepithelial electrical resistance (TEER) across submerged monolayers grown in transwells. Panel (C) shows bar graphs for relative fluorescence unit (RFU) of the FITC-labeled dextran flux from the apical to basolateral chambers of a submerged monolayer. (D) Brightfield images show representative fields of submerged monolayers grown on transwells. Scale bar = 100 µm. Arrows indicate self-organized vacuolar regions were seen. (F) Bar graphs with TEER across ALO-derived monolayers grown as ALI models. (G) Brightfield images show representative fields of ALI monolayers at two different time points during culture. Scale bar = 100 µm. (H, I) Submerged monolayers of ALO were fixed with methanol (H) or paraformaldehyde (I) prior to co-staining with DAPI (blue; nuclei) and either occludin (green [H] or phalloidin [red; I]). Scale bar = 20 µm. (J) ALO monolayers were grown as ALI models were fixed and co-stained for SFTPC (red), Ac-Tub (green), and DAPI (blue; nuclei) and visualized by confocal immunofluorescence microscopy. Scale bar = 20 µm. (K, L) Schematic in (K) shows the study design for challenging submerged monolayers with 500 ng/ml LPS, followed by TEER measurement. Bar graphs in (L) display the % change in TEER observed with or without LPS treatment normalized to the baseline TEER. p-values were analyzed by one-way ANOVA. Error bars denote SEM; n = 3–6 datasets. **p< 0.01.
Figure 3—figure supplement 2.
Figure 3—figure supplement 2.. Alternative models of lung epithelial cells used in this work for modeling SARS-CoV-2 infection and/or as a control for gene expression studies.
(A–D) Monolayers of primary airway epithelial cells (small airway epi; A B; bronchial epi; C, D) were visualized by bright field microscopy (A, C) or by fixing, staining, and visualizing by confocal microscopy (B, D). Representative images in (B) and (D) are presented as maximum projected z-stacks on the left and as an orthogonal view on the right. (E–G) hiPSC-derived AT2 cells, prepared using the i-HAEpC2 cell kit, were grown in monolayers on transwell inserts to form a polarized. Brightfield images are shown in (F). Monolayers were fixed and stained for several markers and analyzed by confocal microscopy. Representative images are shown in (G). Scale bar = 20 µm.
Figure 3—figure supplement 3.
Figure 3—figure supplement 3.. Proof of SARS-CoV-2 infectivity.
(A) Monolayers of ALO1-3 were challenged with SARS-CoV-2 for indicated time points prior to fixation and staining for KRT5 (red) and viral nucleocapsid protein (green) and DAPI (blue; nuclei) and visualized by confocal microscopy. Representative images are shown, displaying various cytopathic effects. Scale bar = 15 µm. (B) Monolayers of adult lung organoids (ALO) (either transwell submerged models or air-liquid interphase [ALI], left) and monolayers of hiPSC-derived AT2 cells (right) were infected or not with SARS-CoV-2 and analyzed for viral envelope gene (E gene). Bar graphs display the relative expression of E gene in infected ALO monolayers, indicative of viral infection. (C) Line graphs show the change in E gene expression in infected monolayers over 24 hr period (from 48 hpi to 72 hpi) where values at 72 hpi are normalized to that at 48 hpi. Data is presented as SEM of three independent repeats.
Figure 4.
Figure 4.. Gene expression patterns in the lungs of patients with COVID-19 (actual disease) are recapitulated in lung organoid monolayers infected with SARS-CoV-2 (disease model).
(A–C) Publicly available RNA seq datasets (GSE151764) of lung autopsies from patients who were deceased due to COVID-19 or noninfectious causes (healthy normal control) were analyzed for differential expression of genes (B). The differentially expressed genes (DEGs) are displayed as a heatmap labeled with selected genes in (C). See also Figure 4—figure supplement 1 for the same heatmap with all genes labeled. (D) Reactome-pathway analysis shows the major pathways up- or downregulated in the COVID-19-afflicted lungs. See also Figure 4—figure supplement 2 for visualization as hierarchical ReacFoam. (E) Bar plots display the ability of the DEGs in the test cohort (GSE151764) to classify human COVID-19 respiratory samples from four other independent cohorts. (F) Bar plots display the ability of the DEGs in the test cohort (GSE151764) to classify published in vitro models for SARS-CoV-2 infection where RNA seq datasets were either generated in this work or publicly available. (G, H) Bar (top) and violin (bottom) plots compare the relative accuracy of disease modeling in four in vitro models used in the current work, as determined by the induction of COVID-19 lung signatures in each model. (G) Monolayer (left) and air-liquid interphase (ALI) models (right) prepared using adult lung organoids (ALOs). (H) Primary human small airway epithelium (left) and hiPSC-derived AT2 monolayers (right). Table 6 lists details regarding the patient cohorts/tissue or cell types represented in each transcriptomic dataset.
Figure 4—figure supplement 1.
Figure 4—figure supplement 1.. Differential expression analysis of RNA seq datasets from lung autopsies (normal vs. COVID-19).
Publicly available RNA seq datasets (GSE151764) of lung autopsies from patients who were deceased due to COVID-19 or noninfectious causes (normal lung control) were analyzed for differential expression of genes and displayed as a heatmap.
Figure 4—figure supplement 2.
Figure 4—figure supplement 2.. Reactome-pathway analysis of differentially expressed genes in lung autopsies (normal vs. COVID-19).
Reactome-pathway analysis of the differentially expressed genes shows the major pathways upregulated in COVID-19-affected lungs. Top: visualization as flattened (left) and hierarchical (right, insets) reactome. Bottom: visualization of the same data as tables with statistical analysis indicative of the degree of pathway enrichment.
Figure 5.
Figure 5.. Genes and pathways induced in the SARS-CoV-2-infected lung organoid monolayers (disease model) are induced also in the lungs of COVID-19 patients (actual disease).
(A–C) Adult lung organoid monolayers infected or not with SARS-CoV-2 were analyzed by RNA seq and differential expression analysis. Differentially expressed genes (DEGs; B) are displayed as a heatmap in (C). While only selected genes are labeled in panel (C) (which represent overlapping DEGs between our organoid model and publicly available COVID-19 lung dataset, GSE151764), the same heatmap is presented in Figure 5—figure supplement 1 with all genes labeled. (D) Reactome-pathway analysis shows the major pathways upregulated in SARS-CoV-2-infected lung organoid monolayers. See also Figure 5—figure supplement 2 for visualization as hierarchical ReacFoam. (E) A Venn diagram showing overlaps in DEGs between model (current work; B) and disease (COVID-19 lung dataset, GSE151764; Figure 4). (F) Bar plots display the ability of the DEGs in infected lung monolayers to classify human normal vs. COVID-19 respiratory samples from five independent cohorts. (G–I) Bar (top) and violin (bottom) plots compare the accuracy of disease modeling in three publicly available human lung datasets, as determined by the significant induction of the DEGs that were identified in the SARS-CoV-2-challenged monolayers. See also Table 6, which enlists details regarding the patient cohorts/tissue or cell types represented in each transcriptomic dataset.
Figure 5—figure supplement 1.
Figure 5—figure supplement 1.. Differential expression analysis of RNA seq datasets from adult lung organoid monolayers, infected or not, with SARS-CoV-2.
Adult lung organoid (ALO)-derived grown in transwells as submerged monolayers were infected or not with SARS-CoV-2 were analyzed by RNA seq and differential expression analysis. Differentially expressed genes are displayed as a heatmap.
Figure 5—figure supplement 2.
Figure 5—figure supplement 2.. Reactome-pathway analysis of differentially expressed genes in lung organoid monolayers infected with SARS-CoV-2.
Reactome-pathway analysis of the differentially expressed genes shows the major pathways upregulated in SARS-CoV-2-infected lung organoid monolayers. Top: visualization as flattened (left) and hierarchical (right, insets) ReacFoam. Bottom: visualization of the same data as tables with statistical analysis indicative of the degree of pathway enrichment.
Figure 5—figure supplement 3.
Figure 5—figure supplement 3.. Head-to-head comparison of our adult lung organoid (ALO)-derived model of COVID-19 versus another lung organoid model in their ability to recapitulate the differentially expressed genes (DEGs) observed in lung tissues from fatal cases of COVID-19.
(A) Venn diagrams show the number of overlapping and nonoverlapping DEGs (both up- and downregulated genes) between our organoid model and four human COVID-19 patient-derived samples (left). GSE151764 represents postmortem COVID-19 and normal lung tissues; GSE156063 represents upper airway samples from patients with COVID-19; GSE145926 represents sorted epithelial population from bronchoalveolar lavage fluid (BALF) derived from patients with varying severity of COVID-19; GSE157526 represents tracheal-bronchial cells infected with SARS-Cov2. (B) Venn diagrams as in (A), comparing a publicly available SARS-Cov2-infected human lung organoid model (GSE160435) and the same four human COVID-19 respiratory cohorts as in (A). (C) Venn diagrams show the DEGs between our organoid model and the publicly available lung organoid model. The comparison was carried out by calculating the percentage of the common up/down DEGs represented within the total up/down DEG for the two models in each Venn diagram.
Figure 6.
Figure 6.. Both proximal and distal airway components are required to model the overzealous host response in COVID-19.
(A) Schematic summarizing the immune signatures identified based on ACE2-equivalent gene induction observed invariably in any respiratory viral pandemic. The 166-gene ViP signature captures the cytokine storm in COVID-19, whereas the 20-gene subset severe ViP signature is indicative of disease severity/fatality. (B–D) Publicly available RNA seq datasets from commonly used lung models, Vero E6 (B), human bronchial organoids (C), and hPSC-derived AT1/2 cell-predominant lung organoids are classified using the 166-gene ViP signature (top row) and 20-gene severity signature (bottom row). (E–G) RNA seq datasets generated in this work using either human small airway epithelial cells (E), adult lung organoids as submerged or air-liquid interphase (ALI) models (left and right, respectively, in F) and hiPSC-derived AT2 cells (G) were analyzed and visualized as in (B–D). (H) Publicly available RNA seq datasets from fetal lung organoid monolayers (Lamers et al., 2021) infected or not with SARS-CoV-2 were analyzed as in (B–D) for the ability of ViP signatures to classify infected (I) from uninfected (U) samples. Receiver operating characteristics area under the curve (ROC AUC) in all figure panels indicate the performance of a classification model using the ViP signatures. (I) Summary of findings in this work, its relationship to the observed clinical phases in COVID-19, and key aspects of modeling the same. Table 6 lists details regarding the patient cohorts/tissue or cell types represented in each transcriptomic dataset.
Author response image 1.
Author response image 1.. Publicly available RNA seq datasets (GSE153218) from Small Airway Epi (SAEp) monolayers12 infected or not with SARS-CoV-2 were analyzed for the ability of ViP signatures to classify infected (Inf) from uninfected (Uninf) samples.
ROC AUC indicate the performance of a classification model using the ViP signatures. Unlike the brochoalveolar monolayers (see Figure 6H in the revised manuscript) derived from fetal lung organoids in the same work, SAEp monolayers successfully induced the ViP signatures because the signatures were induced in infected monolayers.
Author response image 2.
Author response image 3.
Author response image 4.

Update of

References

    1. Abdelwahab EMM, Rapp J, Feller D, Csongei V, Pal S, Bartis D, Thickett DR, Pongracz JE. WNT signaling regulates trans-differentiation of stem cell like type 2 alveolar epithelial cells to type 1 epithelial cells. Respiratory Research. 2019;20:204. doi: 10.1186/s12931-019-1176-x. - DOI - PMC - PubMed
    1. Andrea Valeria Arrossi AV, Farver C. The pulmonary pathology of covid-19. Cleveland Clinic Journal of Medicine. 2020;478:137–150. doi: 10.3949/ccjm.87a.ccc063. - DOI - PubMed
    1. Barrett T, Suzek TO, Troup DB, Wilhite SE, Ngau WC, Ledoux P, Rudnev D, Lash AE, Fujibuchi W, Edgar R. NCBI GEO: Mining millions of expression profiles--database and tools. Nucleic Acids Research. 2005;33:D562–D566. doi: 10.1093/nar/gki022. - DOI - PMC - PubMed
    1. Barrett T, Wilhite SE, Ledoux P, Evangelista C, Kim IF, Tomashevsky M, Marshall KA, Phillippy KH, Sherman PM, Holko M, Yefanov A, Lee H, Zhang N, Robertson CL, Serova N, Davis S, Soboleva A. NCBI GEO: Archive for functional Genomics data sets--update. Nucleic Acids Research. 2013;41:D991–D995. doi: 10.1093/nar/gks1193. - DOI - PMC - PubMed
    1. Bonser LR, Koh KD, Johansson K, Choksi SP, Cheng D, Liu L, Sun DI, Zlock LT, Eckalbar WL, Finkbeiner WE, Erle DJ. Flow-cytometric analysis and purification of airway epithelial-cell subsets. American Journal of Respiratory Cell and Molecular Biology. 2021;64:308–317. doi: 10.1165/rcmb.2020-0149MA. - DOI - PMC - PubMed

Publication types

Associated data