. 2021 Nov 1;153(11):e202112946.
doi: 10.1085/jgp.202112946. Epub 2021 Aug 31.

Gating pore currents occur in CaV1.1 domain III mutants associated with HypoPP

Affiliations

Gating pore currents occur in CaV1.1 domain III mutants associated with HypoPP

Fenfen Wu et al. J Gen Physiol. .

Abstract

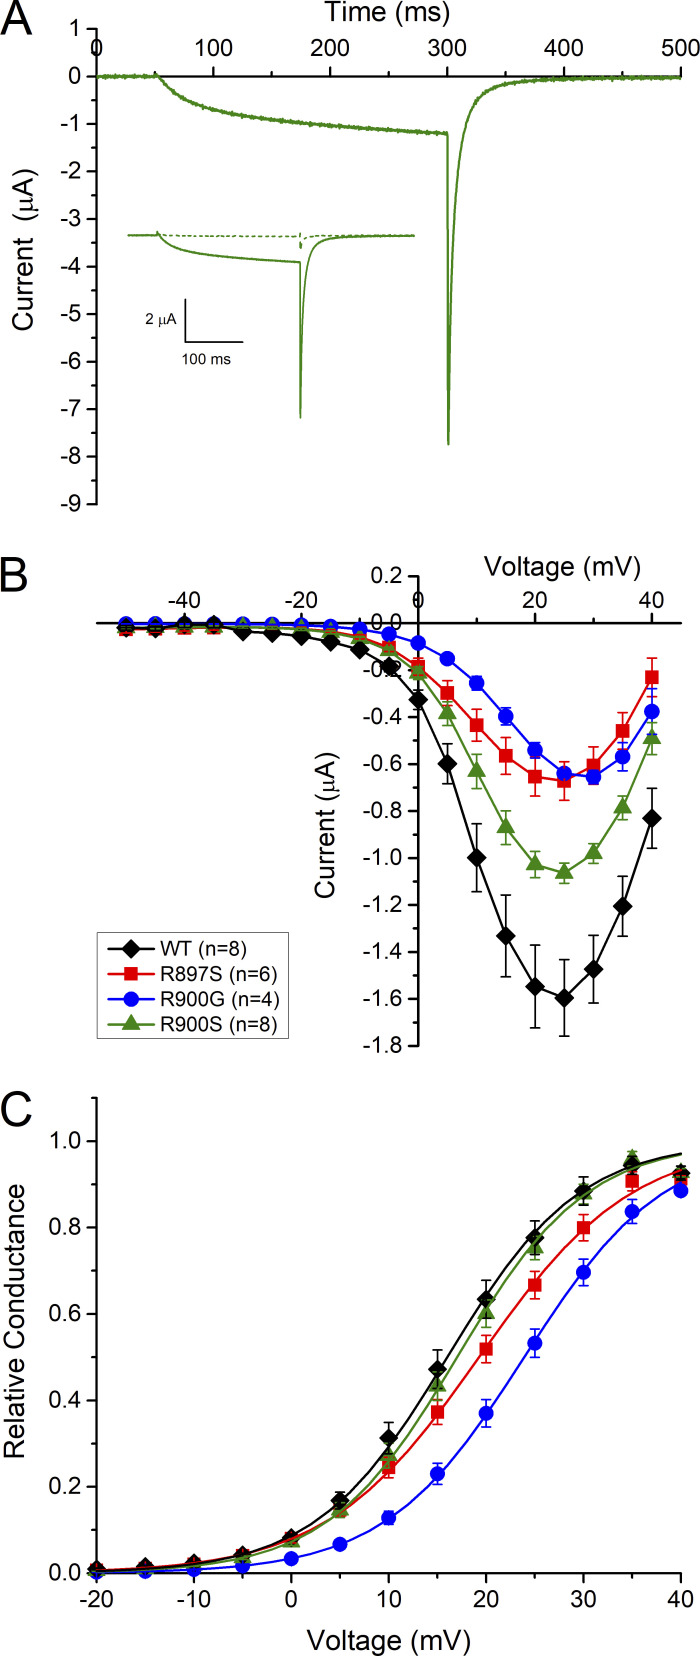
Mutations in the voltage sensor domain (VSD) of CaV1.1, the α1S subunit of the L-type calcium channel in skeletal muscle, are an established cause of hypokalemic periodic paralysis (HypoPP). Of the 10 reported mutations, 9 are missense substitutions of outer arginine residues (R1 or R2) in the S4 transmembrane segments of the homologous domain II, III (DIII), or IV. The prevailing view is that R/X mutations create an anomalous ion conduction pathway in the VSD, and this so-called gating pore current is the basis for paradoxical depolarization of the resting potential and weakness in low potassium for HypoPP fibers. Gating pore currents have been observed for four of the five CaV1.1 HypoPP mutant channels studied to date, the one exception being the charge-conserving R897K in R1 of DIII. We tested whether gating pore currents are detectable for the other three HypoPP CaV1.1 mutations in DIII. For the less conserved R1 mutation, R897S, gating pore currents with exceptionally large amplitude were observed, correlating with the severe clinical phenotype of these patients. At the R2 residue, gating pore currents were detected for R900G but not R900S. These findings show that gating pore currents may occur with missense mutations at R1 or R2 in S4 of DIII and that the magnitude of this anomalous inward current is mutation specific.


Figures

Figure 1.
Figure 1.
Ba2+ currents conducted by WT and mutant hCaV1.1 channels. (A–D) Currents were recorded for step depolarizations from −50 mV to +40 mV in 5-mV increments from a holding potential of −100 mV in oocytes expressing WT (A), R897S (B), R900G (C), or R900S (D) hCaV1.1 subunits. Neither leak nor offset subtraction was performed.
Figure 2.
Figure 2.
Voltage-dependent activation of hCaV1.1 channels. (A) Most of the current recorded in 10 mM Ba2+ was conducted by hCaV1.1 channels, as shown in this example for a voltage step to +25 mV in an oocyte expressing the R900S mutant. Inset shows the current in control (solid line) and then in a blocking solution with 10 µM nifedipine + 2 mM Co2+ (dashed line). The full-size plot shows the blocker-sensitive Ba2+ current. (B) The I-V relationship shows that the Ba2+ currents were of lower amplitude for all mutant channels than for WT. (C) The depolarized shift of activation for R900G mutant channels is shown more clearly in the plot of relative conductance. Symbols in B and C show the mean values (± SEM), and the curves show the Boltzmann fit using the mean values of the parameters. Error bars indicate the SEM.
Figure 3.
Figure 3.
Kinetics of activation for WT and HypoPP hCaV1.1 channels. (A) The time course for Ba2+ current activation is shown by superposition of amplitude-normalized currents elicited by a voltage step to +25 mV. For each response, the zero offset was set to the current value at 5 ms to allow time for relaxation of any residual uncompensated capacitance transient. The maximum current was set to the value at 240 ms after the start of the voltage step. The traces are average values for WT (n = 6), R897S (n = 5), R900G (n = 4), and R900S (n = 4). The SEM at each point in time was on the order of 0.01–0.03, which is barely distinguishable from the line for the mean value and has been omitted for clarity. (B) The time constant from a single exponential fit to the Ba2+ current is shown as a function of voltage step potential. The stars indicate the voltage range over which the mean values for R897S and R900G were larger than for WT (ANOVA; P < 0.01). Error bars indicate the SEM.
Figure 4.
Figure 4.
Detection of charge-displacement currents in the presence of a large-amplitude nonlinear gating pore current for R897S. (A) Currents elicited by depolarizations from −100 mV to +30 mV in 10-mV increments from an oocyte expressing R897S. No offset or leak subtraction has been performed. The capacitance compensation of the amplifier was used to cancel the linear capacitance of the oocyte membrane. (B) Superposition of currents recorded from leak pulses (−100 mV to −80 mV) applied between each of the trials in A. The baseline current (t<0 ms) was approximately −325 nA, as shown in A, and has been digitally subtracted from each trace. (C) Baseline-subtracted currents from A are replotted after linearly scaled subtraction for the “leak” response in B. The scale factor for each trace is ΔV/20 because the “leak” response was measured for a 20-mV depolarization. (D) Secondary offset subtraction of the steady-state current at 5 ms for the currents in A was performed to isolate the current transient that is primarily composed of the gating charge-displacement current (see supplemental text at the end of the PDF). The gating charge was calculated as the integral of the current for t>50 μs, as shown by the vertical line.
Figure 5.
Figure 5.
Gating charge-displacement current was leftward shifted for R897S. (A) Box plot shows the mean values (line), 25–75% interquartile (box), and SD (whiskers) for the maximum charge displacement observed in each oocyte. The Qmax for WT was larger (ANOVA; P < 0.001) than for any HypoPP mutant constructs, which were statistically indistinguishable. (B) The voltage dependence of relative charge displacement showed a leftward shift of 21 mV for R897S compared with WT (ANOVA; P < 0.001).
Figure S1.
Figure S1.
Simulated currents produced by the sum of leak Ileak, gating pore Igp, and charge-displacement components Iq. (A) Series of total currents elicited by step depolarization from a holding potential of −100 mV to a series of test potentials from −100 to +30 mV in 10-mV increments with no leak or offset subtraction. (B) Component currents that contribute to the response at +30 mV. (C) Leak response (black line) for a voltage step from −100 mV to −80 mV and the associated individual components. (D) Current response after standard P/N linear leak subtraction (and offset subtraction of the initial current t<0) for the response to a voltage step V2= +30 mV. (E) Family of currents after secondary offset subtraction of the P/N-subtracted responses, such that the steady-state current = 0 nA. The applied voltage steps were over a range from −100 mV to +30 mV. (F) Details of the current components that contribute to the secondary offset-subtracted response at V2= +30 mV.
Figure S2.
Figure S2.
Simulated Q(V) curves. (A) Family of Q(V) curves when the ratio of τgp/τq was varied, as indicated in the legend. The black squares are for the idealized case with no contribution from Igp or from the inclusion of a small Iq in the leak pulse. The solid lines show fits to a Boltzmann function over the range −90 mV to +30 mV. (B) Amplitude-normalized Q(V)/Qmax responses from A to facilitate a visual comparison of the voltage midpoint for total charge displacement. subtr, subtraction.
Figure 6.
Figure 6.
Gating pore currents were detected for R897S and R900G, but not R900S, mutant channels. (A) Representative traces are shown for currents recorded in response to test potentials of −140 to 20 mV in 10-mV increments from a holding potential of −100 mV. The initial capacitance transient is clipped, and the time-averaged current from 5 to 7.5 ms (boxes) was examined to test for the presence of a gating pore current. No leak subtraction was performed, and no hCaV1.1 channel blockers were present. Notice the larger-amplitude inward holding current at −100 mV for R900G and R897S mutants. (B) The isochronal I-V relationship shows larger inward currents at hyperpolarized test potentials for R900G and R897S, consistent with a gating pore current. Error bars indicate the SEM.
Figure 7.
Figure 7.
Guanidinium is highly permeable for the R897S, but not the R900G, gating pore. (A) Representative current traces were initially recorded in a 110 mM NMDG external solution (left) and recorded again from the same oocyte (right) after exchanging the external solution with a mixture of 60 mM NMDG and 60 mM guanidinium (GD). (B) The I-V relation is compared for a standard 96 mM Na+ external solution and for a solution with a mixture of 60 mM guanidinium and 60 mM NMDG. Symbols show mean ± SEM (n = 3).
Figure 8.
Figure 8.
Permeation properties of gating pore currents. Each cluster of three bars shows the conductances measured in external Na+, NMGD, or a mixture of 60 mM NMDG and 60 mM guanidinium. These conductance values were determined from the slope of the isochronal I-V over the range from −140 mV to −120 mV (e.g., Fig. 6 B for Na+). Membrane conductance in Na+ was higher for R897S and R900G than for WT, consistent with gating pore currents for these two HypoPP mutant channels. The marked decrease in conductance for R897S and R900G in NDMG compared with Na+ shows that the gating pore is more permeable to Na+ than NMDG. The conductance was increased in guanidinium only for R897S. The data for external Na+ (n = 7 WT, 8 R897S, 9 R900G, and 10 R900S) are from a different set of oocytes than the NMDG/guanidinium studies. For the NMDG experiments (n = 5 WT, n = 3 for all mutants), recordings were initially made in 110 mM NMDG, and then the bath was exchanged with 60 mM NMDG plus 60 mM guanidinium, and currents were recorded again. Error bars indicate the SEM.
Figure 9.
Figure 9.
Gating pore currents are partially blocked by Ba2+. Each panel shows the I-V relation, as in Fig. 3 B, recorded from oocytes in control conditions (96 mM Na+, 6 mM Ca2+ external) and then with a 2 mM challenge using either Ba2+ or Co2+. Current amplitude was reduced by Ba2+ but not Co2+. Holding potential −100 mV with no leak subtraction. Symbols show mean ± SEM (n = 4 or 5 R900G; n = 5 or 10 R897S).

References

    1. Cannon, S.C. 2015. Channelopathies of skeletal muscle excitability. Compr. Physiol. 5:761–790. 10.1002/cphy.c140062 - DOI - PMC - PubMed
    1. Cannon, S.C. 2017. Sodium channelopathies of skeletal muscle. Handb. Exp. Pharmacol. 246:309–330. 10.1007/164_2017_52 - DOI - PMC - PubMed
    1. Chabrier, S., Monnier N., and Lunardi J.. 2008. Early onset of hypokalaemic periodic paralysis caused by a novel mutation of the CACNA1S gene. J. Med. Genet. 45:686–688. 10.1136/jmg.2008.059766 - DOI - PubMed
    1. Francis, D.G., Rybalchenko V., Struyk A., and Cannon S.C.. 2011. Leaky sodium channels from voltage sensor mutations in periodic paralysis, but not paramyotonia. Neurology. 76:1635–1641. 10.1212/WNL.0b013e318219fb57 - DOI - PMC - PubMed
    1. Fuster, C., Perrot J., Berthier C., Jacquemond V., and Allard B.. 2017a. Elevated resting H+ current in the R1239H type 1 hypokalaemic periodic paralysis mutated Ca2+ channel. J. Physiol. 595:6417–6428. 10.1113/JP274638 - DOI - PMC - PubMed

Publication types

Substances