. 2021 Oct 8;6(19):e152984.
doi: 10.1172/jci.insight.152984.

Functional roles for PIEZO1 and PIEZO2 in urothelial mechanotransduction and lower urinary tract interoception

Affiliations

Functional roles for PIEZO1 and PIEZO2 in urothelial mechanotransduction and lower urinary tract interoception

Marianela G Dalghi et al. JCI Insight. .

Abstract

The mechanisms that link visceral mechanosensation to the perception of internal organ status (i.e., interoception) remain elusive. In response to bladder filling, the urothelium releases ATP, which is hypothesized to stimulate voiding function by communicating the degree of bladder fullness to subjacent tissues, including afferent nerve fibers. To determine if PIEZO channels function as mechanosensors in these events, we generated conditional urothelial Piezo1-, Piezo2-, and dual Piezo1/2-knockout (KO) mice. While functional PIEZO1 channels were expressed in all urothelial cell layers, Piezo1-KO mice had a limited phenotype. Piezo2 expression was limited to a small subset of superficial umbrella cells, yet male Piezo2-KO mice exhibited incontinence (i.e., leakage) when their voiding behavior was monitored during their active dark phase. Dual Piezo1/2-KO mice had the most affected phenotype, characterized by decreased urothelial responses to mechanical stimulation, diminished ATP release, bladder hypoactivity in anesthetized Piezo1/2-KO females but not males, and urinary incontinence in both male and female Piezo1/2-KO mice during their dark phase but not inactive light one. Our studies reveal that the urothelium functions in a sex- and circadian rhythm-dependent manner to link urothelial PIEZO1/2 channel-driven mechanotransduction to normal voiding function and behavior, and in the absence of these signals, bladder dysfunction ensues.

Keywords: Cell Biology; Epithelial transport of ions and water; Signal transduction; Urology.


Conflict of interest statement

Conflict of interest: The authors have declared that no conflict of interest exists.

Figures

Figure 1
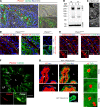
Figure 1. Expression and distribution of Piezo1 and Piezo2 in mouse bladder urothelium.
(A) Distribution of Piezo1 (signal dots in red, surrounded by yellow circles) and uroplakin 3A (Upk3a) (green) assessed using FISH. Urothelial boundary is outlined with white dashed lines (lumen indicated by red arrowheads), scale bars: 50 μm. (B) Western blot analysis of PIEZO1-tdT expression in urothelium (Ut) or detrusor (D) fractions taken from Piezo1+/+ (lanes 1 and 3) or Piezo1tdT/tdT (lanes 2 and 4) mouse bladders. (C) Distribution of PIEZO1-tdT in bladder wall, scale bar: 100 μm. (D and E) Localization of PIEZO1-tdT with respect to the actin cytoskeleton or claudin-8 (CLDN8). Apical surface of umbrella cells are marked with white dashed lines, arrows point to the location of the junctional complex, closed white circles indicate umbrella cell nuclei, and the region of tissue in the yellow dashed box is magnified 2.9-fold (2.9×) in the insets. Scale bars: 20 μm. (F) Piezo2 (red) and Upk3a (green) expression in mouse bladder urothelium defined using FISH. Arrows mark the position of Piezo2-expressing umbrella cells. The boxed region, indicated by a dashed yellow line, is magnified 14-fold (14×) in the insets. The larger panel is a photomerge of 11 images, collected using a wide-field microscope. The area bound by the rectangular box includes a stitching error when the samples were merged. Scale bar: 200 μm. (G) Expression of tdT in Piezo2Cre-IRES-GFP mice mated with Ai9 reporter mice. In the confocal images at the left and at the center, a single tdT-positive umbrella cell is located at the tip of a bladder rugae (also note tdT+ fibroblasts in LP). The region of the yellow dashed line is magnified 2-fold (2×) in the images below. Confocal images to the right show tdT-positive umbrella cells, viewed en face in whole-mounted bladder tissue. Examples of the regional expression of tdT-positive umbrella cells (and the tight junction protein TJP1) from the dome, equator, and neck region of the bladder are shown. All confocal images are 3D reconstructions of 32–48 optical sections. Scale bars: 100 μm. DIC, differential interference contrast; LP, lamina propria; L, lumen; Ut, urothelium.
Figure 2
Figure 2. Evidence of PIEZO channel–dependent mechanotransduction in bladder urothelium.
(AC) Yoda1-stimulated PIEZO1 activation in GCAMP5G-transduced urothelium. (A) Diagram of experimental approach. (B) Example of Yoda1-induced [Ca2+]i increases in Piezo1/2-control or Piezo1/2-KO urothelium. Scale bar: 100 μm. (C) Yoda1-induced changes in [Ca2+]i, normalized to control responses. Data are shown as mean ± SEM (n = 3). Data were analyzed using t tests and significant differences indicated with an asterisk (P ≤ 0.05). (DF) Piezo channel dependence of poking-induced changes in [Ca2+]i. (D) Diagram depicting experimental approach. (E) Example of poking-induced increase in [Ca2+]i in urothelium transduced with adenovirus encoding GCAMP5G. In the 3 images to the right, the indicated cell (yellow arrow) was poked at 10.0 seconds, and the changes in [Ca2+]i were recorded over the next several seconds. Scale bar: 50 μm. (F) Poking-induced [Ca2+]i changes in randomly selected umbrella cells. Data, normalized to matched controls, are shown as mean ± SEM (n = 3 animals for each group; the value of each animal is the average from 11–14 cells). Data were analyzed using t tests and significant differences indicated with an asterisk (P ≤ 0.05). (G and H) Dependence of serosal ATP release on Piezo expression. (G) Schematic of the experimental setup. (H) Upper panels: ATP release from peeled bladders of the indicated strain of mouse. Both males and females were used in this analysis. The peeled bladders were filled after fraction 3. Bottom panels: The total filling-induced ATP release from the serosal surfaces of peeled bladders was calculated. Data are shown as mean ± SEM (Piezo1-control, n = 5; Piezo1-KO, n = 6; Piezo2-control and Piezo2-KO, n = 3; Piezo1/2-control and Piezo1/2-KO, n = 5). Data were analyzed using t tests and significant differences indicated with a double asterisk (P ≤ 0.01).
Figure 3
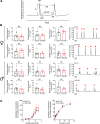
Figure 3. Bladder function in Piezo1-control and Piezo1-KO mice.
(A) Example cystometrogram. A, amplitude (PP-TP); IVI, intervoid interval (time between voiding events); PP, peak pressure (associated with voiding event); RP, resting pressure; TP, threshold pressure; ΔV/ΔP (compliance), change in pressure in response to an incremental change in volume. (B) Comparison of cystometric parameters for male and female, urethane-anesthetized Piezo1-control and Piezo1-KO mice. Voiding events are marked with red arrowheads (line below arrowhead indicates a single voiding event with multiple pressure spikes). Data, analyzed using Mann-Whitney tests, are shown as mean ± SEM (Piezo1-control, males and females, n = 6; Piezo1-KO female, n = 6; Piezo1-KO male, n = 5). (C) Contraction of muscle strips in response to carbachol and electric field stimulation. Data are shown as mean ± SEM (n = 3).
Figure 4
Figure 4. Voiding behavior in freely mobile Piezo1-control and Piezo1-KO mice.
(A) Diagram of void spot chamber. Right panel: Representative video still of a mouse in a void spot chamber, illuminated from below with UV light, and recorded using the top camera. Primary void spots (PVSs) are outlined with dashed yellow lines. A secondary void spot (SVS), on top of a previous PVS, is indicated with a red arrowhead. (B and C) Void spot parameters in female (B) and male (C) mice analyzed over a 6-hour time window during the dark phase or light phase. Data are shown as mean ± SEM (Piezo1-control and Piezo1-KO females, n = 8; Piezo1-control and Piezo1-KO males, n = 6). Data were analyzed using a Mann-Whitney test and significant differences indicated with a single asterisk (P ≤ 0.05).
Figure 5
Figure 5. Voiding behavior in freely mobile Piezo2-control and Piezo2-KO mice.
(A and B) Void spot parameters in female (A) and male (B) mice were analyzed over a 6-hour time window during the dark phase or light phase. Data are shown as mean ± SEM (dark-phase females, Piezo2-control and Piezo2-KO, n = 6; light-phase females, Piezo2-control and Piezo2-KO, n = 9; dark-phase males, Piezo2-control and Piezo2-KO, n = 8; light-phase males, Piezo2-control, n = 6, Piezo2-KO, n = 7). Data were analyzed using a Mann-Whitney test and significant differences indicated with a single asterisk (P ≤ 0.05) or a double asterisk (P ≤ 0.01).
Figure 6
Figure 6. Voiding function of anesthetized Piezo1/2-control and Piezo1/2-KO mice as assessed by cystometry.
(A and B) Urethane-anesthetized female (A) or male (B) mice were subjected to cystometry. Representative cystometrograms are shown to the right of the figure. Data are shown as mean ± SEM (female Piezo1/2-control and Piezo1/2-KO, n = 6; male Piezo1/2-control, n = 5; male Piezo1/2-KO, n = 6). Data were analyzed using Mann-Whitney tests and significant differences indicated with a single asterisk (P ≤ 0.05) or a double one (P ≤ 0.01).
Figure 7
Figure 7. Voiding behavior in freely mobile Piezo1/2-control or Piezo1/2-KO mice.
(A and B) Void spot parameters in female (A) and male (B) mice were analyzed in a 6-hour time window during the dark phase or light phase. Data are shown as mean ± SEM (dark-phase females, Piezo1/2-control and Piezo1/2-KO, n = 7; light-phase females, Piezo1/2-control and Piezo1/2-KO, n = 11; dark-phase males, Piezo1/2-control and Piezo1/2-KO, n = 6; light-phase males, Piezo1/2-control and Piezo1/2-KO, n = 8). Data were analyzed using Mann-Whitney tests and significant differences indicated with a single asterisk (P ≤ 0.05) or with a double asterisk (P ≤ 0.01).

References

    1. Sherrington CS. The Integrative Action of the Nervous System. Yale University Press; 1906.
    1. Ceunen E, et al. On the origin of interoception. Front Psychol. 2016;7:743. - PMC - PubMed
    1. Craig AD. How do you feel? Interoception: the sense of the physiological condition of the body. Nat Rev Neurosci. 2002;3(8):655–666. doi: 10.1038/nrn894. - DOI - PubMed
    1. Chen WG, et al. The Emerging science of interoception: sensing, integrating, interpreting, and regulating signals within the self. Trends Neurosci. 2021;44(1):3–16. doi: 10.1016/j.tins.2020.10.007. - DOI - PMC - PubMed
    1. Craig AD. Interoception: the sense of the physiological condition of the body. Curr Opin Neurobiol. 2003;13(4):500–505. doi: 10.1016/S0959-4388(03)00090-4. - DOI - PubMed

Publication types