Review
. 2021 Nov:243:118530.
doi: 10.1016/j.neuroimage.2021.118530. Epub 2021 Aug 28.

Connectome 2.0: Developing the next-generation ultra-high gradient strength human MRI scanner for bridging studies of the micro-, meso- and macro-connectome

Affiliations
Review

Connectome 2.0: Developing the next-generation ultra-high gradient strength human MRI scanner for bridging studies of the micro-, meso- and macro-connectome

Susie Y Huang et al. Neuroimage. 2021 Nov.

Abstract

The first phase of the Human Connectome Project pioneered advances in MRI technology for mapping the macroscopic structural connections of the living human brain through the engineering of a whole-body human MRI scanner equipped with maximum gradient strength of 300 mT/m, the highest ever achieved for human imaging. While this instrument has made important contributions to the understanding of macroscale connectional topology, it has also demonstrated the potential of dedicated high-gradient performance scanners to provide unparalleled in vivo assessment of neural tissue microstructure. Building on the initial groundwork laid by the original Connectome scanner, we have now embarked on an international, multi-site effort to build the next-generation human 3T Connectome scanner (Connectome 2.0) optimized for the study of neural tissue microstructure and connectional anatomy across multiple length scales. In order to maximize the resolution of this in vivo microscope for studies of the living human brain, we will push the diffusion resolution limit to unprecedented levels by (1) nearly doubling the current maximum gradient strength from 300 mT/m to 500 mT/m and tripling the maximum slew rate from 200 T/m/s to 600 T/m/s through the design of a one-of-a-kind head gradient coil optimized to minimize peripheral nerve stimulation; (2) developing high-sensitivity multi-channel radiofrequency receive coils for in vivo and ex vivo human brain imaging; (3) incorporating dynamic field monitoring to minimize image distortions and artifacts; (4) developing new pulse sequences to integrate the strongest diffusion encoding and highest spatial resolution ever achieved in the living human brain; and (5) calibrating the measurements obtained from this next-generation instrument through systematic validation of diffusion microstructural metrics in high-fidelity phantoms and ex vivo brain tissue at progressively finer scales with accompanying diffusion simulations in histology-based micro-geometries. We envision creating the ultimate diffusion MRI instrument capable of capturing the complex multi-scale organization of the living human brain - from the microscopic scale needed to probe cellular geometry, heterogeneity and plasticity, to the mesoscopic scale for quantifying the distinctions in cortical structure and connectivity that define cyto- and myeloarchitectonic boundaries, to improvements in estimates of macroscopic connectivity.

Keywords: Axon diameter; Connectome; Diffusion MRI; Gray matter; Head gradient; Multi-scale modeling; Peripheral nerve stimulation; Tissue microstructure; Validation.


Figures

Fig. 1.
Fig. 1.
Peripheral nerve stimulation (PNS) characteristics of the Siemens Impulse head gradient obtained in experiments and simulations using realistic body models. Left column: Experimental PNS thresholds (blue) and simulated thresholds (red, for the female and male model and their average) in terms of the smallest stimulating gradient amplitude as a function of trapezoidal rise time for the Siemens Impulse head gradient (Gmax = 200 mT/m, maximum slew rate of 900 T/m/s), the geometry of which is being adopted for the Connectome 2.0 head gradient with modified windings to achieve the target Gmax = 500 mT/m and maximum slew rate of 600 T/m/s. The gray shaded area denotes the accessible performance region determined by Gmax and maximum slew rate. Center column: Sites of perceived sensation reported by the subjects during the stimulation experiments. Right column: Predicted sites of activation in the male body model. The color and size of each sphere correspond to the reciprocal PNS threshold (which we refer to as the PNS oracle). Figure adapted from Davids et al. (2021a).
Fig. 2.
Fig. 2.
64-channel and 72-channel in vivo head array coil configurations (top row) with simulated SNR maps (bottom row). Both head coil designs show similar SNR performance at the center of the phantom. In the periphery of the brain, the 72-channel head coil shows a 13% improvement in the simulated SNR. The latter will be advantageous for studies of cortical microstructure.
Fig. 3.
Fig. 3.
48-channel and 64-channel ex vivo whole brain array coil configurations (top row) with simulated SNR maps (bottom row). The dedicated 64-channel ex vivo brain array enables approximately 17% higher SNR in the corresponding cortical regions of the phantom, while achieving nearly identical SNR in the central region.
Fig. 4.
Fig. 4.
Minimum TE obtained for the pulsed gradient spin echo diffusion sequence as a function of b-value for different maximum gradient strengths.
Fig. 5.
Fig. 5.
In brain white matter of two human subjects, the directionally averaged diffusion signal S¯(b) scales as ~1/b at strong diffusion weighting b. At high b-value, the extra-axonal signal decays exponentially fast, and the “stick”-like intra-axonal signal dominates. The deviation of the signal power-law scaling (solid line), manifested by the negative intercept in b → ∞ limit (dotted line), offers an estimate for the effective axonal radius reff ≈ 3 μm.
Fig. 6.
Fig. 6.
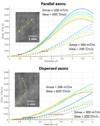
Simulation results showing the resolution limit of PGSE (blue) and OGSE (other colors) for the next-generation ultra-high Gmax/slew rate of 500 mT/m / 600T/m/s (solid lines) versus the current Gmax/slew rate of 300mT/m / 200 T/m/s (dashed lines). Simulation results for (TOP) parallel cylinders and (BOTTOM) dispersed cylinders mimicking axons (inset: OCT images of axons in the human temporal lobe). The shorter effective TE achievable with the next-generation Connectome scanner will enable a nearly 2x increase in SNR, which sets the resolution limit (horizontal bars), resulting in a minimum axonal size of 1.4–1.6 μm vs. 2.5–3 μm (Connectome 2.0 vs 1.0) in the case of parallel axons, and 1.6 μm vs. 3 μm in the case of dispersed axons for relatively low-frequency OGSE. The different OGSE curves (denoted by cyan, green, yellow and orange) correspond to different OGSE frequencies. The dotted lines at the bottom of each figure correspond to a Gmax and slew rate of 80 mT/m and 200 T/m/s, respectively, representing the resolution limit attainable with the latest commercially available clinical gradient systems. Simulations were performed using the Microstructure Imaging Sequence Simulation ToolBox (MISST) (Drobnjak et al., 2010; Drobnjak et al., 2011; Ianus et al., 2013).
Fig. 7.
Fig. 7.
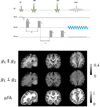
Double diffusion-encoding (DDE) sequence (top) and maps of mean diffusion-weighted imaging volumes using parallel and perpendicular diffusion encoding directions (bottom). The microscopy anisotropy (μFA) maps derived from the difference of the parallel and perpendicular signals is shown on the bottom panel. Figure adapted from Fan et al. (2020b).
Fig. 8.
Fig. 8.
A. The diffusion time (Δ) dependence of MAP-MRI scalar parameters (Avram et al., 2016; Özarslan et al., 2013) in a healthy volunteer (Avram et al., 2021): Propagator Anisotropy (PA); Non-Gaussianity (NG); Return-to-axis probability (RTAP); and Return-to-origin-probability (RTOP). B. The corresponding temporal scaling MRI parameters (Özarslan et al., 2012) by representing brain tissue as fractal-like media: dw – statistical fractal dimension; ds – spectral dimension; df – fractal dimension. Figure adapted from Avram et al. (2021).
Fig. 9.
Fig. 9.
Different microstructural “motifs” derived from the covariance of the subvoxel diffusion tensor distribution (Magdoom et al., 2021). ODF – Orientation distribution function, μODF – micro-ODF. Figure adapted from Magdoom et al. (2021).
Fig. 10.
Fig. 10.
High-quality dMRI reference dataset acquired at 760 μm isotropic resolution with 1260 q-space samplings across 9 two-hour sessions on a single healthy participant. The creation of this benchmark dataset was made possible through the use of the current Connectome scanner, a custom-built 64-channel phased-array head coil, and a recently developed SNR-efficient gSlider acquisition. The color-coded FA maps of the 0.76-mm dataset are presented in three orthogonal views. By using high spatial resolution, improved visualization of detailed structures is provided (top panel), and more sharping-turning fibers such as those connecting cortical regions between adjacent gyri can be observed (red arrows, bottom panel). Figure adapted from Wang et al. (2021).
Fig. 11.
Fig. 11.
Axial post-mortem whole human brain images obtained with multi-shell diffusion MRI at 0.73 mm isotropic resolution using b-values of 4,000 s/mm2 and 10,000 s/mm2. (a) Colorized FA maps obtained from DTI analysis of the b = 4,000 s/mm2 data depict the fine gray-matter bridges spanning the internal capsule. (b) Mean kurtosis maps obtained from diffusion kurtosis analysis of the b-values of 4,000 s/mm2 and 10,000 s/mm2 delineate the external capsule, putamen, and subcortical nuclei with exquisite detail. There is also high mean kurtosis corresponding to the corticospinal tracts coursing through the cerebral peduncles. (c) Mean diffusion-weighted image at b = 10,000 s/mm2 (left) and primary eigenvectors derived from DTI analysis of the b = 4,000 s/mm2 data show primarily radial fibers (orange arrow) in the hand knob of the precentral gyrus (primary motor cortex) and a thin layer of tangential fibers (white arrow) in the postcentral gyrus (primary somatosensory cortex) on the opposite side of the central sulcus. Figure panels (a) and (b) adapted from Scholz et al. (2021).
Fig. 12.
Fig. 12.
Multi-scale taxon phantoms designed for imaging on preclinical and human MRI systems. (a) Micro-phantom manufactured to fit in a 5-mm NMR tube containing fibers of 5 μm and 2 μm inner diameter (ID). (b) Filaments packed into a 1 mm3 cube for fibers of three diameters (5 μm, 2 μm and 0.8 μm). Each filament contains 3476 taxon tubes. (c) 3T phantom with crossing fibers (green areas) and variable packing density cubes of different size (1, 2, 4, and 6 mm on a side) and density (0.125, 0.25, 0.50, and 1.0). The phantom was sized to fit in a standard 20-cm head coil. Figure adapted from Pathak et al. (2020).
Fig. 13.
Fig. 13.
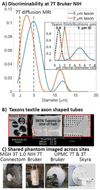
Ground-truth diffusion phantom shared across labs demonstrate discrimination of fibers of 2 and 5 um in diameter. (a) NMR tube phantom containing 2 and 5 μm ID taxons. The 2 and 5 μm peaks are distinguishable based on a DDE acquisition with analysis using the non-parametric multiple correlation functions framework. (b) Scanning electron microscope image of the taxons. (c) Phantom was scanned on: the Connectome scanner at MGH, Bruker 7T at NIH, and Skyra 3T and 7T Bruker systems at UPMC. Figure adapted from Pathak et al. (2020).
Fig. 14.
Fig. 14.
The progression of diffusion simulations in realistic tissue microstructure. Starting from diffusion simulations in 2-dimensional rodent light microscopy (LM) and electron microscopy (EM) data, the advance of microscopy techniques and cell segmentation pipeline have pushed forward the research of diffusion simulations in 3-dimensional tissue micro-geometry, such as sequential slice EM and synchrotron X-ray nano-holotomography (XNH) in primate brain white matter. The figure is adapted from Andersson et al. (2020), Chin et al. (2002), Lee et al. (2020c), Lee et al. (2020e), Nguyen et al. (2018), Palombo et al. (2019) and Xu et al. (2018) with permission from Wiley, Elsevier, and Springer Nature.

References

    1. Abdollahzadeh A, Belevich I, Jokitalo E, Tohka J, Sierra A, 2019. Automated 3D axonal morphometry of white matter. Sci. Rep. 9, 6084. - PMC - PubMed
    1. Ades-Aron B, Veraart J, Kochunov P, McGuire S, Sherman P, Kellner E, Novikov DS, Fieremans E, 2018. Evaluation of the accuracy and precision of the diffusion parameter EStImation with Gibbs and NoisE removal pipeline. Neuroimage 183, 532–543. - PMC - PubMed
    1. Afzali M, Aja-Fernandez S, Jones DK, 2020. Direction-averaged diffusion-weighted MRI signal using different axisymmetric B-tensor encoding schemes. Magn. Reson. Med. 84, 1579–1591. - PMC - PubMed
    1. Alexander DC, 2008. A general framework for experiment design in diffusion MRI and its application in measuring direct tissue-microstructure features. Magn. Reson. Med. 60, 439–448. - PubMed
    1. Alexander DC, Dyrby TB, Nilsson M, Zhang H, 2017. Imaging brain microstructure with diffusion MRI: practicality and applications. NMR Biomed.. - PubMed

Publication types