. 2021 Sep 8;288(1958):20211394.
doi: 10.1098/rspb.2021.1394. Epub 2021 Sep 1.

Spatial ecology of conflicts: unravelling patterns of wildlife damage at multiple scales

Affiliations

Spatial ecology of conflicts: unravelling patterns of wildlife damage at multiple scales

Carlos Bautista et al. Proc Biol Sci. .

Abstract

Human encroachment into natural habitats is typically followed by conflicts derived from wildlife damage to agriculture and livestock. Spatial risk modelling is a useful tool to gain the understanding of wildlife damage and mitigate conflicts. Although resource selection is a hierarchical process operating at multiple scales, risk models usually fail to address more than one scale, which can result in the misidentification of the underlying processes. Here, we addressed the multi-scale nature of wildlife damage occurrence by considering ecological and management correlates interacting from household to landscape scales. We studied brown bear (Ursus arctos) damage to apiaries in the North-eastern Carpathians as our model system. Using generalized additive models, we found that brown bear tendency to avoid humans and the habitat preferences of bears and beekeepers determine the risk of bear damage at multiple scales. Damage risk at fine scales increased when the broad landscape context also favoured damage. Furthermore, integrated-scale risk maps resulted in more accurate predictions than single-scale models. Our results suggest that principles of resource selection by animals can be used to understand the occurrence of damage and help mitigate conflicts in a proactive and preventive manner.

Keywords: Ursus arctos; beehives; human–wildlife coexistence; multi-scale analysis; spatial risk modelling; wildlife damage.


Conflict of interest statement

We have no competing interests.

Figures

Figure 1.
Figure 1.
Conceptual diagram showing a multi-scale approach to model the risk of wildlife damage. The risk of damage is modelled at multiple scales independently based on a priori specified scale-dependent predictions that test one or more general hypotheses. At each scale, the risk of damage can be extrapolated to a larger spatial extension to inform about potential conflict zones in the case of dispersing individual and/or future population increases (A). The resulting predicted probabilities of damage are multiplied at the smallest scale to produce a scale-integrated risk map (B). Finally, it is assessed if the damage risk at fine scale depends on whether the context at larger scales favours damage or not (C). (Online version in colour.)
Figure 2.
Figure 2.
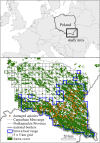
Location of the study area showing the apiaries damaged by the brown bear (Ursus arctos) in the Northern Carpathian Mountains (SE Poland, Podkarpackie Province) in the period of 2010–2017. (Online version in colour.)
Figure 3.
Figure 3.
Risk maps showing the relative probabilities of brown bear damage to apiaries in the Northern Carpathians (SE Poland) at three scales: 5 × 5 km (a), 1 × 1 km (b) and 0.25 × 0.25 km (c). The relative probability of damage was predicted at each scale based on the coefficients of GAMs run within the bear distribution range (cells delimited by the blue line). That probability was then extrapolated to the potential bear habitat within the Podkarpackie Province to inform about potential conflict zones in the case of future population increases. The relative probabilities of bear damage were multiplied at the smallest scale to produce a scale-integrated risk map (d). Predicted risk of damage for all maps was classified using the maximized sum of sensitivity–specificity. The values below the threshold are considered as predicted absence of damage (grey colour). The values above the thresholds were divided into four equal-interval classes of damage risk (the darker the orange colour, the higher the risk). The bar plots at the bottom-left of each panel show the relative frequency of the different risk classes in the map (left bars represent predicted absences and right ones the classes of damage risk). (Online version in colour.)
Figure 4.
Figure 4.
Predicted probability of brown bear damage to apiaries as a response to the number of buildings in a 200 m radius around the apiary in the Northern Carpathians (SE Poland). Responses are conditioned to whether the landscape characteristics at large scales favour damage or not. Orange and green lines show the probability of damage in apiaries located in landscapes that favoured (orange cells) and did not favour damage (grey cells), respectively. Solid lines indicate landscape classification (favouring damage or not) at the landscape scale (5 × 5 km), and dashed lines at the local scale (1 × 1 km). Red and yellow dots represent damaged and undamaged apiaries, respectively. The damage probabilities were predicted with average values of the distance to the nearest forest patch, forest cover around the apiary (in a 200 m radius), longitude and latitude. An apiary located in a landscape that favours damage (a) can be up to three times more at risk of being damaged than an apiary located in a safe landscape (b). (Online version in colour.)

References

    1. Frank B, Glikman JA, Marchini S. 2019. Human–wildlife interactions: turning conflict into coexistence. Cambridge, UK: Cambridge University Press.
    1. Redpath SM, Gutiérrez RJ, Wood KA, Young JC. 2015. Conflicts in conservation: navigating towards solutions. Cambridge, UK: Cambirdge University Press.
    1. Ravenelle J, Nyhus PJ. 2017. Global patterns and trends in human–wildlife conflict compensation. Conserv. Biol. 31, 1247-1256. (10.1111/cobi.12948) - DOI - PubMed
    1. Bautista C, et al. 2019. Large carnivore damage in Europe: analysis of compensation and prevention programs. Biol. Conserv. 235, 308-316. (10.1016/j.biocon.2019.04.019) - DOI
    1. Miller JRB. 2015. Mapping attack hotspots to mitigate human–carnivore conflict: approaches and applications of spatial predation risk modeling. Biodivers. Conserv. 24, 2887-2911. (10.1007/s10531-015-0993-6) - DOI

Publication types

LinkOut - more resources