. 2021 Aug 31;22(1):635.
doi: 10.1186/s12864-021-07937-z.

The genome of the extremophile Artemia provides insight into strategies to cope with extreme environments

Affiliations

The genome of the extremophile Artemia provides insight into strategies to cope with extreme environments

Stephanie De Vos et al. BMC Genomics. .

Abstract

Background: Brine shrimp Artemia have an unequalled ability to endure extreme salinity and complete anoxia. This study aims to elucidate its strategies to cope with these stressors.

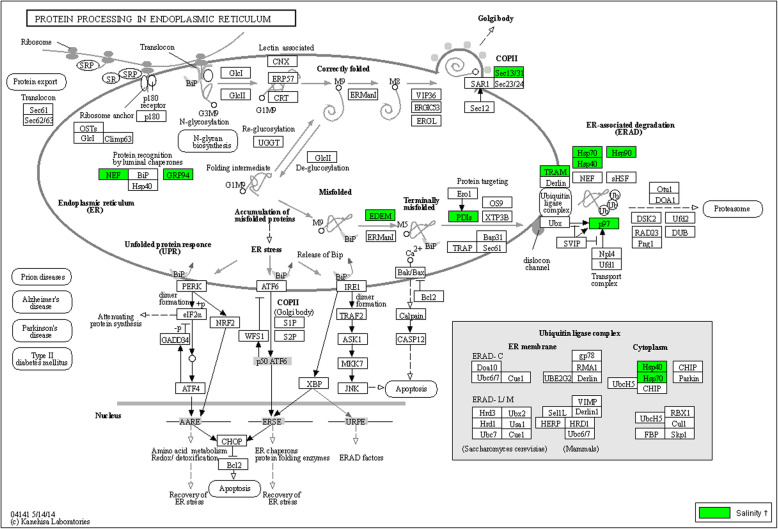
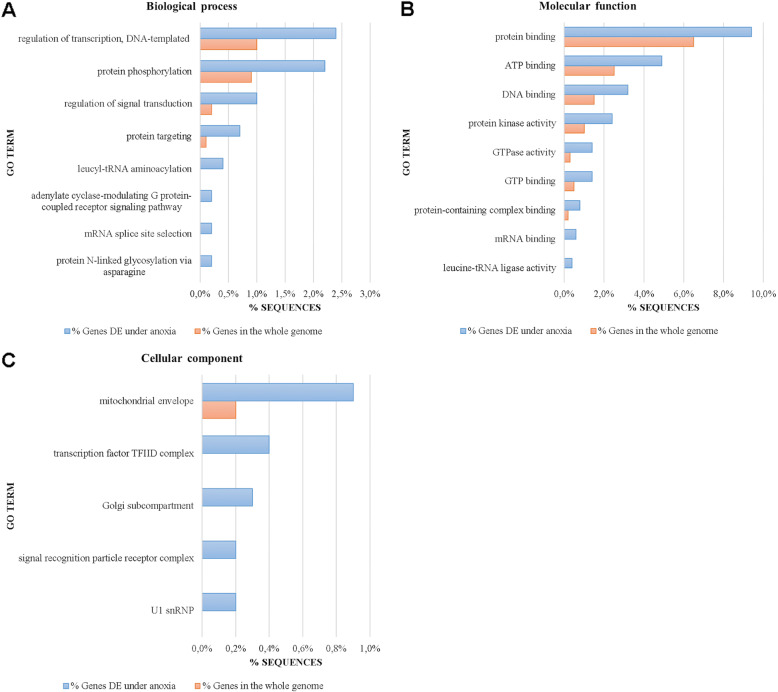
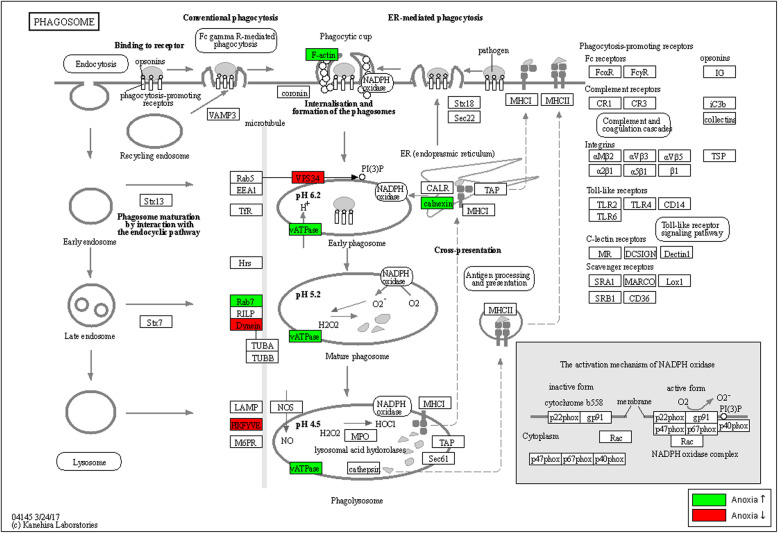
Results and discussion: Here, we present the genome of an inbred A. franciscana Kellogg, 1906. We identified 21,828 genes of which, under high salinity, 674 genes and under anoxia, 900 genes were differentially expressed (42%, respectively 30% were annotated). Under high salinity, relevant stress genes and pathways included several Heat Shock Protein and Leaf Embryogenesis Abundant genes, as well as the trehalose metabolism. In addition, based on differential gene expression analysis, it can be hypothesized that a high oxidative stress response and endocytosis/exocytosis are potential salt management strategies, in addition to the expression of major facilitator superfamily genes responsible for transmembrane ion transport. Under anoxia, genes involved in mitochondrial function, mTOR signalling and autophagy were differentially expressed. Both high salt and anoxia enhanced degradation of erroneous proteins and protein chaperoning. Compared with other branchiopod genomes, Artemia had 0.03% contracted and 6% expanded orthogroups, in which 14% of the genes were differentially expressed under high salinity or anoxia. One phospholipase D gene family, shown to be important in plant stress response, was uniquely present in both extremophiles Artemia and the tardigrade Hypsibius dujardini, yet not differentially expressed under the described experimental conditions.

Conclusions: A relatively complete genome of Artemia was assembled, annotated and analysed, facilitating research on its extremophile features, and providing a reference sequence for crustacean research.

Keywords: Annotation; Anoxia; Artemia; Arthropod; Assembly; Brine shrimp; Extremophile; Genome; Salinity; Transcriptome.


Conflict of interest statement

The authors declare that they have no competing interests.

Figures

Fig. 1
Fig. 1
Exonic, intronic, intergenic and repeat content in crustacean genomes. Crustaceans shown: A. franciscana, Litopenaeus vannamei, Eulimnadia texana, Hyalella azteca, Tigriopus kinsejongensis, Daphnia pulex and Lepidurus arcticus. A Exonic, intronic and intergenic content. Relative coding and non-coding components of the whole Artemia genome and other arthropod genomes, based on component length (bp) compared to the total genome length (bp). B Repeat content in crustacean genomes. Relative repeat and non-repeat components of the whole Artemia genome and other crustacean genomes based on component length (bp) compared to the total genome length (bp)
Fig. 2
Fig. 2
Comparative genomics between Artemia and other branchiopods. Venn diagram showing the number of orthogroups for each of the branchiopods A. franciscana, Daphnia pulex, Lepidurus arcticus and Eulimnadia texana
Fig. 3
Fig. 3
Significantly enriched gene ontology classes (GOs; Fisher’s exact test FDR ≤ 0.05) in Artemia compared to other branchiopods. The 30 most enriched GOs (biological process) in gene families expanded or contracted in Artemia (compared to other Branchiopoda), compared with GOs in the whole Artemia genome. Sorted from largest enrichment (top) to smallest enrichment (bottom). Enrichment was done by removing sequences present in both test set and reference set from the reference, but not from the test set, which makes the test more sensitive towards the test set, but can lead to zero values in the reference set
Fig. 4
Fig. 4
Significantly enriched gene ontologies (Fisher’s exact test, FDR ≤ 0.05) in the differentially expressed gene list under high salinity in Artemia. Biological processes (A), molecular functions (B) and cellular components (C) for genes differentially expressed under high salinity are shown. GO terms are sorted from the largest (top of the graph) to the smallest difference (bottom of the graph) between % sequences in the whole genome and in DE genes. Enrichment was done by removing sequences present in both test set and reference set from the reference only, but not from the test set, which makes the test more sensitive towards the test set, but can lead to zero values in the reference set. D Binocular image of an adult female A. franciscana
Fig. 5
Fig. 5
The pathway “protein processing in the endoplasmic reticulum”. This pathway is significantly enriched (Fisher’s exact test corrected for multiple testing, FDR ≤ 0.05) in the differentially expressed gene list in Artemia under high salinity. Significantly upregulated genes (p < 0.05) in Artemia are indicated on the Daphnia pulex pathway map dpx04141 from the KEGG database. No genes of this pathway were significantly downregulated in Artemia. Gene names and Artemia gene IDs are linked in Additional file 14 (tab sheets 1 and 2)
Fig. 6
Fig. 6
Significantly enriched gene ontologies (Fisher’s exact test, FDR ≤ 0.05) in the differentially expressed gene list under anoxia in Artemia. Biological processes (A), molecular functions (B) and cellular components (C) for genes differentially expressed under anoxia are shown. GO terms are sorted from the largest (top of the graph) to the smallest difference (bottom of the graph) between % sequences in the whole genome and in DE genes. Enrichment was done by removing sequences present in both test set and reference set from the reference, but not from the test set, which makes the test more sensitive towards the test set, but can lead to zero values in the reference set
Fig. 7
Fig. 7
The pathway “Phagosome”. This pathway is significantly enriched (Fisher’s exact test corrected for multiple testing, FDR ≤ 0.05) in the differentially expressed gene list in Artemia under anoxia. Significantly up- and downregulated genes (p < 0.05) in Artemia are indicated on the Daphnia pulex pathway map dpx04145 from the KEGG database. Gene names and Artemia gene IDs are linked in Additional file 18 (tab sheets 1 and 2)

References

    1. Lavens P, Sorgeloos P. Manual on the production and use of live food for aquaculture. In: FAO, editor. FAO Fisheries Technical Paper 361. Rome: FAO; 1996. p. 295.
    1. Kayim M, Ates M, Elekon HA. The effects of different feeds under the same salinity conditions on the growth and survival rate of Artemia. J Anim Vet Adv. 2010;9(8):1223–1226.
    1. Leger P, Bengtson DA, Simpson KL, Sorgeloos P. The use and nutritional value of Artemia as a food source. Oceanogr Mar Biol. 1986;24:521–623.
    1. Asem A, Rastegar-Pouyani N, De Los Ríos-Escalante P. The genus Artemia leach, 1819 (Crustacea: Branchiopoda). I. True and false taxonomical descriptions. Lat Am J Aquat Res. 2010;38(3):501–506.
    1. Maniatsi S, Baxevanis AD, Kappas I, Deligiannidis P, Triantafyllidis A, Papakostas S, Bougiouklis D, Abatzopoulos TJ. Is polyploidy a persevering accident or an adaptive evolutionary pattern? The case of the brine shrimp Artemia. Mol Phylogenet Evol. 2011;58(2):353–364. - PubMed

Substances