Observational Study
. 2021 Aug 31;13(1):146.
doi: 10.1186/s13195-021-00888-3.

Detection of dementia on voice recordings using deep learning: a Framingham Heart Study

Affiliations
Observational Study

Detection of dementia on voice recordings using deep learning: a Framingham Heart Study

Chonghua Xue et al. Alzheimers Res Ther. .

Abstract

Background: Identification of reliable, affordable, and easy-to-use strategies for detection of dementia is sorely needed. Digital technologies, such as individual voice recordings, offer an attractive modality to assess cognition but methods that could automatically analyze such data are not readily available.

Methods and findings: We used 1264 voice recordings of neuropsychological examinations administered to participants from the Framingham Heart Study (FHS), a community-based longitudinal observational study. The recordings were 73 min in duration, on average, and contained at least two speakers (participant and examiner). Of the total voice recordings, 483 were of participants with normal cognition (NC), 451 recordings were of participants with mild cognitive impairment (MCI), and 330 were of participants with dementia (DE). We developed two deep learning models (a two-level long short-term memory (LSTM) network and a convolutional neural network (CNN)), which used the audio recordings to classify if the recording included a participant with only NC or only DE and to differentiate between recordings corresponding to those that had DE from those who did not have DE (i.e., NDE (NC+MCI)). Based on 5-fold cross-validation, the LSTM model achieved a mean (±std) area under the receiver operating characteristic curve (AUC) of 0.740 ± 0.017, mean balanced accuracy of 0.647 ± 0.027, and mean weighted F1 score of 0.596 ± 0.047 in classifying cases with DE from those with NC. The CNN model achieved a mean AUC of 0.805 ± 0.027, mean balanced accuracy of 0.743 ± 0.015, and mean weighted F1 score of 0.742 ± 0.033 in classifying cases with DE from those with NC. For the task related to the classification of participants with DE from NDE, the LSTM model achieved a mean AUC of 0.734 ± 0.014, mean balanced accuracy of 0.675 ± 0.013, and mean weighted F1 score of 0.671 ± 0.015. The CNN model achieved a mean AUC of 0.746 ± 0.021, mean balanced accuracy of 0.652 ± 0.020, and mean weighted F1 score of 0.635 ± 0.031 in classifying cases with DE from those who were NDE.

Conclusion: This proof-of-concept study demonstrates that automated deep learning-driven processing of audio recordings of neuropsychological testing performed on individuals recruited within a community cohort setting can facilitate dementia screening.

Keywords: Dementia; Digital health; Machine learning; Neuropsychological testing; Voice recording.


Conflict of interest statement

The authors declare that they have no competing interests.

Figures

Fig. 1
Fig. 1
Time spent on the neuropsychological tests. Boxplots showing the time spent by the FHS participants on each neuropsychological test. For each test, the boxplots were generated on participants with normal cognition (NC), those with mild cognitive impairment (MCI), and those who had dementia (DE); those who were non-demented (NDE) combined the NC and MCI individuals. We also indicated the number of recordings that were processed to generate each boxplot. We also computed pairwise statistical significance between two groups (NC vs. MCI, MCI vs. DE, NC vs. DE, and DE vs. NDE). We evaluated the differences in means of the durations of all three cognitive statuses using a pairwise t-test. The symbol “*” indicates statistical significance at p < 0.05, the symbol “**” indicates statistical significance at p < 0.01, the symbol “***” indicates statistical significance at p < 0.001, and “n.s.” indicates p > 0.05. Logical Memory (LM) tests with a (†) symbol denote that an alternative story prompt was administered for the test. It is possible that one participant may receive a prompt under each of the LM recall conditions (one recording). Because many neuropsychological tests were administered on the participants, we chose a representation scheme that combined colors and hatches. The colored hatches were used to represent each individual neuropsychological test and this information was used to aid visualization in subsequent figures
Fig. 2
Fig. 2
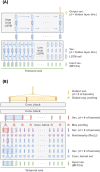
Schematics of the deep learning frameworks. A The hierarchical long short-term memory (LSTM) network model that encodes an entire audio file into a single vector to predict dementia status on the individuals. All LSTM cells within the same row share the parameters. Note that the hidden layer dimension is user-defined (e.g., 64 in our approach). B Convolutional neural network that uses the entire audio file as the input to predict the dementia status of the individual. Each convolutional block reduces the input length by a common factor (e.g., 2) while the very top layer aggregates all remaining vectors into one by averaging them
Fig. 3
Fig. 3
Receiver operating characteristic (ROC) and precision-recall (PR) curves of the deep learning models. The long short-term memory (LSTM) network and the convolutional neural network (CNN) models were constructed to classify participants with normal cognition and dementia as well as participants who are non-demented and the ones with dementia, respectively. On each model, a 5-fold cross-validation was performed and the model predictions (mean ± standard deviation) were generated on the test data (see Figure S1), followed by the creation of the ROC and PR curves. Plots A and B denote the ROC and PR curves for the LSTM and the CNN models for the classification of normal versus demented cases. Plots C and D denote the ROC and PR curves for the LSTM and CNN models for the classification of non-demented versus demented cases
Fig. 4
Fig. 4
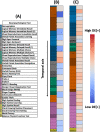
Saliency maps highlighted by the CNN model. A This key is a representation that maps the colored hatches to the neuropsychological tests. B Saliency map representing a recording (62 min in duration) of a participant with normal cognition (NC) that was classified as NC by the convolutional neural network (CNN) model. C Saliency map representing a recording (94 min in duration) of a participant with dementia (DE) who was classified with dementia by the CNN model. For both B and C, the colormap on the left half corresponds to a neuropsychological test. The color on the right half represents the DE[+] value, ranging from dark blue (low DE[+]) to dark red (high DE[+]). Each DE[+] rectangle represents roughly 2 min and 30 s

References

    1. Libon DJ, Swenson R, Ashendorf L, Bauer RM, Bowers D. Edith Kaplan and the Boston process approach. Clin Neuropsychol. 2013;27(8):1223–1233. doi: 10.1080/13854046.2013.833295. - DOI - PubMed
    1. Hinton G. Deep learning-a technology with the potential to transform health care. JAMA. 2018;320(11):1101–1102. doi: 10.1001/jama.2018.11100. - DOI - PubMed
    1. Tsao CW, Vasan RS. Cohort profile: the Framingham Heart Study (FHS): overview of milestones in cardiovascular epidemiology. Int J Epidemiol. 2015;44(6):1800–1813. doi: 10.1093/ije/dyv337. - DOI - PMC - PubMed
    1. Au R, Piers RJ, Devine S. How technology is reshaping cognitive assessment: lessons from the Framingham Heart Study. Neuropsychology. 2017;31(8):846–861. doi: 10.1037/neu0000411. - DOI - PMC - PubMed
    1. Jak AJ, Preis SR, Beiser AS, Seshadri S, Wolf PA, Bondi MW, Au R. Neuropsychological criteria for mild cognitive impairment and dementia risk in the Framingham Heart Study. J Int Neuropsychol Soc. 2016;22(9):937–943. doi: 10.1017/S1355617716000199. - DOI - PMC - PubMed

Publication types