

Short-range exposure to airborne virus transmission and current guidelines
- PMID: 34465564
- PMCID: PMC8449319
- DOI: 10.1073/pnas.2105279118
Short-range exposure to airborne virus transmission and current guidelines
Abstract
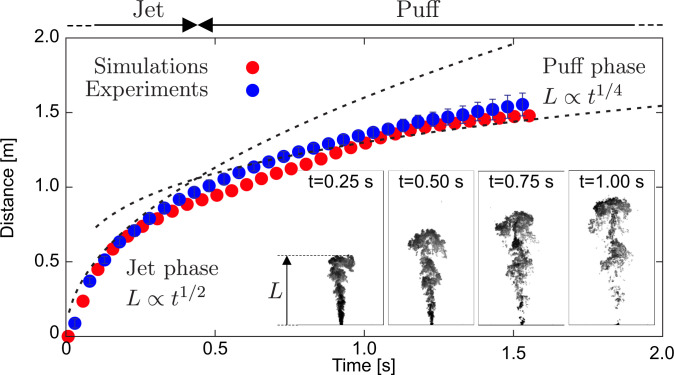
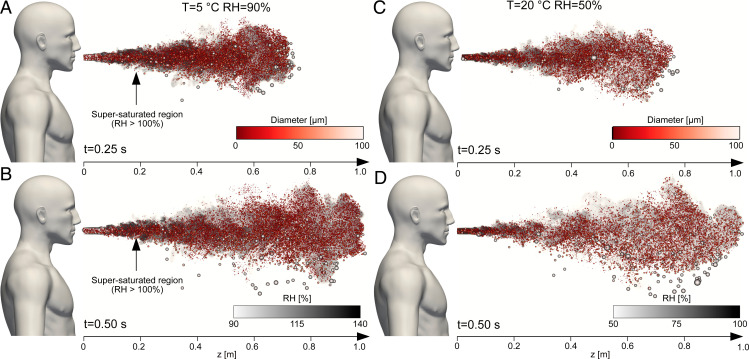
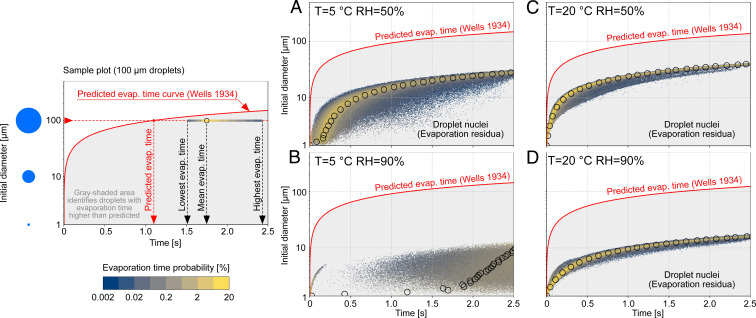
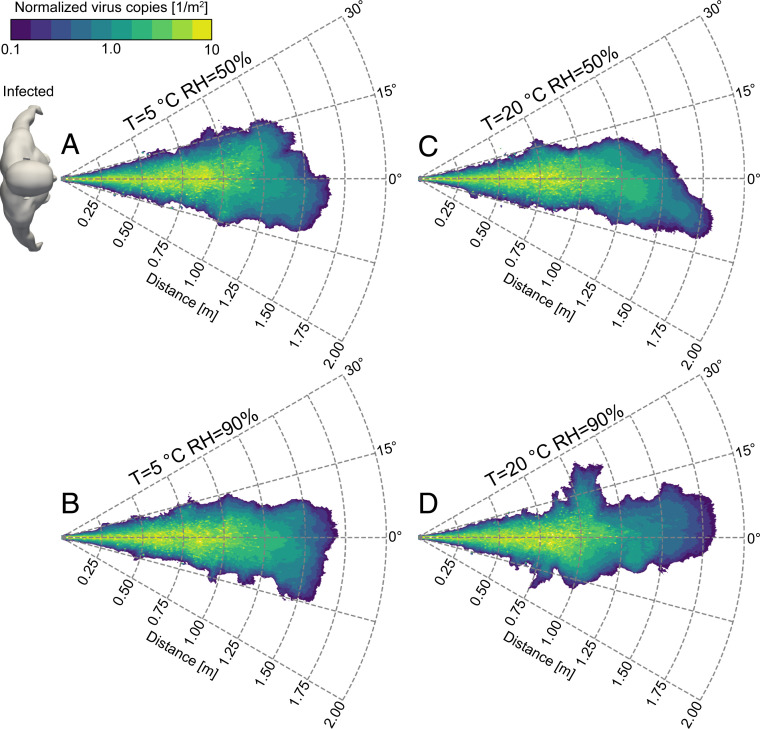
After the Spanish flu pandemic, it was apparent that airborne transmission was crucial to spreading virus contagion, and research responded by producing several fundamental works like the experiments of Duguid [J. P. Duguid, J. Hyg. 44, 6 (1946)] and the model of Wells [W. F. Wells, Am. J. Hyg. 20, 611-618 (1934)]. These seminal works have been pillars of past and current guidelines published by health organizations. However, in about one century, understanding of turbulent aerosol transport by jets and plumes has enormously progressed, and it is now time to use this body of developed knowledge. In this work, we use detailed experiments and accurate computationally intensive numerical simulations of droplet-laden turbulent puffs emitted during sneezes in a wide range of environmental conditions. We consider the same emission-number of drops, drop size distribution, and initial velocity-and we change environmental parameters such as temperature and humidity, and we observe strong variation in droplets' evaporation or condensation in accordance with their local temperature and humidity microenvironment. We assume that 3% of the initial droplet volume is made of nonvolatile matter. Our systematic analysis confirms that droplets' lifetime is always about one order of magnitude larger compared to previous predictions, in some cases up to 200 times. Finally, we have been able to produce original virus exposure maps, which can be a useful instrument for health scientists and practitioners to calibrate new guidelines to prevent short-range airborne disease transmission.
Keywords: COVID-19; SARS-CoV-2; airborne; infectious disease; public health.
Conflict of interest statement
The authors declare no competing interest.
Figures
Similar articles
-
Peering inside a cough or sneeze to explain enhanced airborne transmission under dry weather.Sci Rep. 2021 May 10;11(1):9826. doi: 10.1038/s41598-021-89078-7. Sci Rep. 2021. PMID: 33972590 Free PMC article.
-
Quantitative Microbial Risk Assessment for Airborne Transmission of SARS-CoV-2 via Breathing, Speaking, Singing, Coughing, and Sneezing.Environ Health Perspect. 2021 Apr;129(4):47002. doi: 10.1289/EHP7886. Epub 2021 Apr 1. Environ Health Perspect. 2021. PMID: 33793301 Free PMC article.
-
Effect of indoor temperature on the velocity fields and airborne transmission of sneeze droplets: An experimental study and transient CFD modeling.Sci Total Environ. 2023 Feb 1;858(Pt 2):159444. doi: 10.1016/j.scitotenv.2022.159444. Epub 2022 Oct 15. Sci Total Environ. 2023. PMID: 36252673 Free PMC article.
-
Airborne transmission of SARS-CoV-2 is the dominant route of transmission: droplets and aerosols.Infez Med. 2021 Mar 1;29(1):10-19. Infez Med. 2021. PMID: 33664169 Review.
-
Review of indoor aerosol generation, transport, and control in the context of COVID-19.Int Forum Allergy Rhinol. 2020 Oct;10(10):1173-1179. doi: 10.1002/alr.22661. Epub 2020 Jul 24. Int Forum Allergy Rhinol. 2020. PMID: 32652898 Free PMC article. Review.
Cited by
-
3D modelling and simulation of the dispersion of droplets and drops carrying the SARS-CoV-2 virus in a railway transport coach.Sci Rep. 2022 Mar 7;12(1):4025. doi: 10.1038/s41598-022-08067-6. Sci Rep. 2022. PMID: 35256741 Free PMC article.
-
Spread of infectious agents through the air in complex spaces.Interface Focus. 2022 Feb 11;12(2):20210080. doi: 10.1098/rsfs.2021.0080. eCollection 2022 Apr 6. Interface Focus. 2022. PMID: 35261735 Free PMC article.
-
Dispersion of free-falling saliva droplets by two-dimensional vortical flows.Theor Comput Fluid Dyn. 2022;36(6):993-1011. doi: 10.1007/s00162-022-00633-y. Epub 2022 Nov 5. Theor Comput Fluid Dyn. 2022. PMID: 36373071 Free PMC article.
-
Interrogating the lack of diversity of thought in the pandemic response that led to mistakes - holistic evidence-based approach to deal with future pandemics.Front Public Health. 2023 Dec 21;11:1310210. doi: 10.3389/fpubh.2023.1310210. eCollection 2023. Front Public Health. 2023. PMID: 38192553 Free PMC article.
-
Pathways to community transmission of COVID-19 due to rapid evaporation of respiratory virulets.J Colloid Interface Sci. 2022 Aug;619:229-245. doi: 10.1016/j.jcis.2022.03.098. Epub 2022 Mar 28. J Colloid Interface Sci. 2022. PMID: 35397458 Free PMC article.
References
-
- Lewis D., COVID-19 rarely spreads through surfaces. So why are we still deep cleaning? Nature 590, 26–28 (2021). - PubMed
-
- World Health Organization , Infection Prevention and Control of Epidemic- and Pandemic-Prone Acute Respiratory Infections in Health Care (World Health Organization, 2014). - PubMed
-
- Chartier Y., Pessoa-Silva C., Natural Ventilation for Infection Control in Health-Care Settings (World Health Organization, 2009). - PubMed
-
- Wilson N., Corbett S., Tovey E., Airborne transmission of covid-19. BMJ 370, m3206 (2020). - PubMed
Publication types
MeSH terms
Substances
LinkOut - more resources
Full Text Sources
Medical
Miscellaneous
