Respiratory Mechanics in a Cohort of Critically Ill Subjects With COVID-19 Infection
- PMID: 34465572
- PMCID: PMC8576110
- DOI: 10.4187/respcare.09064
Respiratory Mechanics in a Cohort of Critically Ill Subjects With COVID-19 Infection
Abstract
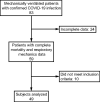
Background: Patients with coronavirus disease 2019 (COVID-19) often develop acute hypoxemic respiratory failure and receive invasive mechanical ventilation. Much remains unknown about their respiratory mechanics, including the trajectories of pulmonary compliance and [Formula: see text]/[Formula: see text], the prognostic value of these parameters, and the effects of prone positioning. We described respiratory mechanics among subjects with COVID-19 who were intubated during the first month of hospitalization.
Methods: We included patients with COVID-19 who were mechanically ventilated between February and May 2020. Daily values of pulmonary compliance, [Formula: see text], [Formula: see text], and the use of prone positioning were abstracted from electronic medical records. The trends were analyzed separately over days 1-10 and days 1-35 of intubation, stratified by prone positioning use, survival, and initial [Formula: see text]/[Formula: see text].
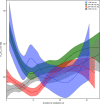
Results: Among 49 subjects on mechanical ventilation day 1, the mean compliance was 41 mL/cm H2O, decreasing to 25 mL/cm H2O by day 14, the median duration of mechanical ventilation. In contrast, the [Formula: see text]/[Formula: see text] on day 1 was similar to day 14. The overall mean compliance was greater among the non-survivors versus the survivors (27 mL/cm H2O vs 24 mL/cm H2O; P = .005), whereas [Formula: see text]/[Formula: see text] was higher among the survivors versus the non-survivors over days 1-10 (159 mm Hg vs 138 mm Hg; P = .002) and days 1-35 (175 mm Hg vs 153 mm Hg; P < .001). The subjects who underwent early prone positioning had lower compliance during days 1-10 (27 mL/cm H2O vs 33 mL/cm H2O; P < .001) and lower [Formula: see text]/[Formula: see text] values over days 1-10 (139.9 mm Hg vs 167.4 mm Hg; P < .001) versus those who did not undergo prone positioning. After day 21 of hospitalization, the average compliance of the subjects who had early prone positioning surpassed that of the subjects who did not have prone positioning.
Conclusions: Respiratory mechanics of the subjects with COVID-19 who were on mechanical ventilation were characterized by persistently low respiratory system compliance and [Formula: see text]/[Formula: see text], similar to ARDS due to other etiologies. The [Formula: see text]/[Formula: see text] was more tightly associated with mortality than with compliance.
Keywords: COVID-19; PaO2/FIO2/ ratio; SARS-CoV-2; hypoxemic respiratory failure; mechanical ventilation; oxygenation; pneumonia; prone positioning; pulmonary compliance; viral.
Copyright © 2021 by Daedalus Enterprises.
Conflict of interest statement
The authors have disclosed no conflicts of interest.
Figures


References
MeSH terms
Grants and funding
LinkOut - more resources
Full Text Sources
Medical
Miscellaneous

