

Wildfire smoke impacts on indoor air quality assessed using crowdsourced data in California
- PMID: 34465624
- PMCID: PMC8433518
- DOI: 10.1073/pnas.2106478118
Wildfire smoke impacts on indoor air quality assessed using crowdsourced data in California
Abstract
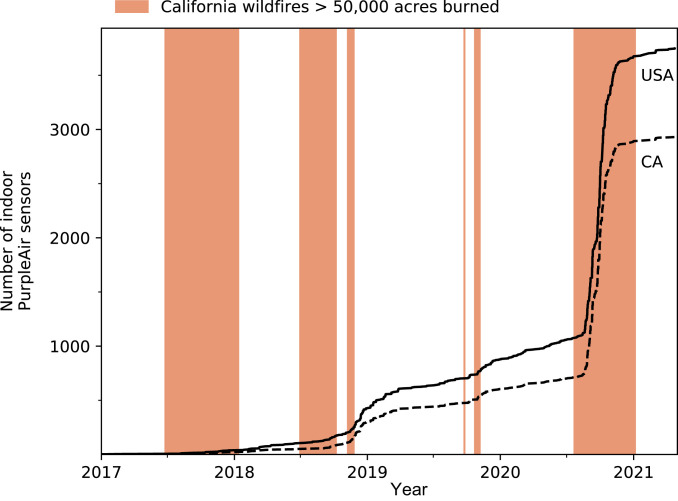
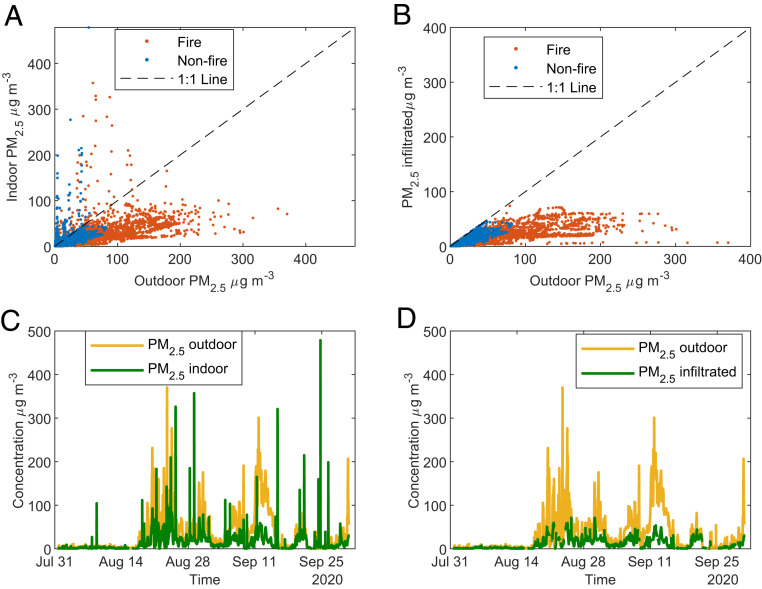
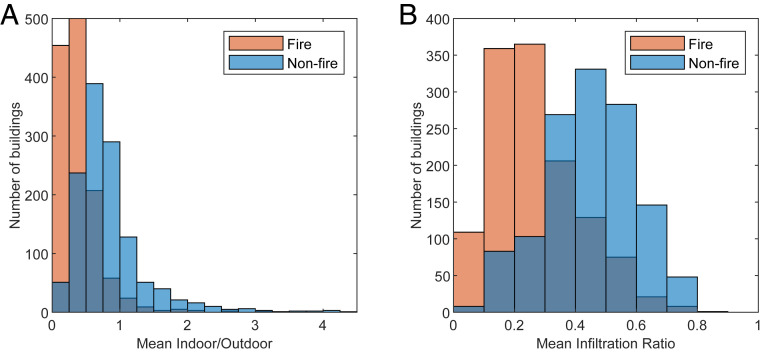
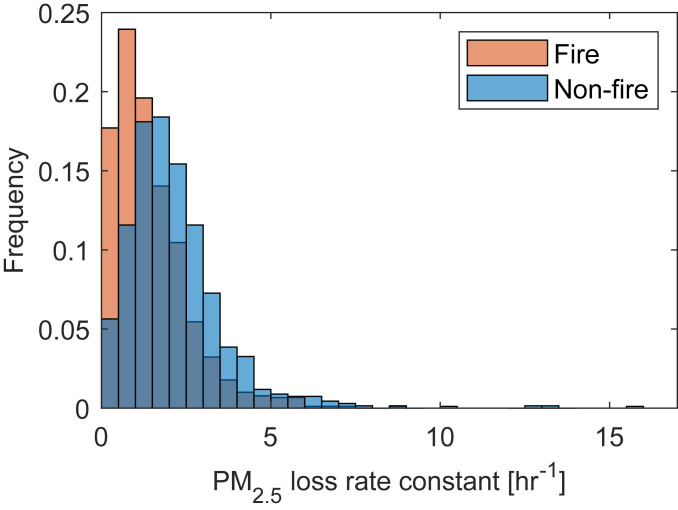
Wildfires have become an important source of particulate matter (PM2.5 < 2.5-µm diameter), leading to unhealthy air quality index occurrences in the western United States. Since people mainly shelter indoors during wildfire smoke events, the infiltration of wildfire PM2.5 into indoor environments is a key determinant of human exposure and is potentially controllable with appropriate awareness, infrastructure investment, and public education. Using time-resolved observations outside and inside more than 1,400 buildings from the crowdsourced PurpleAir sensor network in California, we found that the geometric mean infiltration ratios (indoor PM2.5 of outdoor origin/outdoor PM2.5) were reduced from 0.4 during non-fire days to 0.2 during wildfire days. Even with reduced infiltration, the mean indoor concentration of PM2.5 nearly tripled during wildfire events, with a lower infiltration in newer buildings and those utilizing air conditioning or filtration.
Keywords: PM2.5; biomass burning; exposure; indoor air; low-cost PM2.5 sensors.
Conflict of interest statement
The authors declare no competing interest.
Figures

Similar articles
-
Fine particulate matter infiltration at Western Montana residences during wildfire season.Sci Total Environ. 2023 Oct 20;896:165238. doi: 10.1016/j.scitotenv.2023.165238. Epub 2023 Jun 29. Sci Total Environ. 2023. PMID: 37392877 Free PMC article.
-
Practical considerations for using low-cost sensors to assess wildfire smoke exposure in school and childcare settings.J Expo Sci Environ Epidemiol. 2025 Apr;35(2):157-168. doi: 10.1038/s41370-024-00677-8. Epub 2024 May 10. J Expo Sci Environ Epidemiol. 2025. PMID: 38730039
-
Assessing residential PM2.5 concentrations and infiltration factors with high spatiotemporal resolution using crowdsourced sensors.Proc Natl Acad Sci U S A. 2023 Dec 12;120(50):e2308832120. doi: 10.1073/pnas.2308832120. Epub 2023 Dec 4. Proc Natl Acad Sci U S A. 2023. PMID: 38048461 Free PMC article.
-
Cardiovascular health impacts of wildfire smoke exposure.Part Fibre Toxicol. 2021 Jan 7;18(1):2. doi: 10.1186/s12989-020-00394-8. Part Fibre Toxicol. 2021. PMID: 33413506 Free PMC article. Review.
-
Indoor PM2.5, tobacco smoking and chronic lung diseases: A narrative review.Environ Res. 2020 Feb;181:108910. doi: 10.1016/j.envres.2019.108910. Epub 2019 Nov 13. Environ Res. 2020. PMID: 31780052 Review.
Cited by
-
Climate change and public health in California: A structured review of exposures, vulnerable populations, and adaptation measures.Proc Natl Acad Sci U S A. 2024 Aug 6;121(32):e2310081121. doi: 10.1073/pnas.2310081121. Epub 2024 Jul 29. Proc Natl Acad Sci U S A. 2024. PMID: 39074290 Free PMC article. Review.
-
Global expansion of wildland-urban interface intensifies human exposure to wildfire risk in the 21st century.Sci Adv. 2024 Nov 8;10(45):eado9587. doi: 10.1126/sciadv.ado9587. Epub 2024 Nov 8. Sci Adv. 2024. PMID: 39514665 Free PMC article.
-
Indoor air pollution and airway health.J Allergy Clin Immunol. 2024 Oct;154(4):835-846. doi: 10.1016/j.jaci.2024.08.013. Epub 2024 Aug 23. J Allergy Clin Immunol. 2024. PMID: 39182629 Free PMC article. Review.
-
Clearing the Air: Understanding the Impact of Wildfire Smoke on Asthma and COPD.Healthcare (Basel). 2024 Jan 25;12(3):307. doi: 10.3390/healthcare12030307. Healthcare (Basel). 2024. PMID: 38338192 Free PMC article. Review.
-
China's public health initiatives for climate change adaptation.Lancet Reg Health West Pac. 2023 Nov 15;40:100965. doi: 10.1016/j.lanwpc.2023.100965. eCollection 2023 Nov. Lancet Reg Health West Pac. 2023. PMID: 38116500 Free PMC article. Review.
References
-
- Dennison P. E., Brewer S. C., Arnold J. D., Moritz M. A., Large wildfire trends in the western United States, 1984-2011. Geophys. Res. Lett. 41, 2928–2933 (2014).
