. 2021 Oct 8;374(6564):eabh1823.
doi: 10.1126/science.abh1823. Epub 2021 Oct 8.

Cross-reactive CD4+ T cells enhance SARS-CoV-2 immune responses upon infection and vaccination

Affiliations

Cross-reactive CD4+ T cells enhance SARS-CoV-2 immune responses upon infection and vaccination

Lucie Loyal et al. Science. .

Abstract

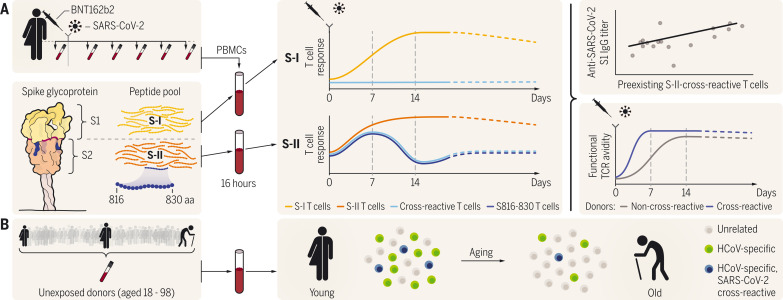
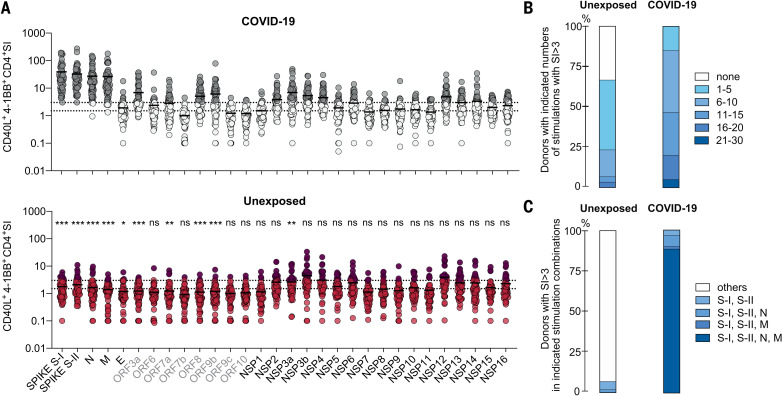
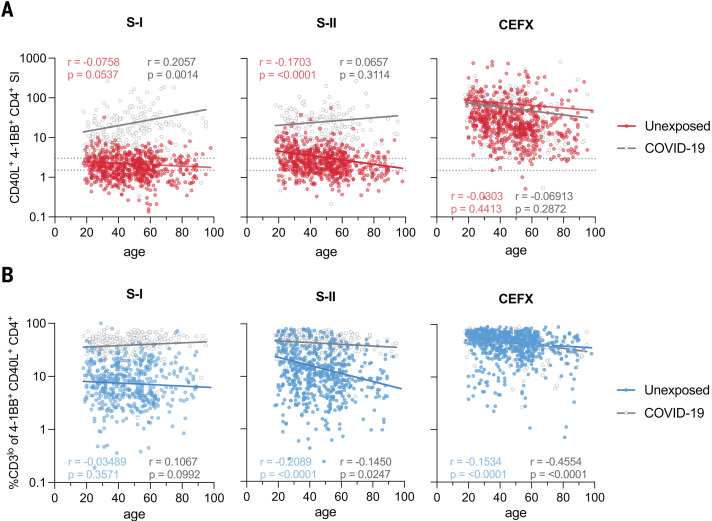
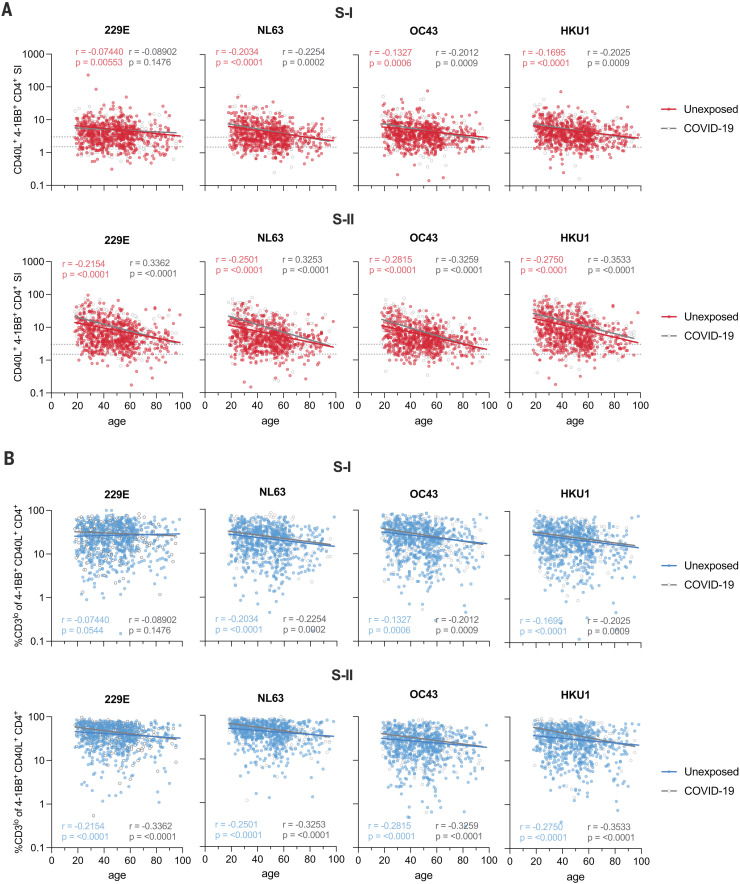
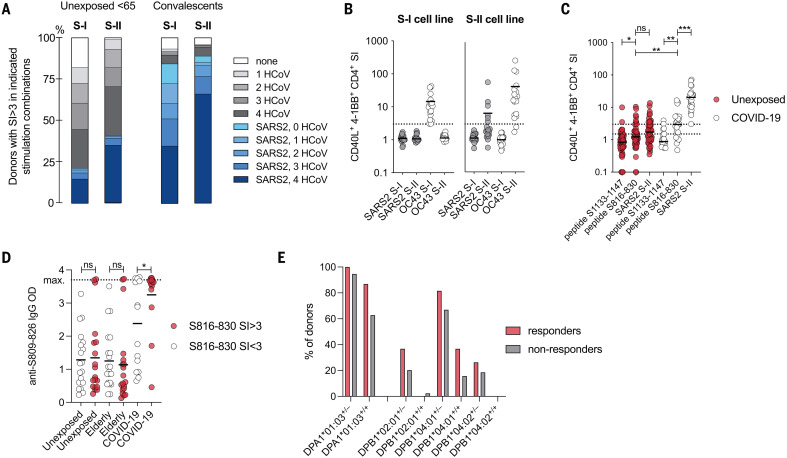
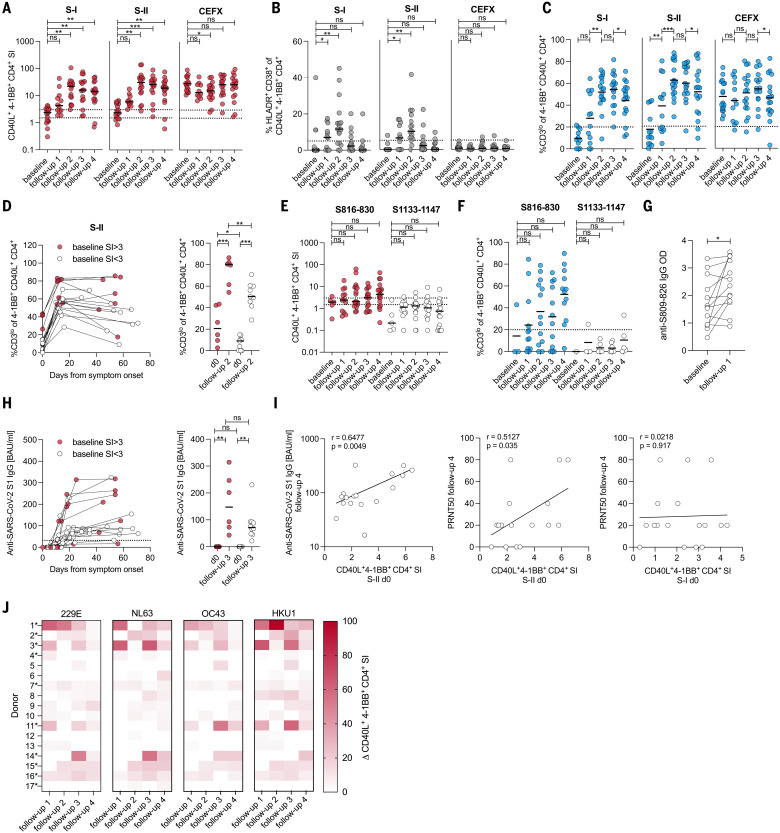
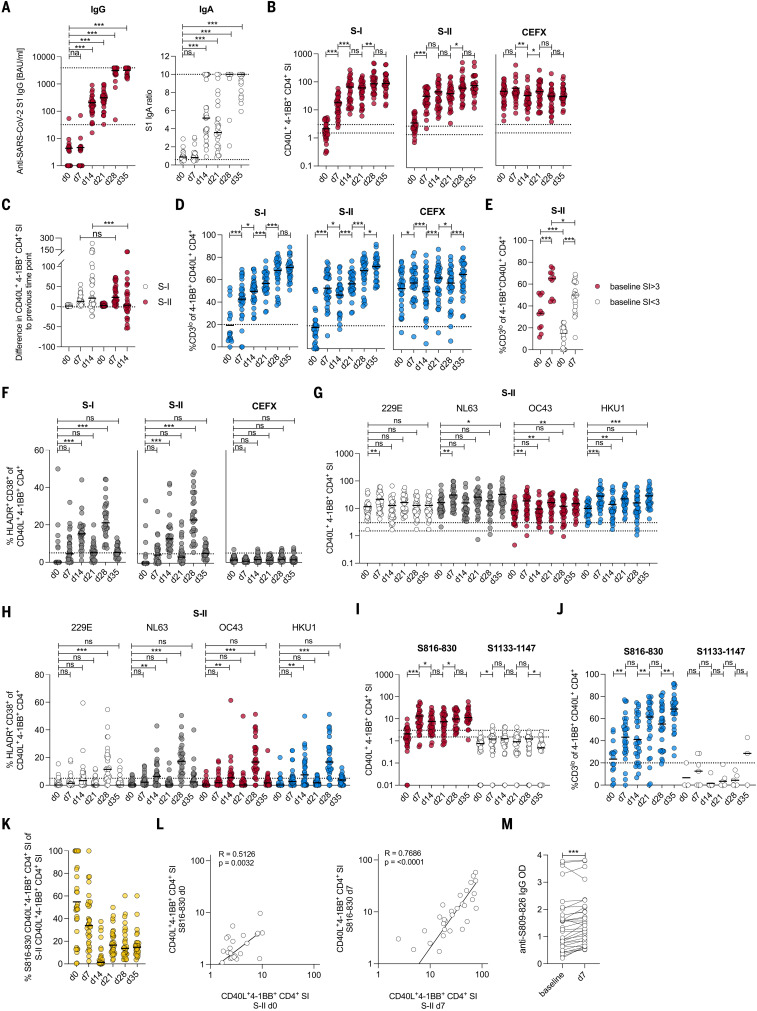
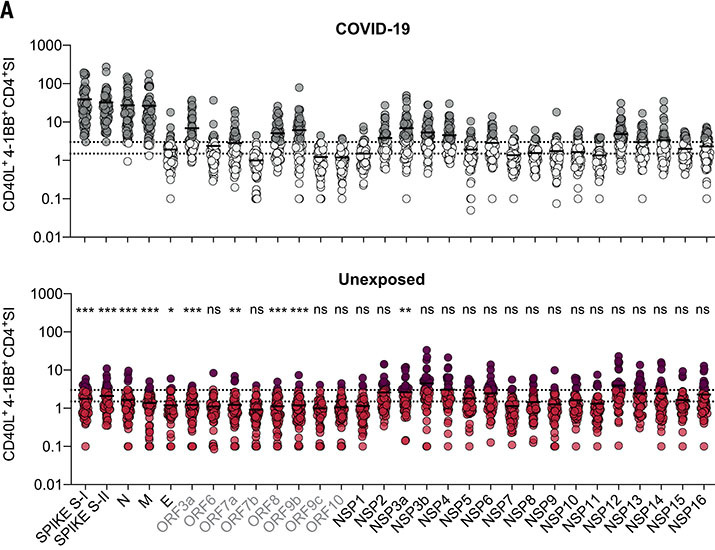
The functional relevance of preexisting cross-immunity to severe acute respiratory syndrome coronavirus 2 (SARS-CoV-2) is a subject of intense debate. Here, we show that human endemic coronavirus (HCoV)–reactive and SARS-CoV-2–cross-reactive CD4+ T cells are ubiquitous but decrease with age. We identified a universal immunodominant coronavirus-specific spike peptide (S816-830) and demonstrate that preexisting spike- and S816-830–reactive T cells were recruited into immune responses to SARS-CoV-2 infection and their frequency correlated with anti–SARS-CoV-2-S1-IgG antibodies. Spike–cross-reactive T cells were also activated after primary BNT162b2 COVID-19 messenger RNA vaccination and displayed kinetics similar to those of secondary immune responses. Our results highlight the functional contribution of preexisting spike–cross-reactive T cells in SARS-CoV-2 infection and vaccination. Cross-reactive immunity may account for the unexpectedly rapid induction of immunity after primary SARS-CoV-2 immunization and the high rate of asymptomatic or mild COVID-19 disease courses.


Figures

None
Cross-reactive CD4+ T cells enhance SARS-CoV-2 immune responses upon infection and vaccination.
(A) Preexisting SARS-CoV-2 S-II– and spike (S)816-830–cross-reactive T cells show booster response characteristics upon SARS-CoV-2 infection and vaccination and their abundance correlates with higher protective anti–SARS-CoV-2 S1-IgG titers and higher functional T cell avidity. (B) The frequency of HCoV-reactive and SARS-CoV-2–cross-reactive T cells decreases with age.
Fig. 1.
Fig. 1.. CD4+ T cell cross-reactivity against the SARS-CoV-2 orfeome.
(A) Ex vivo stimulation of PBMCs from COVID-19 convalescent patients (top panel, n = 59) and unexposed individuals (bottom panel, n = 60). The percentage of CD40L+4-1BB+ CD4+ T cells among stimulated PBMCs was divided by the percentage of these cells among unstimulated PBMCs to determine the SI shown on the y-axis. The SARS-CoV-2 orfeome peptide pools used for stimulation are shown below the bottom panel. Gray labels highlight proteins exclusive for SARS-CoV-2 (i.e., those not shared with HCoVs). Gray circles (COVID-19) or red circles (unexposed) identify donors with an SI ≥ 3. Dotted lines indicate an SI of 1.5 and 3. Statistically significant differences between COVID-19 convalescents and unexposed groups (with respect to each peptide pool) are indicated above the bottom panel. *P < 0.05, **P < 0.01, and ***P < 0.001; ns, not significant at P > 0.05 by unpaired Student’s t test. (B) Bars show the proportions of individuals with the indicated number of SARS-CoV-2 orfeome peptide pool stimulations with an SI ≥ 3. (C) Proportions of individuals with an SI ≥ 3 for each stimulation in each indicated stimulation combination.
Fig. 2.
Fig. 2.. The magnitude of SARS-CoV-2 cross-reactivity decreases with age.
(A) Scatter plots showing the SI (CD40L+41BB+ CD4+ T cells) among PBMCs stimulated with SARS-CoV-2 S-I, SARS-CoV-2 S-II, or CEFX (known T cell–stimulating peptides from CMV, EBV, influenza virus, and other common pathogens) plotted against age in n = 568 unexposed donors and n = 174 COVID-19 convalescents. Dotted lines indicate an SI of 1.5 and 3. (B) Frequencies of CD3lo cells among S-I–, S-II–, or CEFX-reactive CD40L+4-1BB+ CD4+ T cells over age. CD3lo frequencies are shown for T cell responses with an SI ≥ 1.5. Regression lines denote linear regression on age in each group; the corresponding Pearson correlation coefficients are shown.
Fig. 3.
Fig. 3.. Frequencies of high-functional-avidity T cells specific for spike S-II from HCoVs decrease with age.
(A) Scatter plots show the SI of CD40L+4-1BB+ CD4+ T cells in unexposed individuals (n = 568) and COVID-19 convalescents (n = 174) after PBMC stimulation with HCoV (229E, NL63, OC43, and HKU1) spike S-I or S-II peptide pools plotted against age. Dotted lines indicate an SI of 1.5 and 3. (B) Frequencies of CD3lo cells in CD40L+4-1BB+ CD4+ T cells from unexposed and COVID-19 convalescents plotted against age. CD3lo frequencies are shown for T cell responses with an SI ≥ 1.5. Regression lines denote linear regression on age in each group; the corresponding Pearson correlation coefficients are shown.
Fig. 4.
Fig. 4.. Peptide S816-830 constitutes an immunodominant epitope of SARS-CoV-2 T cell cross-reactivity.
(A) Bars show the proportions of unexposed individuals <65 years of age (n = 491) and COVID-19 convalescents (n = 174, 18–79 years) with S-I– or S-II–specific T cell responses to HCoV and/or SARS-CoV-2 with an SI ≥ 3. (B) Plots showing the SI (CD40L+4-1BB+ CD4+ T cells) of short-term T cell lines derived from OC43 S-I– and S-II–reactive primary T cells after restimulation with autologous antigen-presenting cells in the presence of OC43 or SARS-CoV-2 spike glycoprotein pools S-I and S-II. The dotted line indicates an SI of 3. (C) The SIs of CD40L+4-1BB+ CD4+ T cells from unexposed (n = 48) or COVID-19 convalescents (n = 22) after stimulation with the single peptide 204_3 (S816-830), the control single peptide 284 (S1133-1147), or the S-II peptide pool. (D) Levels (optical density, OD) of anti–S809-826 peptide IgG (ELISA) in unexposed young (<65 years) and elderly (>65 years) individuals as well as COVID-19 convalescents. ELISA plates were coated with an 18-aa peptide overlapping by 11 aa with S816-30. Serum was diluted 1:100. (E) Bars show the frequencies of common class-II HLA alleles in definite S816-830 responders (SI ≥ 3) and definite nonresponders (SI < 1.5) (n = 308). +/+, homozygous; +/–, heterozygous. *P < 0.05, **P < 0.01, ***P < 0.001; ns at P > 0.05 by Student’s t test.
Fig. 5.
Fig. 5.. HCoV-specific SARS-CoV-2–cross-reactive T cells are recruited into the primary SARS-CoV-2 infection response.
(A to C) SI of CD40L+4-1BB+ CD4+ T cells (A), frequencies of HLADR+CD38+ cells (B), and frequencies of CD3lo cells (C) among CD40L+4-1BB+ CD4+ T cells after stimulation with SARS-CoV-2 S-I, S-II, and CEFX peptide pools of donors before infection (baseline) and at four different follow-up time points (table S2) after symptom onset. CD3lo frequencies are shown only for T cell responses with an SI ≥ 1.5. (D) Changes to CD3lo frequencies among CD40L+4-1BB+ CD4+ T cells between baseline, follow-up 2 (10 to 16 days after symptom onset), and follow-up 4 (29 to 71 days after symptom onset) (left plot), and statistics (right plot) for baseline and follow-up measurement time point 2 in cross-reactive donors (baseline SI ≥ 3, red circles) and non–cross-reactive donors (baseline SI < 3, white circles). (E and F) SI (E) and frequency (F) of CD3lo of CD40L+4-1BB+ CD4+ T cells after stimulation with peptide S816-830 or control peptide S1133-1147. CD3lo frequencies are shown for T cell responses with an SI ≥ 1.5. (G) Levels (OD) of anti–S809-826 peptide IgG (ELISA) at baseline and follow-up time point 1 (3 to 9 days after symptom onset). ELISA plates were coated with an 18-aa peptide overlapping by 11 aa with S816-830. (H) Anti–S1-IgG binding antibody units (BAUs) in cross-reactive (baseline SI ≥ 3, red circles) and non–cross-reactive donors (baseline SI < 3, white circles) were plotted against time (left) and compared between baseline and follow-up 3 (right). (I) Scatter plots showing the relationship between anti–SARS-CoV-2 S1 IgG antibody levels (OD) at follow-up 4 and the SI of CD40L+4-1BB+ CD4+ T cells upon S-II stimulation at baseline (left), the relationship between neutralizing antibody titers (PRNT50) at follow-up 4, and the SI of CD40L+4-1BB+ CD4+ T cells upon S-II stimulation (left) or S-I stimulation (right) at baseline. (J) Heatmap showing the change in SI of CD40L+4-1BB+ CD4+ T cells after stimulation with S-II pools of the indicated HCoVs. Δ represents the change of the parameter at the given time point relative to baseline (i.e., white depicts no increase). Asterisks indicate S816-830 peptide responders. For (A), (B), (E), and (F), *P < 0.05, **P < 0.01, ***P < 0.001, and ns at P > 0.05 by repeated-measures one-way-ANOVA with Dunnett’s correction. For (C) and (G), *P < 0.05, **P < 0.01, ***P < 0.001, and ns at P > 0.05 by paired Student’s t test. For (D) and (H), *P < 0.05, **P < 0.01, ***P < 0.001, and ns at P > 0.05 by Student’s t test. For (E), ns at P > 0.05 by paired Student’s t test. For (I) ns at P > 0.05 by Pearson correlation.
Fig. 6.
Fig. 6.. HCoV-specific SARS-CoV-2–cross-reactive T cells are recruited into the BNT162b2 vaccine response.
(A) Serum anti-SARS-CoV-2 S1 IgG BAUs and IgA titer ratio were determined at baseline, day 7, and day 14 after primary vaccination with BNT162b, immediately before secondary vaccination (day 21) as well as 1 (day 28) and 2 weeks (day 35) after secondary vaccination. All values <1 were set to 1. The lower and upper cut-off levels for IgG were set at 32 and 3900, respectively; the corresponding IgA cut-offs were set at 0.6 and 10, respectively, indicated by dotted lines. (B) Plots showing the SI of CD40L+4-1BB+ CD4+ T cells after stimulation with S-I, S-II, and CEFX at baseline and at the indicated time points. (C) Difference in SI after stimulation with S-I and S-II at each time point relative to the previous time point. (D) Plots showing the frequencies of CD3lo of CD40L+4-1BB+ CD4+ T cells after stimulation with S-I, S-II, and CEFX for responses with an SI ≥ 1.5. (E) Frequencies of CD3lo of CD40L+4-1BB+ CD4+ T cells at days 0 and 7 in cross-reactive donors (baseline SI ≥ 3, red circles) and non–cross-reactive donors (baseline SI < 3, white circles). (F) Frequencies of HLADR+CD38+ cells among CD40L+4-1BB+ CD4+ T cells after stimulation with S-I, S-II, and CEFX at the indicated time points. (G and H) SI of CD40L+4-1BB+ CD4+ T cells (G) and frequencies of HLADR+CD38+ among these cells (H) after stimulation with HCoV S-II peptide pools at baseline and the indicated time points. (I and J) SI of CD40L+4-1BB+ CD4+ T cells (I) and frequencies of CD3lo events (SI ≥ 1.5) (J) among these cells after stimulation with peptide S816-830 and control peptide S1133-1147 at baseline and the indicated time points. (K) Proportion of S816-830–reactive T cells over SARS-CoV-2 S-II–reactive T cells. (L) Relationship between responses to S816-830 and SARS-CoV-2 S-II peptide pool stimulation at day 0 (left) and day 7 (right). (M) OD of anti–S809-826-peptide IgG ELISA from sera before and 7 days after primary vaccination. For (A) and (F) to (J), *P < 0.05, **P < 0.01, ***P < 0.001, and ns at P > 0.05 by repeated-measures one-way-ANOVA with Dunnett’s correction. For (B) to (D) and (M), *P < 0.05, **P < 0.01, ***P < 0.001, and ns at P > 0.05 by paired Student’s t test. For (E), *P < 0.05, **P < 0.01, ***P < 0.001, and ns at P > 0.05 by Student’s t test. For (L), ns at P > 0.05 by Pearson correlation.
Description

References

    1. Williamson E. J., Walker A. J., Bhaskaran K., Bacon S., Bates C., Morton C. E., Curtis H. J., Mehrkar A., Evans D., Inglesby P., Cockburn J., McDonald H. I., MacKenna B., Tomlinson L., Douglas I. J., Rentsch C. T., Mathur R., Wong A. Y. S., Grieve R., Harrison D., Forbes H., Schultze A., Croker R., Parry J., Hester F., Harper S., Perera R., Evans S. J. W., Smeeth L., Goldacre B., Factors associated with COVID-19-related death using OpenSAFELY. Nature 584, 430–436 (2020). 10.1038/s41586-020-2521-4 - DOI - PMC - PubMed
    1. Stervbo U., Rahmann S., Roch T., Westhoff T. H., Babel N., Epitope similarity cannot explain the pre-formed T cell immunity towards structural SARS-CoV-2 proteins. Sci. Rep. 10, 18995 (2020). 10.1038/s41598-020-75972-z - DOI - PMC - PubMed
    1. Braun J., Loyal L., Frentsch M., Wendisch D., Georg P., Kurth F., Hippenstiel S., Dingeldey M., Kruse B., Fauchere F., Baysal E., Mangold M., Henze L., Lauster R., Mall M. A., Beyer K., Röhmel J., Voigt S., Schmitz J., Miltenyi Biotec S., Demuth I., Müller M. A., Hocke A., Witzenrath M., Suttorp N., Kern F., Reimer U., Wenschuh H., Drosten C., Corman V. M., Giesecke-Thiel C., Sander L. E., Thiel A., SARS-CoV-2-reactive T cells in healthy donors and patients with COVID-19. Nature 587, 270–274 (2020). 10.1038/s41586-020-2598-9 - DOI - PubMed
    1. Grifoni A., Weiskopf D., Ramirez S. I., Mateus J., Dan J. M., Moderbacher C. R., Rawlings S. A., Sutherland A., Premkumar L., Jadi R. S., Marrama D., de Silva A. M., Frazier A., Carlin A. F., Greenbaum J. A., Peters B., Krammer F., Smith D. M., Crotty S., Sette A., Targets of T cell responses to SARS-CoV-2 coronavirus in humans with COVID-19 disease and unexposed individuals. Cell 181, 1489–1501.e15 (2020). 10.1016/j.cell.2020.05.015 - DOI - PMC - PubMed
    1. Nelde A., Bilich T., Heitmann J. S., Maringer Y., Salih H. R., Roerden M., Lübke M., Bauer J., Rieth J., Wacker M., Peter A., Hörber S., Traenkle B., Kaiser P. D., Rothbauer U., Becker M., Junker D., Krause G., Strengert M., Schneiderhan-Marra N., Templin M. F., Joos T. O., Kowalewski D. J., Stos-Zweifel V., Fehr M., Rabsteyn A., Mirakaj V., Karbach J., Jäger E., Graf M., Gruber L.-C., Rachfalski D., Preuß B., Hagelstein I., Märklin M., Bakchoul T., Gouttefangeas C., Kohlbacher O., Klein R., Stevanović S., Rammensee H.-G., Walz J. S., SARS-CoV-2-derived peptides define heterologous and COVID-19-induced T cell recognition. Nat. Immunol. 22, 74–85 (2021). 10.1038/s41590-020-00808-x - DOI - PubMed

Publication types

MeSH terms