. 2021 Sep 1;9(1):40.
doi: 10.1038/s41413-021-00159-9.

Osteoblastic glucocorticoid signaling exacerbates high-fat-diet- induced bone loss and obesity

Affiliations

Osteoblastic glucocorticoid signaling exacerbates high-fat-diet- induced bone loss and obesity

Sarah Kim et al. Bone Res. .

Abstract

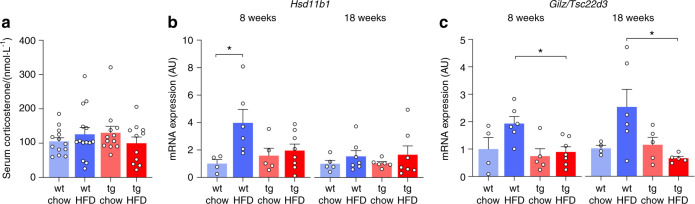
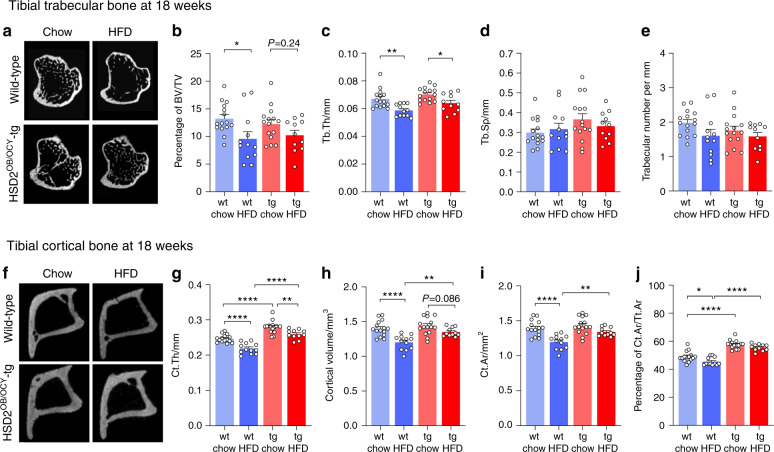
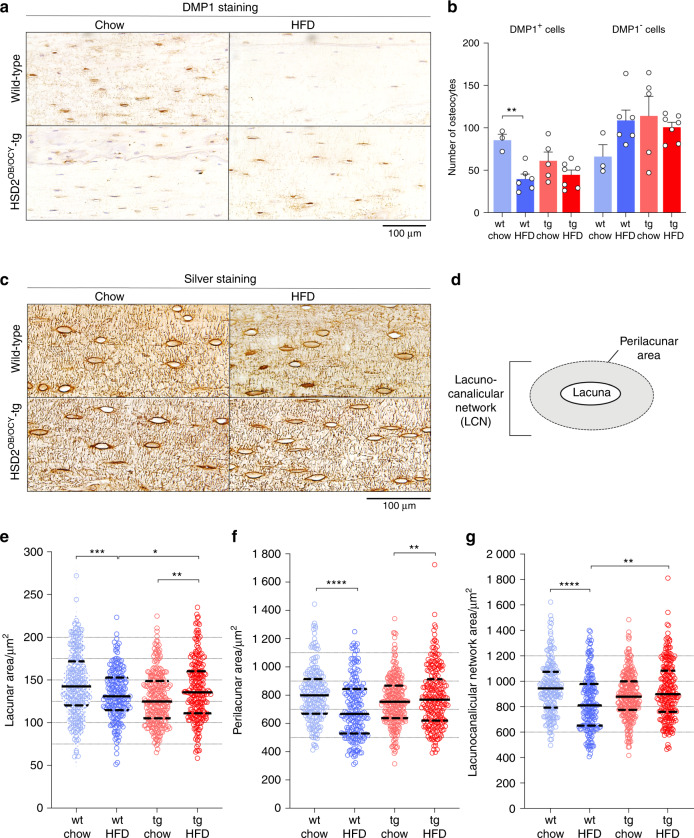
Chronic high-fat diet (HFD) consumption not only promotes obesity and insulin resistance, but also causes bone loss through mechanisms that are not well understood. Here, we fed wild-type CD-1 mice either chow or a HFD (43% of energy from fat) for 18 weeks; HFD-fed mice exhibited decreased trabecular volume (-28%) and cortical thickness (-14%) compared to chow-fed mice. In HFD-fed mice, bone loss was due to reduced bone formation and mineral apposition, without obvious effects on bone resorption. HFD feeding also increased skeletal expression of sclerostin and caused deterioration of the osteocyte lacunocanalicular network (LCN). In mice fed HFD, skeletal glucocorticoid signaling was activated relative to chow-fed mice, independent of serum corticosterone concentrations. We therefore examined whether skeletal glucocorticoid signaling was necessary for HFD-induced bone loss, using transgenic mice lacking glucocorticoid signaling in osteoblasts and osteocytes (HSD2OB/OCY-tg mice). In HSD2OB/OCY-tg mice, bone formation and mineral apposition rates were not suppressed by HFD, and bone loss was significantly attenuated. Interestingly, in HSD2OB/OCY-tg mice fed HFD, both Wnt signaling (less sclerostin induction, increased β-catenin expression) and glucose uptake were significantly increased, relative to diet- and genotype-matched controls. The osteocyte LCN remained intact in HFD-fed HSD2OB/OCY-tg mice. When fed a HFD, HSD2OB/OCY-tg mice also increased their energy expenditure and were protected against obesity, insulin resistance, and dyslipidemia. Therefore, glucocorticoid signaling in osteoblasts and osteocytes contributes to the suppression of bone formation in HFD-fed mice. Skeletal glucocorticoid signaling is also an important determinant of glucose uptake in bone, which influences the whole-body metabolic response to HFD.


Conflict of interest statement

The authors declare no competing interests.

Figures

Fig. 1
Fig. 1
HFD feeding induced skeletal glucocorticoid signaling in wild-type but not HSD2OB/OCY-tg mice, independent of circulating corticosterone concentrations. The results are shown as scatterplots, with the mean ± SEM shown in columns. a Corticosterone concentrations were measured in serum collected from mice between 10 a.m. and 2 p.m. wt wild-type, tg transgenic. b Skeletal (femur) mRNA expression of the 11β-hydroxy-steroid-dehydrogenase type 1 (11β-HSD1) gene (Hsd11b1) after 8 and 18 weeks of chow or HFD feeding. Gene expression results are shown in arbitrary units (AU) relative to wild-type chow-fed mice (1.00). At 8 weeks, there was a significant effect of diet (F1,19 = 5.932, P = 0.025). c Skeletal (femur) mRNA expression of the glucocorticoid target gene Tsc22 domain family member 3 (Tsc22d3, also known as glucocorticoid-induced leucine zipper (Gilz)). At 8 weeks, the effect of genotype was significant (F1,18 = 5.622, P = 0.029), while there was a significant diet × genotype interaction at 18 weeks (F1,16 = 5.556, P = 0.032). Significance was determined using two-way ANOVA at each timepoint, with the Tukey’s multiple comparison test used for post hoc testing. In all cases, *P < 0.05 for comparison
Fig. 2
Fig. 2
Disrupting glucocorticoid signaling in osteoblasts and osteocytes prevented HFD-induced loss of trabecular and cortical bone. a Sections of tibial trabecular bone from male wild-type (wt) and HSD2OB/OCY-tg (tg) mice fed either chow or HFD for 18 weeks. be Micro-CT results are shown as scatterplots, with the mean ± SEM shown in columns, n = 11–15/group, as shown. b Bone volume/total volume (BV/TV) in trabecular bone; the effect of diet was highly significant (F1,49 = 9.511, P = 0.003 4). c Trabecular thickness (Tb.Th.); the effect of diet was highly significant (F1,49 = 20.50, P < 0.000 1), and the effect of genotype was significant (F1,49 = 7.010, P = 0.011). d Trabecular spacing (Tb.Sp.). e Trabecular number (Tb.N.); the effect of diet was significant (F1,49 = 4.367, P  = 0.042). f Sections of tibial cortical bone from male wild-type (wt) and HSD2OB/OCY-tg (tg) mice fed either chow or HFD for 18 weeks. g–j Cortical micro-CT measurements of n = 11–15/group, as shown: g Cortical thickness (Ct.Th); the effects of diet and genotype were both highly significant (diet: F1,49 = 36.15, P  < 0.000 1, genotype: F1,49 = 83.45, P  < 0.000 1). h Cortical volume; the effects of diet and genotype were highly significant (diet: F1,49 = 23.43, P < 0.000 1, genotype: F1,49 = 10.03, P  = 0.002 7). i Cortical area (Ct.Ar); the effects of diet and genotype were highly significant (diet: F1,49 = 24.34, P  < 0.000 1, genotype: F1,49 = 9.878, P  = 0.002 8). j Cortical area fraction (Ct.Ar/Tt.Ar); the effects of diet and genotype were highly significant (diet: F1,49 = 11.16, P = 0.001 6, genotype: F1,49 = 119.9, P  < 0.000 1). Significance was determined using two-way ANOVA, with the Tukey’s multiple comparison test used for post hoc testing. In all cases, *P  < 0.05, **P  < 0.01, ***P  < 0.001, and ****P  < 0.000 1 for comparison
Fig. 3
Fig. 3
HFD feeding for 18 weeks reduced bone formation in wild-type mice but not in HSD2OB/OCY-tg mice. The results are shown as scatterplots, with the mean ± SEM shown in columns. a Bone formation rate (BFR) and b mineral apposition rate (MAR) in wild-type (wt) and HSD2OB/OCY-tg (tg) mice fed either chow or HFD for 18 weeks. In each case, there was a significant diet × genotype interaction (for BFR, F1,8 = 10.16, P = 0.013; for MAR: F1,8 = 6.68, P = 0.032). c Trabecular osteoblast surface (%): the effect of diet was significant (F1,16 = 6.74, P = 0.020). d Osteoblast number. e Bone mRNA expression of collagen, type 1, alpha 1 (Col1a1): the diet × genotype interaction was significant (F1,17 = 5.010, P = 0.039). f Serum procollagen type I N-terminal propeptide (P1NP) concentrations: the effect of genotype was highly significant (F1,47 = 11.47, P = 0.001 4). g Osteoclast surface: the diet × genotype interaction was significant (F1,16 = 5.400, P = 0.034). h Osteoclast number: the effect of genotype was significant (F1,16 = 5.932, P = 0.027). i Serum tartrate-resistant acid phosphatase 5b (TRAP5b) concentrations. In all cases, significance was determined using two-way ANOVA, with the Tukey’s multiple comparison test used for post hoc testing, *P < 0.05 and **P < 0.01 for comparison
Fig. 4
Fig. 4
Wnt signaling and glucose uptake in the bones of wild-type and HSD2OB/OCY-tg mice. The results are shown as scatterplots, with the mean ± SEM shown in columns. a Bone expression of sclerostin (Sost) mRNA. All mRNA expression results are shown relative to chow-fed wild-type mice and are expressed in arbitrary units (AU), normalized to 18S mRNA expression. The diet × genotype interaction was highly significant (F1,11 = 9.71, P = 0.009 8). b Immunoblot of sclerostin protein expression in bones of wild-type and HSD2OB/OCY-tg mice: each lane contains samples pooled from three mice, with β-actin shown as a loading control. c Proportion of β-catenin-positive osteoblasts and osteocytes. The diet × genotype interaction was significant (F1,20 = 6.488, P = 0.019). Representative sections of trabecular bone from each group of mice are shown in Fig. S2. df Bone mRNA expression of the Wnt signaling molecules d transcription factor 7 (T-cell specific, HMG-box) (Tcf7), e transcription factor 7 like 2 (Tcf7l2), and f bone morphogenetic protein-4 (Bmp4). g Glucose uptake into bone; h brown adipose tissue; i gonadal white adipose tissue; and j quadriceps muscle after 8 weeks of chow/FHD deeding. For glucose uptake measurements, n = 6–14 for each group. For glucose uptake in bone, the effect of genotype was significant (F1,33 = 4.729, P = 0.037). Significance was determined using two-way ANOVA, with the Tukey’s multiple comparison test used for post hoc testing. In all cases, *P < 0.05, **P < 0.01, and ***P < 0.001 for comparison
Fig. 5
Fig. 5
HFD feeding disrupted the lacunocanalicular network (LCN) in wild-type mice but not in HSD2OB/OCY-tg mice. a Representative images of DMP1-stained tibial sections from wild-type and HSD2OB/OCY-tg mice fed either chow or HFD for 18 weeks. b Number of DMP1-positive and DMP1-negative osteocytes in sections from wild-type and HSD2OB/OCY-tg mice. The results are shown as scatterplots, with the mean ± SEM shown in columns. Significance was determined using two-way ANOVA for DMP1+ and DMP1 cells, with the Tukey’s multiple comparison test used for post hoc testing. c Representative images of silver nitrate-stained tibial sections from wild-type and HSD2OB/OCY-tg mice fed either chow or HFD for 18 weeks. d Diagram for determination of the lacunar area, perilacunar area, and the entire LCN. e Distribution of the lacunar area; median and quartlies (1st and 3rd) are shown by solid and dashed lines, respectively. Dotted lines show bin sizes used for the χ2-test, which was used to compare distributions. Significance was adjusted for multiple comparisons using Bonferroni’s method. f Distribution of the perilacunar area. g Distribution of the entire LCN area. In all cases, *P < 0.05, **P < 0.01, ***P < 0.001, and ****P < 0.000 1 for comparisons
Fig. 6
Fig. 6
HSD2OB/OCY-tg mice were protected against HFD-induced insulin resistance and glucose intolerance. a–d Insulin tolerance test (ITT) results from wild-type chow, wild-type HFD, tg chow and tg HFD mice after 4, 8, and 18 weeks of feeding. Blood glucose concentrations are expressed as a percentage of basal levels and are shown as the mean ± SEM, n = 10–11/group. d Inverse area under the curve during the ITT at 4, 8, and 18 weeks. The results are shown as scatterplots, with the mean ± SEM shown in columns. Significance was determined using two-way ANOVA at each timepoint, with the Tukey’s multiple comparison test used for post hoc testing. *P < 0.05 for comparison. e–h Oral glucose tolerance test (oGTT) results after 4, 8, and 18 weeks of feeding, n = 14–17 for each group/timepoint. h Incremental area under the curve for the GTT at 4, 8, and 18 weeks. At 18 weeks, the effects of diet and genotype were both significant (diet: F1,58 = 9.640, P = 0.002 9; genotype: F1,58 = 4.139, P = 0.047). *P < 0.05, **P < 0.01, and ****P < 0.000 1 for wild-type chow vs. wild-type HFD, †P < 0.05 and ††P < 0.01 for tg chow vs. tg HFD
Fig. 7
Fig. 7
When fed a HFD, HSD2OB/OCY-tg mice gained less weight, due to increased energy expenditure, and were protected against HFD-induced dyslipidemia. a Body weight of wild-type and HSD2OB/OCY-tg mice fed either regular chow or a HFD ad libitum for 18 weeks. The results are shown as the mean ± SEM, n = 18, 15, 14, and 13 mice for wt chow, wt HFD, HSD2OB/OCY-tg chow, and HSD2OB/OCY-tg HFD, respectively. b Representative DEXA scans of wild-type and HSD2OB/OCY-tg mice after 18 weeks of either chow or HFD feeding. c Body composition of wild-type and HSD2OB/OCY-tg mice fed either chow or HFD for 18 weeks. The results are shown as scatterplots, with the mean ± SEM shown in columns. The effects of diet and genotype were significant (diet: F1,49 = 25.90, P < 0.000 1; genotype: F1,49 = 4.266, P = 0.044). d Gonadal fat pad mass at sacrifice. The effects of diet and genotype were significant (diet: F1,47 = 18.18, P < 0.000 1; genotype: F1,47 = 5.194, P = 0.027 2). e Inguinal fat pad mass at sacrifice. The effect of diet was highly significant (F1,47 = 19.53, P < 0.000 1). f Plasma leptin concentrations at sacrifice. g Cumulative food intake for chow- and HFD-fed wild-type and HSD2OB/OCY-tg mice. At each timepoint, n = 3–10 cages. h Energy expenditure in the dark (left) and light (right) phases, measured after 8 weeks of chow/HFD feeding. Energy expenditure was normalized to lean body mass. In the dark phase, the overall effect of diet was significant (F1,16 = 5.146, P = 0.038). i Fasting serum concentrations of cholesterol. The effects of diet and genotype were significant (diet: F1,36 = 10.78, P = 0.002 3; genotype: F1,36 = 6.268, P = 0.017). j Fasting serum concentrations of triglycerides and k nonesterified fatty acids (NEFAs). Significance was determined using two-way ANOVA, with Tukey’s multiple comparison tests used for post hoc testing. In all cases, *P < 0.05, **P < 0.01, ***P < 0.001, and ****P < 0.000 1 for the indicated comparison

References

    1. Hariri N, Thibault L. High-fat diet-induced obesity in animal models. Nutr. Res. Rev. 2010;23:270–299. doi: 10.1017/S0954422410000168. - DOI - PubMed
    1. Hedeskov CJ, Capito K, Islin H, Hansen SE, Thams P. Long-term fat-feeding-induced insulin resistance in normal NMRI mice: postreceptor changes of liver, muscle and adipose tissue metabolism resembling those of type 2 diabetes. Acta Diabetol. 1992;29:14–19. doi: 10.1007/BF00572823. - DOI - PubMed
    1. Paigen B. Genetics of responsiveness to high-fat and high-cholesterol diets in the mouse. Am. J. Clin. Nutr. 1995;62:458S–462S. doi: 10.1093/ajcn/62.2.458S. - DOI - PubMed
    1. Cao JJ, Gregoire BR, Gao H. High-fat diet decreases cancellous bone mass but has no effect on cortical bone mass in the tibia in mice. Bone. 2009;44:1097–1104. doi: 10.1016/j.bone.2009.02.017. - DOI - PubMed
    1. Kyung TW, Lee JE, Phan TV, Yu R, Choi HS. Osteoclastogenesis by bone marrow-derived macrophages is enhanced in obese mice. J. Nutr. 2009;139:502–506. doi: 10.3945/jn.108.100032. - DOI - PubMed