. 2021 Aug 31;12(1):5192.
doi: 10.1038/s41467-021-25503-9.

Predicting post-operative right ventricular failure using video-based deep learning

Affiliations

Predicting post-operative right ventricular failure using video-based deep learning

Rohan Shad et al. Nat Commun. .

Abstract

Despite progressive improvements over the decades, the rich temporally resolved data in an echocardiogram remain underutilized. Human assessments reduce the complex patterns of cardiac wall motion, to a small list of measurements of heart function. All modern echocardiography artificial intelligence (AI) systems are similarly limited by design - automating measurements of the same reductionist metrics rather than utilizing the embedded wealth of data. This underutilization is most evident where clinical decision making is guided by subjective assessments of disease acuity. Predicting the likelihood of developing post-operative right ventricular failure (RV failure) in the setting of mechanical circulatory support is one such example. Here we describe a video AI system trained to predict post-operative RV failure using the full spatiotemporal density of information in pre-operative echocardiography. We achieve an AUC of 0.729, and show that this ML system significantly outperforms a team of human experts at the same task on independent evaluation.


Conflict of interest statement

The authors declare no competing interests

Figures

Fig. 1
Fig. 1. Overview of the project.
a Pre-operative echocardiography videos are processed as a stack of 32 frames. A two-stream implementation of raw greyscale videos and optical flow channels are fed into a 3D convolutional neural network to produce the prediction of RV failure. b The clinical workflow for predicting future risk of RV failure begins in the pre-operative phase using a combination of clinical parameters and a detailed echocardiographic assessment. Risk scores such as the CRITT and Penn scores are calculated thereafter to aid in risk stratification following which a decision is made to either electively implant a concomitant RVAD or proceed with LVAD alone. c The clinical ground truth is determined largely by the persistent need for inotropes past post-operative day 14 or right ventricular mechanical circulatory assist devices during the post-operative recovery period. MCS-ARC definitions are detailed in Supplementary Table 1. Artwork attribution from left to right in (b): Wikimedia Commons by Videoplasty.com; Anton Kalashny; Ralf Schmitzer".
Fig. 2
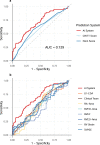
Fig. 2. Performance of the AI system, clinical risk scores, and clinical benchmarking.
a ROC curve of the AI system compared to contemporary clinical risk scores. The performance of the AI system was 0.729 (95% CI 0.623–0.835). b ROC curves of clinical expert team and independently calculated metrics of right ventricular function compared to the AI system. The performance of the AI system was found to exceed both clinical experts and the traditional risk scoring systems. LV-ESA left ventricular end systolic area, RVED-Area right ventricular end diastolic area, RVEF RV Ejection Fraction, RVES-Area RV end systolic area.
Fig. 3
Fig. 3. Analysis of saliency maps from pre-operative echocardiograms.
Representative input videos and visualizations for both systolic and diastolic phases of the cardiac cycle across patients with and without RV failure, in the form of a confusion matrix. True positives (bottom right quadrant), false positives (bottom left quadrant), true negatives (top left quadrant), and false negative examples (top right quadrant). Colour scale for each quadrant represents regions that contributed most to the predicted class (red) and those that pushed predicted probability away from the predicted class (blue).

References

    1. Kalogeropoulos AP, et al. Validation of clinical scores for right ventricular failure prediction after implantation of continuous-flow left ventricular assist devices. J. Heart Lung Transplant. 2015;34:1595–1603. doi: 10.1016/j.healun.2015.05.005. - DOI - PubMed
    1. LaRue SJ, et al. Clinical outcomes associated with INTERMACS-defined right heart failure after left ventricular assist device implantation. J. Heart Lung Transplant. 2017;36:475–477. doi: 10.1016/j.healun.2016.12.017. - DOI - PMC - PubMed
    1. Kirklin JK, et al. Eighth annual INTERMACS report: special focus on framing the impact of adverse events. J. Heart Lung Transplant. 2017;36:1080–1086. doi: 10.1016/j.healun.2017.07.005. - DOI - PubMed
    1. Atluri P, et al. Predicting right ventricular failure in the modern, continuous flow left ventricular assist device era. Ann. Thorac. Surg. 2013;96:857–863. doi: 10.1016/j.athoracsur.2013.03.099. - DOI - PMC - PubMed
    1. Drakos SG, et al. Risk factors predictive of right ventricular failure after left ventricular assist device implantation. Am. J. Cardiol. 2010;105:1030–1035. doi: 10.1016/j.amjcard.2009.11.026. - DOI - PubMed

Publication types

MeSH terms