. 2021 Aug 31;12(1):5184.
doi: 10.1038/s41467-021-25359-z.

Acquisition of aneuploidy drives mutant p53-associated gain-of-function phenotypes

Affiliations

Acquisition of aneuploidy drives mutant p53-associated gain-of-function phenotypes

Lindsay N Redman-Rivera et al. Nat Commun. .

Abstract

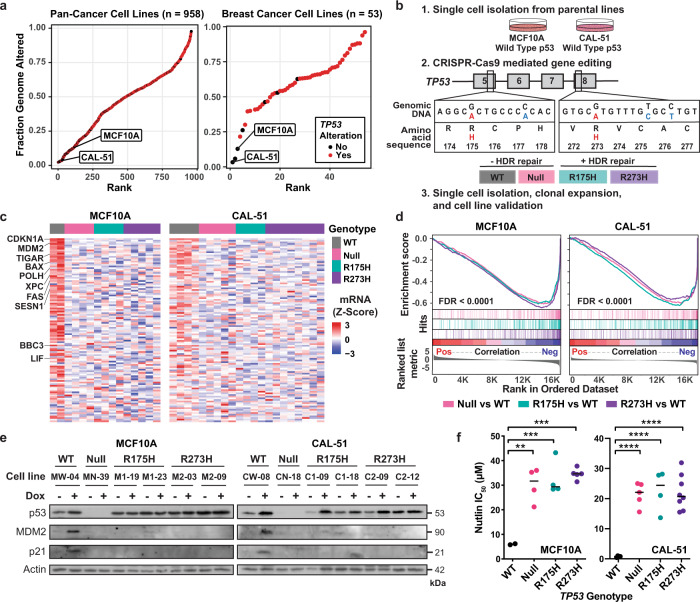
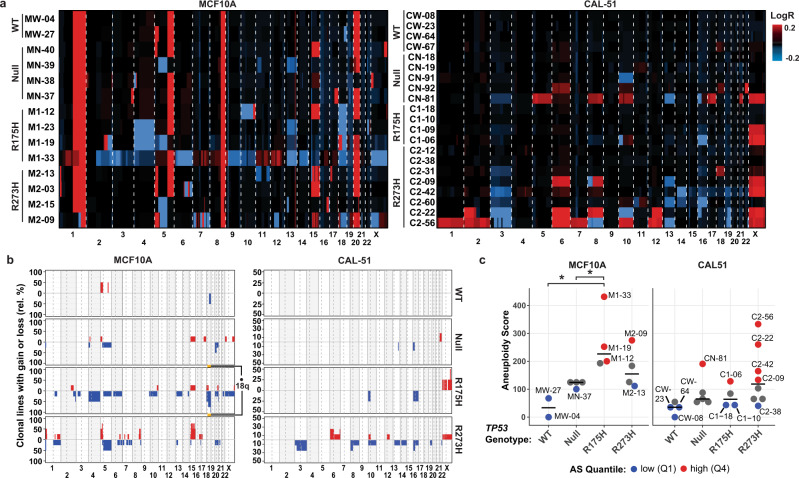
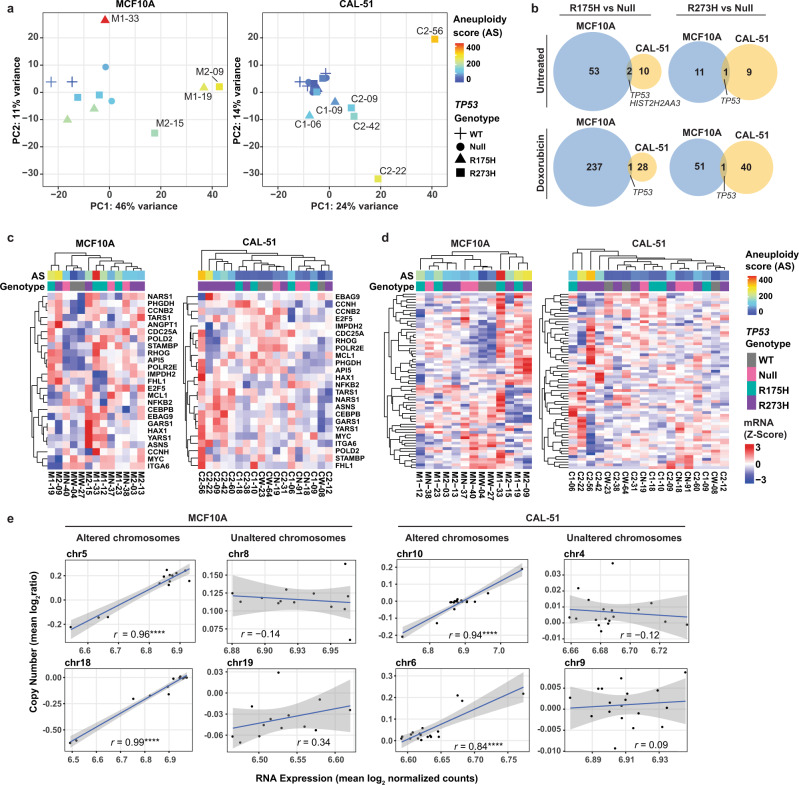
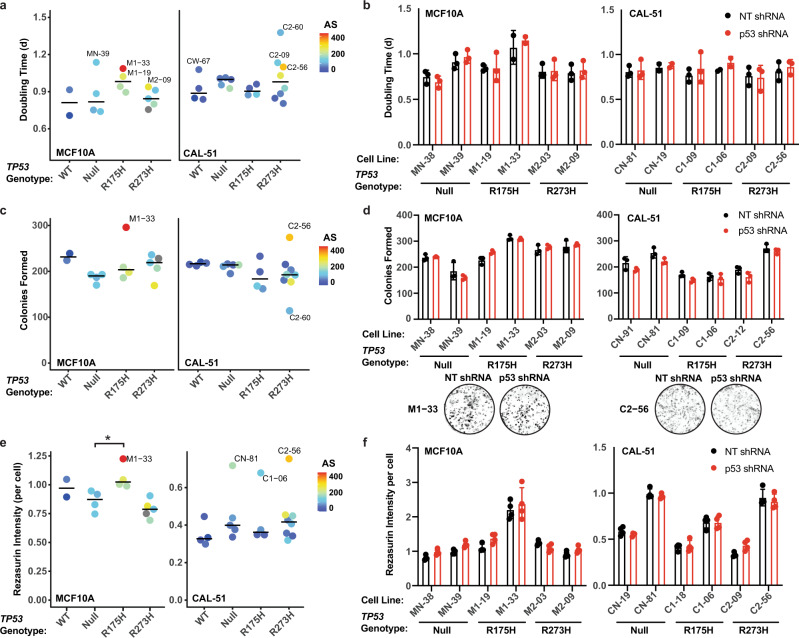
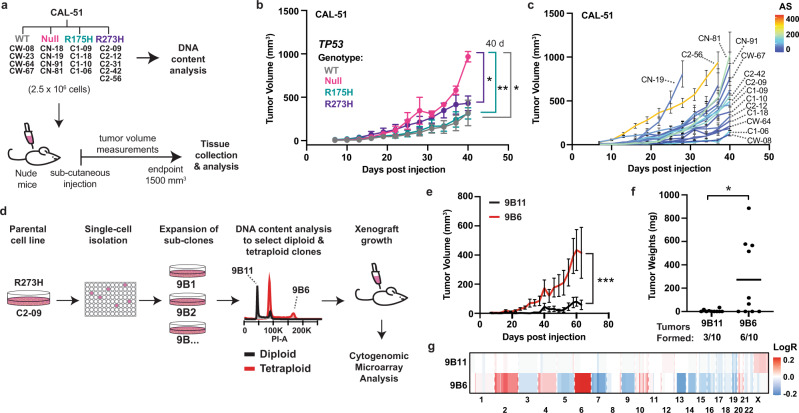
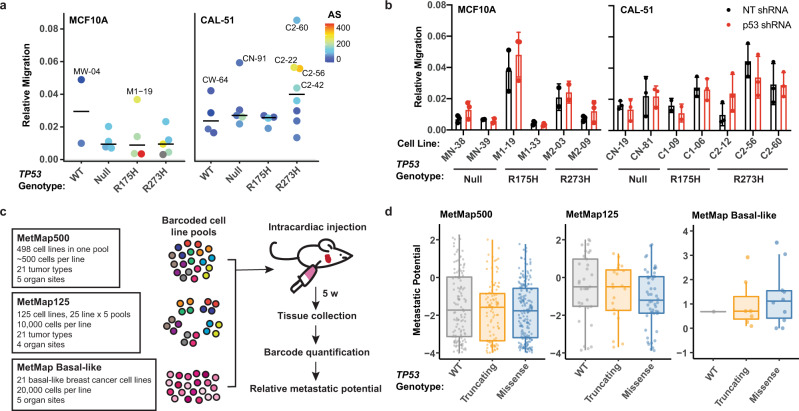
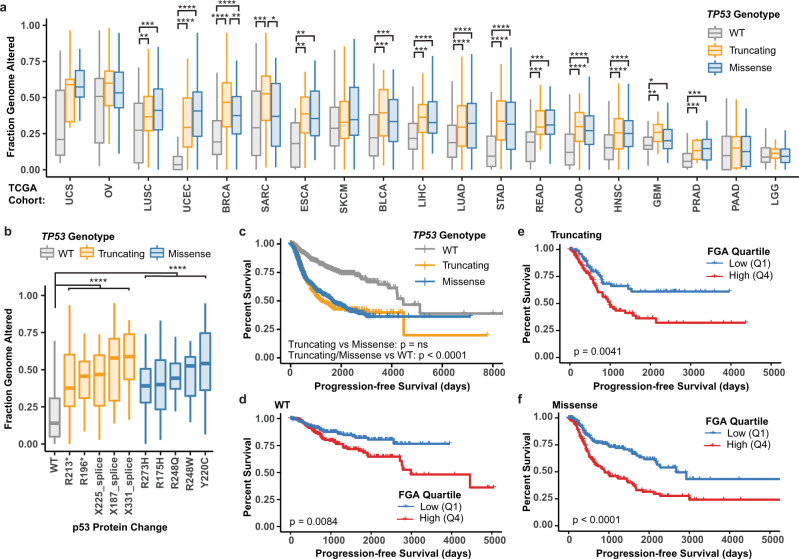
p53 is mutated in over half of human cancers. In addition to losing wild-type (WT) tumor-suppressive function, mutant p53 proteins are proposed to acquire gain-of-function (GOF) activity, leading to novel oncogenic phenotypes. To study mutant p53 GOF mechanisms and phenotypes, we genetically engineered non-transformed and tumor-derived WT p53 cell line models to express endogenous missense mutant p53 (R175H and R273H) or to be deficient for p53 protein (null). Characterization of the models, which initially differed only by TP53 genotype, revealed that aneuploidy frequently occurred in mutant p53-expressing cells. GOF phenotypes occurred clonally in vitro and in vivo, were independent of p53 alteration and correlated with increased aneuploidy. Further, analysis of outcome data revealed that individuals with aneuploid-high tumors displayed unfavorable prognoses, regardless of the TP53 genotype. Our results indicate that genetic variation resulting from aneuploidy accounts for the diversity of previously reported mutant p53 GOF phenotypes.


Conflict of interest statement

The authors declare no competing interests.

Figures

Fig. 1
Fig. 1. Generation and characterization of genetically engineered epithelial cell line models to study potential mutant p53 GOF activities.
a Fraction of the genome altered across pan-cancer (n = 958, left panel) and breast cancer cell lines (n = 53, right panel) from the Cancer Cell Line Encyclopedia, with (red) and without (black) TP53 alterations (mutation or deletion); including the nontransformed MCF10A cell line. b Experimental workflow for CRISPR-Cas9 genetic engineering of isogenic cell line models with TP53 missense (red) and synonymous (blue) mutations and the resulting isogenic cell lines that either did (R175H and R273H, +HDR) or did not undergo complete homology-directed repair (WT and Null, −HDR). HDR homology-directed repair. c Heatmap of normalized gene expression for the top 116 p53 target genes for all cell lines at passage five after clonal expansion. d GSEA plot showing negative enrichment of p53 target genes (Fischer Direct p53 Targets Meta Analysis geneset) from RNA-seq differential gene expression analyses between TP53 Null (pink), R175H (teal), and R273H (purple) clones compared to the MCF10A and CAL-51 WT cell lines. Pos positive, Neg negative, FDR false discovery rate. e Western blots of relative p53, MDM2, p21, and actin protein levels in the indicated cell lines after 6 h of doxorubicin treatment (dox, 0.2 µM). Western blots of additional cell lines are shown in Supplementary Fig. 1b, c. Blots are representative of two independent experiments. f IC50 values for Nutlin-3a in the MCF10A (n = 2 WT, 4 Null, 4 R175H, and 5 R273H) and CAL-51 (n = 4 WT, 5 Null, 4 R175H, and 8 R273H) cell lines after treatment for 72 h. Dots represent the mean IC50 per cell line calculated from at least two independent experiments and black lines indicate median IC50 per TP53 genotype. One-way ANOVA with Dunnett’s multiple comparison test, **P < 0.01, ***P < 0.001, ****P < 0.0001. Source data and exact P values are provided in the Source Data File.
Fig. 2
Fig. 2. p53 mutant isogenic cell lines display increased frequency of aneuploidy.
a Copy number alterations (Log2 ratios, LogR) in MCF10A (left) and CAL-51 (right) isogenic cell lines grouped by TP53 genotype. Chromosomal gain (red) and loss (blue). b Frequency plots of the proportion of clonal lines from each genotype containing the indicated chromosomal copy number gains (red) or losses (blue). Chromosomal alterations were calculated relative to the parental WT clone in the MCF10A (left) and CAL-51 (right) cell lines from a. Chromosome 18q in the R175H mutant MCF10A cells was the only region significantly altered; • adjusted P < 0.1, two-sided Student’s t-test comparing chromosome arms between TP53 genotypes. c Aneuploidy score (AS) in each MCF10A (left) and CAL-51 (right) cell line by TP53 genotype (MCF10A n = 2 WT, 4 Null, 4 R175H, and 4 R273H cell lines; CAL-51 n = 4 WT, 5 Null, 4 R175H, and 8 R273H cell lines). Colors indicate cell lines classified as aneuploid-low (lower quantile AS [Q1], blue), and aneuploid-high (upper quantile AS [Q4], red). Cell lines colored in gray indicate an intermediate AS (quantiles 2 and 3). *P < 0.05 (WT vs R175H, P = 0.011; Null vs R175H, P = 0.046), one-way ANOVA with Dunnett’s multiple comparison test. Source data are provided in the Source Data File.
Fig. 3
Fig. 3. Gene expression changes are associated with aneuploidy and not mutant p53 expression.
a Principal component (PC) analysis of gene expression values for untreated MCF10A (left panel) and CAL-51 (right panel) isogenic cell lines. b Venn diagrams showing the overlap between differentially expressed genes in R175H (left) and R273H (right) cell lines compared to null cells in MCF10A (blue) and CAL-51 (yellow) models. Cells were either untreated (top) or treated with doxorubicin (0.2 µM, 6 h) (bottom). Cell lines used in RNA-seq analyses are shown in Supplementary Fig. 5a. c Hierarchical clustering and comparison of gene expression for previously reported mutant p53-associated upregulated genes from the indicated MCF10A (left panel) and CAL-51 (right panel) cell lines. d Hierarchical clustering and comparison of gene expression for the karyotype heterogeneity associated HET70 gene signature from the indicated MCF10A (left panel) and CAL-51 (right panel) cell lines. e Scatter plots comparing average chromosomal copy number with chromosomal RNA expression for MCF10A (left panel, n = 13) and CAL-51 (right panel, n = 18) cell lines across frequently altered or unaltered chromosomes. Each point represents the mean per cell line. The blue line represents a linear model of the best fit, with the gray area representing the 95% confidence intervals. r = Pearson correlation coefficient, ****P < 0.0001, Pearson correlation. Source data are provided in the Source Data File.
Fig. 4
Fig. 4. Differences in proliferation, colony formation, and metabolism are associated with aneuploidy and not mutant p53 expression.
a Average doubling time in all MCF10A (left) and CAL-51 (right) clonal cell lines by TP53 genotype. b Doubling time in MCF10A (left) and CAL-51 (right) cell lines of the indicated TP53 genotype expressing either a nontargeting (NT, black) or p53 targeting shRNA (red). Mean ± standard deviation (s.d.) from n = 3 independent experiments per cell line (except M1-33, CN-19, and C1-06 cell lines, n = 2). c Average number of colonies formed in all MCF10A (left) and CAL-51 (right) cell lines by TP53 genotype. d Average number of colonies formed in MCF10A (left) and CAL-51 (right) cell lines of the indicated TP53 genotype expressing either a nontargeting (NT, black) or p53 targeting shRNA (red). Bottom, representative images. Mean ± s.d. of n = 3 technical replicates representative of at least two independent experiments per cell line. e Resazurin intensity per cell, in all MCF10A (left) and CAL-51 (right) cell lines by TP53 genotype. f Resazurin intensity per cell in MCF10A (left) and CAL-51 (right) nontargeting (NT, black) or p53 shRNA (red) containing cell lines. Mean ± s.d. of n = 4 technical replicates, representative of at least two independent experiments per cell line. a, c, e Dots represent the mean per cell line (MCF10A n = 2 WT, 4 Null, 4 R175H, and 5 R273H cell lines; CAL-51 n = 4 WT, 5 Null, 4 R175H, and 8 R273H cell lines) from at least two independent experiments. Bars indicate the median per genotype. Dots are colored by their calculated aneuploidy score (AS), and those colored in gray were not profiled in cytogenomic microarray experiments. One-way ANOVA with Dunnett’s multiple comparison test, *P < 0.026. b, d, f Significance tested using two-way analysis of variance with Sidak’s multiple comparisons test. Western blots showing knockdown of p53 are shown in Supplementary Fig. 7a, b. Source data are provided in the Source Data File.
Fig. 5
Fig. 5. Clonal differences in tumorigenicity are associated with aneuploidy and not mutant p53 expression.
a Diagram demonstrating workflow for CAL-51 xenograft tumor growth experiment. b, c Tumor volume (in cubic millimeters) of CAL-51 cell lines. Data shown represent the mean ± standard error of the mean (s.e.m.) tumor volume (n = 10 tumors per cell line) measured across CAL-51 cell lines indicated in a averaged by b TP53 genotype or c colored by aneuploidy score (AS). d Diagram demonstrating workflow for single-cell isolation and subcutaneous xenograft experiment of CAL-51 diploid (9B11) and tetraploid (9B6) R273H mutant p53 subclones. e, f Tumor volume (e) and tumor weights (f) for 9B11 and 9B6 subclone xenografts. Data shown represent the mean ± s.e.m. tumor volume measured every three days (n = 10 tumors per cell line). g Copy number alterations from cytogenomic microarray analyses in 9B11 and 9B6 subclones (Log2 ratios, LogR). Chromosomal gain (red) and loss (blue). Significance tested using b mixed-effects analysis with Dunnett’s multiple comparison test, e, f Two-tailed Student’s t-tests. *P < 0.05, **P < 0.01, ***P < 0.001. Source data and exact P values are provided in the Source Data File.
Fig. 6
Fig. 6. Metastatic phenotypes are associated with aneuploidy and not mutant p53 expression.
a Quantification of the relative migration (mean cells per field from three technical replicates normalized to the number of cells seeded, arbitrary units) of MCF10A (left) and CAL-51 (right) cells that crossed the membrane in transwell assays. Each dot represents the mean relative migration for each cell line (MCF10A n = 2 WT, 4 Null, 4 R175H, and 5 R273H cell lines; CAL-51 n = 4 WT, 5 Null, 4 R175H, and 8 R273H cell lines) from at least two independent experiments. Bars represent the median value per TP53 genotypes. Dots are colored by aneuploidy score, and those colored in gray were not profiled in cytogenomic microarray experiments. b Quantification of relative migration, as described above, in MCF10A (left) and CAL-51 (right) cells containing nontargeting (NT, black) or p53 shRNAs (red). Mean ± s.d. from n = 3 independent experiments (except MN-39, M2-03, and C1-09 cell lines, n = 2). Western blots showing knockdown of p53 are shown in Supplementary Fig. 7b, c. c Diagram demonstrating workflow for metastatic datasets generated in the MetMap project. d Box and whisker plots of the metastatic potential in cells with wild-type (WT), missense or truncating mutations in TP53 in the MetMap500 (left; WT n = 129, Truncating N = 101, Missense N = 195), MetMap125 (middle; WT n = 33, Truncating N = 20, Missense N = 50) and MetMap Basal-like (right; WT n = 1, Truncating N = 7, Missense N = 10) datasets. Points represent mean metastatic potential across all sites. Boxplot elements: center line, median; box limits, upper and lower quartiles; whiskers, 1.5× interquartile range. Significance tested using a one-way analysis of variance (ANOVA) with Dunnett’s multiple comparisons test, d two-way ANOVA with Sidak’s multiple comparisons test, and c one-way ANOVA with Tukey’s multiple comparison test. Source data are provided in the Source Data File.
Fig. 7
Fig. 7. Aneuploidy and loss of p53 function associate with unfavorable prognosis.
a, b Box and whisker plots of the fraction of the genome altered (FGA) in tumors with wild-type (WT), missense or truncating mutations in TP53 compared a across cancer types (source: The Cancer Genome Atlas [TCGA]), or b in BRCA, OV, UCEC, UCS, and LUSC cancer types across the five most frequent truncating or missense mutations. Cohort acronyms, values for n, and exact P values can be found in Supplementary Table 3 or the Source Data file. Pairwise two-sided Wilcoxon test with Benjamini–Hochberg P-value correction, *P < 0.05, **P < 0.01, ***P < 0.001, ****P < 0.0001. Boxplot elements: center line, median; box limits, upper and lower quartiles; whiskers, 1.5× interquartile range. cf Kaplan–Meier curves showing progression-free survival of individuals with BRCA, OV, UCEC, UCS, and LUSC separated by TP53 genotype (c) or further divided into aneuploid-low (blue, lower quantile FGA, Q1) or aneuploid-high (red, upper quantile FGA, Q4) groups in individuals with tumors containing WT (d), truncating (e), or missense (f) mutant TP53. Log-rank tests. Source data are provided in the Source Data File.

References

    1. Kastenhuber ER, Lowe SW. Putting p53 in context. Cell. 2017;170:1062–1078. doi: 10.1016/j.cell.2017.08.028. - DOI - PMC - PubMed
    1. Cho Y, Gorina S, Jeffrey PD, Pavletich NP. Crystal structure of a p53 tumor suppressor-DNA complex: understanding tumorigenic mutations. Science. 1994;265:346–355. doi: 10.1126/science.8023157. - DOI - PubMed
    1. Kern SE, et al. Oncogenic forms of p53 inhibit p53-regulated gene expression. Science. 1992;256:827–830. doi: 10.1126/science.1589764. - DOI - PubMed
    1. Dittmer D, et al. Gain of function mutations in p53. Nat. Genet. 1993;4:42–46. doi: 10.1038/ng0593-42. - DOI - PubMed
    1. Muller PAJ, Vousden KH. Mutant p53 in cancer: new functions and therapeutic opportunities. Cancer Cell. 2014;25:304–317. doi: 10.1016/j.ccr.2014.01.021. - DOI - PMC - PubMed

Publication types