. 2021 Aug 31;12(1):5186.
doi: 10.1038/s41467-021-25536-0.

Paleocene/Eocene carbon feedbacks triggered by volcanic activity

Affiliations

Paleocene/Eocene carbon feedbacks triggered by volcanic activity

Sev Kender et al. Nat Commun. .

Abstract

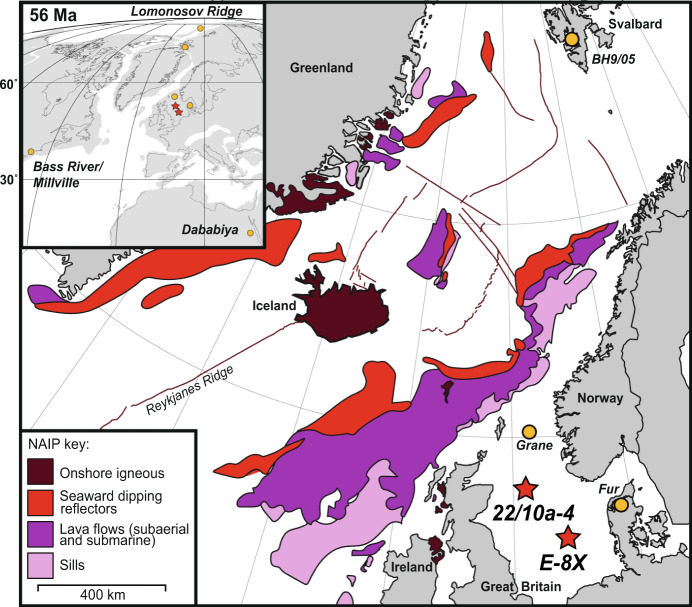
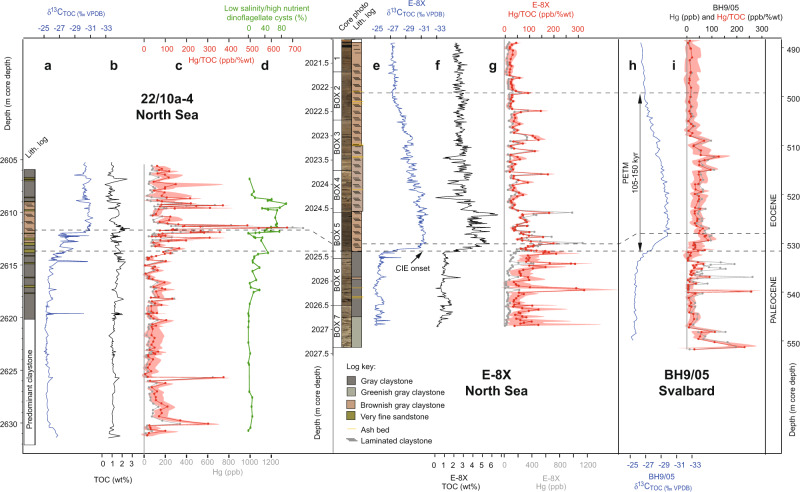
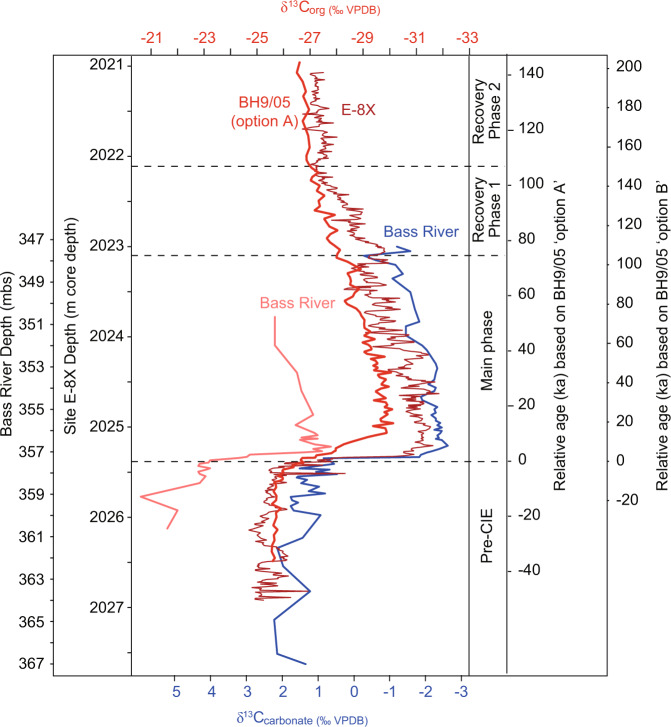
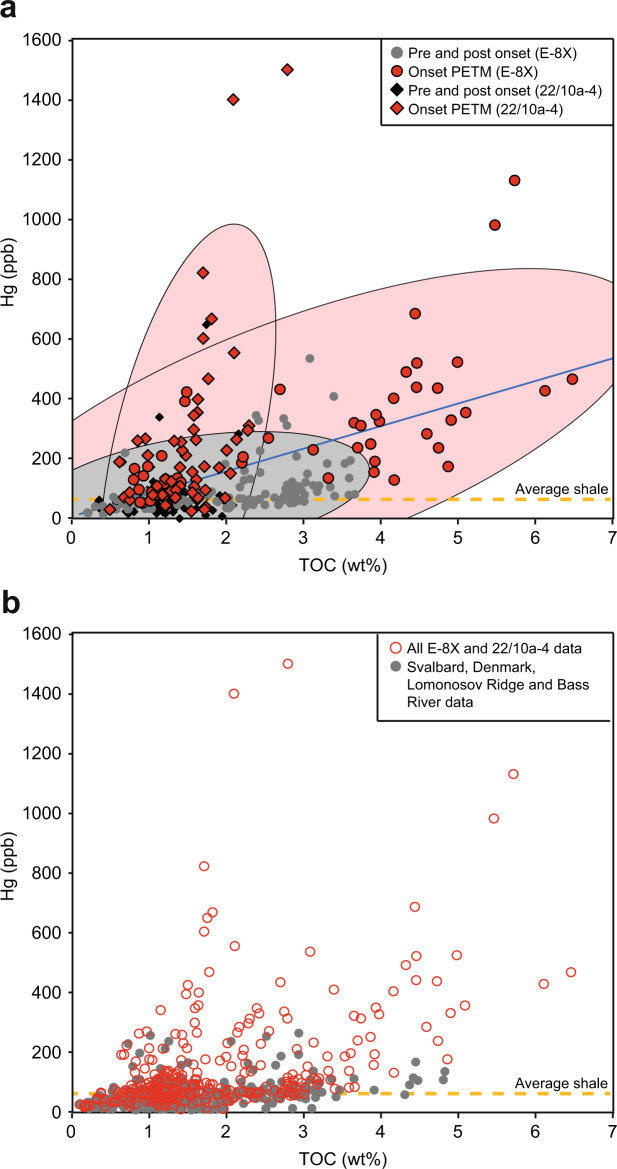
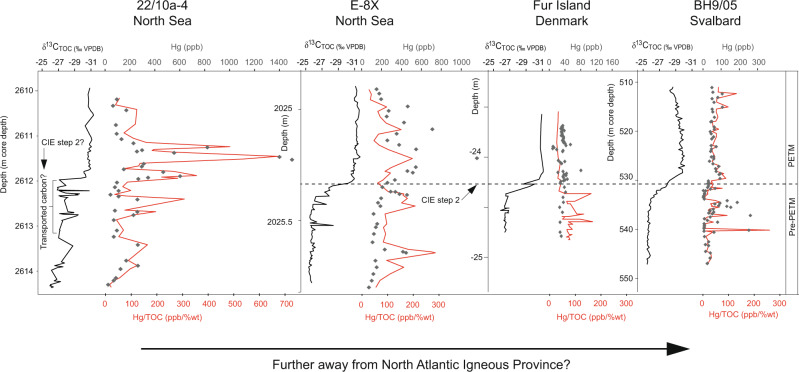
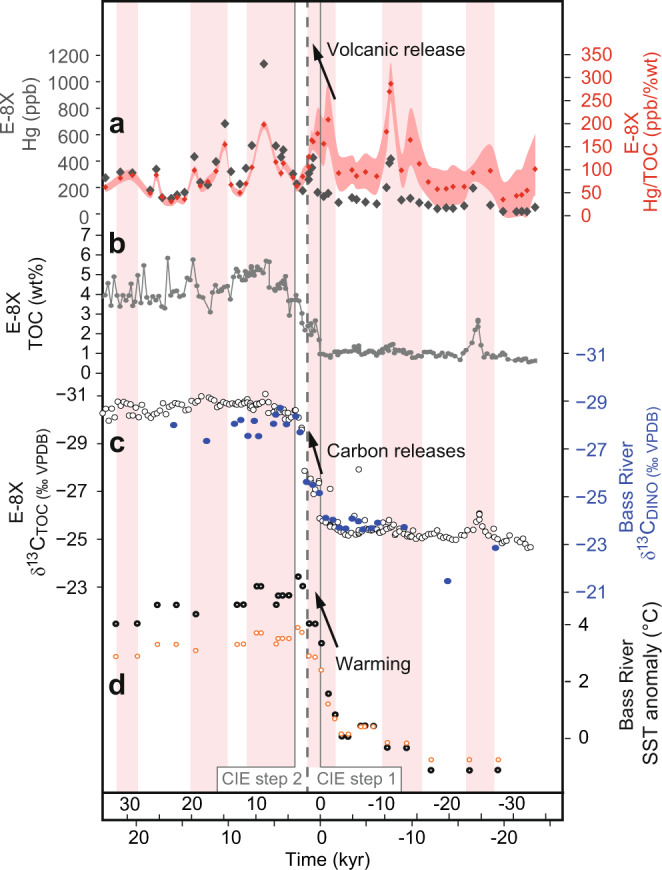
The Paleocene-Eocene Thermal Maximum (PETM) was a period of geologically-rapid carbon release and global warming ~56 million years ago. Although modelling, outcrop and proxy records suggest volcanic carbon release occurred, it has not yet been possible to identify the PETM trigger, or if multiple reservoirs of carbon were involved. Here we report elevated levels of mercury relative to organic carbon-a proxy for volcanism-directly preceding and within the early PETM from two North Sea sedimentary cores, signifying pulsed volcanism from the North Atlantic Igneous Province likely provided the trigger and subsequently sustained elevated CO2. However, the PETM onset coincides with a mercury low, suggesting at least one other carbon reservoir released significant greenhouse gases in response to initial warming. Our results support the existence of 'tipping points' in the Earth system, which can trigger release of additional carbon reservoirs and drive Earth's climate into a hotter state.


Conflict of interest statement

The authors declare no competing interests.

Figures

Fig. 1
Fig. 1. Location maps of the North Atlantic Igneous Province (NAIP) and sediment cores sites analysed in this study.
The simplified NAIP main map shows the estimated ranges of its various components. ‘Seaward dipping reflectors’ are well-defined seismic reflectors beneath the uppermost basalt, interpreted as large subaerial sheet lava flows associated with rifting. Other lava flows are thought to be a combination of subaerial and submarine, and sills were considered as intruded into the upper crust,,. The insert map is a Mollweid projection of modern continents (lines) on a palaeogeographic reconstruction, generated from (ref. ), of continental plates (grey) centred at 56 Ma.
Fig. 2
Fig. 2. Geochemical proxy records from the North Sea and Svalbard cores, showing volcanic and sedimentological changes associated with the Paleocene–Eocene Thermal Maximum (PETM).
Records are shown against depth in m core depth (below oil rig floor ‘Kelly bushing’ for 22/10a-4 and E-8X). ad Well site 22/10a-4 (North Sea). eg Well site E−8X (North Sea). hi Core BH9/05 (Svalbard). Bulk sediment total organic carbon δ13CTOC is reported as ‰ VPDB, Vienna PeeDee Belemnite. Total organic carbon (TOC) is reported as % of the bulk weight. Hg is reported as parts per billion (ppb). Hg/TOC envelope reflects an analytical error, illustrating higher uncertainty in samples with lower TOC. The 22/10a-4 lithological (lith.) log, δ13CTOC, and TOC from are from (ref. ). The BH9/05 δ13CTOC and age model are from (ref. ), and Hg data are from (ref. ). The position of the Paleocene/Eocene boundary, defined as the onset of the PETM, is shown as a horizontal dashed line.
Fig. 3
Fig. 3. Carbon isotope correlation of two sites with Svalbard core BH9/05.
The δ13C of both organic carbon (δ13Corg) and inorganic carbonate (δ13Ccarbonate) from North Sea well site E−8X (this study) and Bass River, are correlated to Svalbard core BH9/05 (ref. ) based on the overall shape of the records, with particular emphasis on the carbon isotope excursion (CIE) inflection points during the rapid onset and gradual recovery phases. The relative age model is based on two proposed solutions for cyclostratigraphy of core BH9/05 (ref. ). Bass River core depth in metres below the surface (mbs).
Fig. 4
Fig. 4. Sedimentary Hg (ppb) against TOC (wt%) for well sites E−8X and 22/10a−4 and other published records.
a Line is the linear regression of E−8X and 22/10a−4 datasets combined (R2 = 0.22). Samples immediately before, during and after the Paleocene–Eocene Thermal Maximum (PETM) onset are indicated as red symbols (~2024.6–2026 m for E−8X; ~2608–2615 m for 22/10a−4), and outside of that area with grey symbols. Shaded 95% ellipses show the changing relationship between Hg and TOC over the studied interval, with many samples within the PETM onset (red symbols) exhibiting excess Hg with a steeper gradient to TOC than samples outside of this interval (grey symbols). Well site 22/10a−4 appears to have experienced greater excess Hg than E−8X, possibly as it was closer to the North Atlantic Igneous Province source. The dashed line shows the value of the average Phanerozoic bulk shale. b All data from E−8X and 22/10a−4 (red symbols) plotted with data from Svalbard BH9/05, Denmark Fur formation, Lomonosov Ridge and Bass River (grey symbols).
Fig. 5
Fig. 5. Summary of Hg and Hg/total organic carbon (TOC) data from various sites at the onset of the PETM.
North Sea well sites 22/10a−4 and E−8X (this study) generally display higher values than Fur and Svalbard. Carbon isotope excursion (CIE) step 2 is shown as a dashed line and does not co-occur with a Hg or Hg/TOC spike in the sections. Core 22/10a−4 has previously been interpreted to have been partially impacted by transported carbon. Bulk sediment δ13CTOC is reported as ‰ VPDB, Vienna PeeDee Belemnite.
Fig. 6
Fig. 6. Proxies for volcanism, carbon release and temperature in the time domain; thousands of years from the start of the PETM carbon isotope excursion (CIE).
a Sedimentary mercury (Hg) and Hg/total organic carbon (Hg/TOC) for core E−8X (this study). Hg/TOC envelope reflects an analytical error, illustrating higher uncertainty in samples with lower TOC. b Sedimentary TOC weight (wt) % for core E−8X (this study). c Sediment proxy records for TOC isotopes (δ13CTOC) at E−8X (this study), and carbon isotopes of sedimentary organic-walled dinoflagellate cysts (δ13CDINO) from Bass River, New Jersey, used to correlate the two sites (Fig. 3). d Sea surface temperature (SST) anomaly proxy data from Bass River, New Jersey. The same data are presented with two different calibrations for temperature in orange and black.

References

    1. Zeebe RE, Lourens LJ. Solar system chaos and the Paleocene–Eocene boundary age constrained by geology and astronomy. Science. 2019;365:926–929. doi: 10.1126/science.aax0612. - DOI - PubMed
    1. Bowen GJ, et al. Two massive releases of carbon during the onset of the Palaeocene–Eocene thermal maximum. Nat. Geosci. 2014;8:44–47. doi: 10.1038/ngeo2316. - DOI
    1. DeConto R, et al. Past extreme warming events linked to massive carbon release from thawing permafrost. Nature. 2012;484:87–92. doi: 10.1038/nature10929. - DOI - PubMed
    1. Frieling J, et al. Thermogenic methane release as a cause for the long duration of the PETM. Proc. Natl Acad. Sci. USA. 2016;113:12059–12064. doi: 10.1073/pnas.1603348113. - DOI - PMC - PubMed
    1. Gutjahr M, et al. Very large release of mostly volcanic carbon during the Palaeocene–Eocene thermal maximum. Nature. 2017;548:573–577. doi: 10.1038/nature23646. - DOI - PMC - PubMed

Publication types