

Biochar and urease inhibitor mitigate NH3 and N2O emissions and improve wheat yield in a urea fertilized alkaline soil
- PMID: 34465833
- PMCID: PMC8408238
- DOI: 10.1038/s41598-021-96771-0
Biochar and urease inhibitor mitigate NH3 and N2O emissions and improve wheat yield in a urea fertilized alkaline soil
Abstract
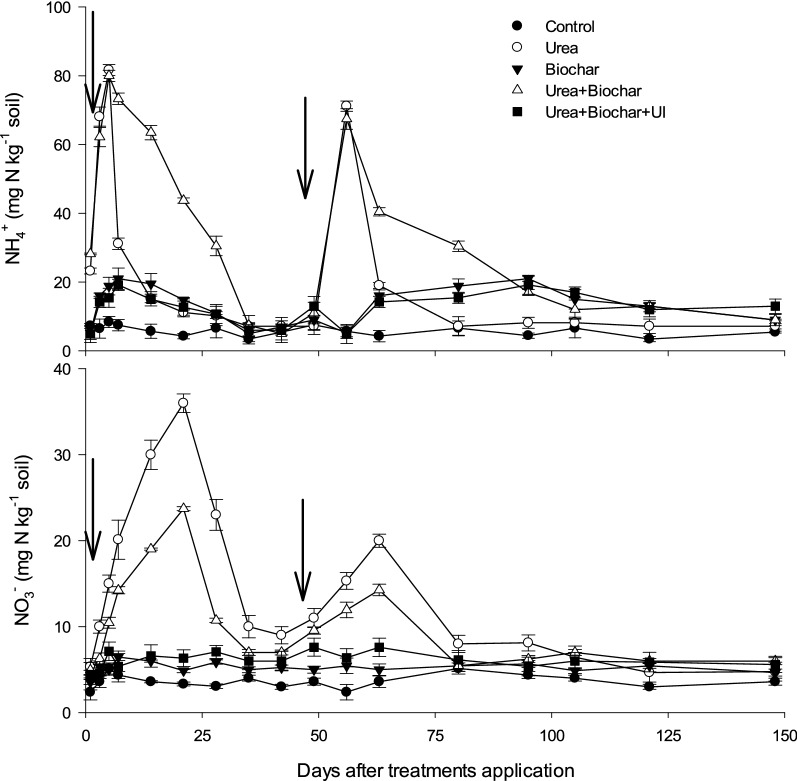
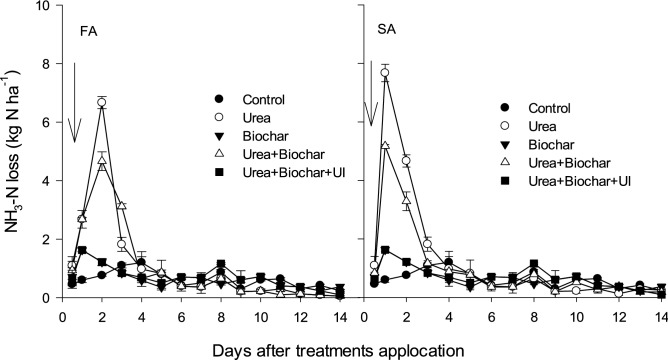
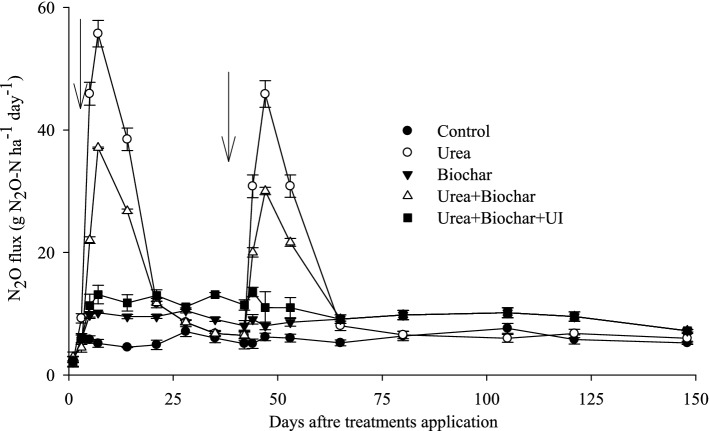
In this study, we explored the role of biochar (BC) and/or urease inhibitor (UI) in mitigating ammonia (NH3) and nitrous oxide (N2O) discharge from urea fertilized wheat cultivated fields in Pakistan (34.01°N, 71.71°E). The experiment included five treatments [control, urea (150 kg N ha-1), BC (10 Mg ha-1), urea + BC and urea + BC + UI (1 L ton-1)], which were all repeated four times and were carried out in a randomized complete block design. Urea supplementation along with BC and BC + UI reduced soil NH3 emissions by 27% and 69%, respectively, compared to sole urea application. Nitrous oxide emissions from urea fertilized plots were also reduced by 24% and 53% applying BC and BC + UI, respectively, compared to urea alone. Application of BC with urea improved the grain yield, shoot biomass, and total N uptake of wheat by 13%, 24%, and 12%, respectively, compared to urea alone. Moreover, UI further promoted biomass and grain yield, and N assimilation in wheat by 38%, 22% and 27%, respectively, over sole urea application. In conclusion, application of BC and/or UI can mitigate NH3 and N2O emissions from urea fertilized soil, improve N use efficiency (NUE) and overall crop productivity.
© 2021. The Author(s).
Conflict of interest statement
The authors declare no competing interests.
Figures
References
-
- Battaglia ML, Lee C, Thomason W. Corn yield components and yield responses to defoliation at different row widths. Agron. J. 2018;110:210–225. doi: 10.2134/agronj2017.06.0322. - DOI
-
- Kumar P, et al. Impacts of nitrogen fertilization rate and landscape position on select soil properties in switchgrass field at four sites in the USA. CATENA. 2019;180:183–193. doi: 10.1016/j.catena.2019.04.028. - DOI
-
- Diatta AA, et al. Assessment of nitrogen fixation by mungbean genotypes in different soil textures using 15N natural abundance method. J. Soil Sci. Plant Nutr. 2020 doi: 10.1007/s42729-020-00290-2. - DOI
-
- Müller C, Laughlin RJ, Spott O, Rütting T. Quantification of N2O emission pathways via a 15N tracing model. Soil Biol. Biochem. 2014;72:44–54. doi: 10.1016/j.soilbio.2014.01.013. - DOI
LinkOut - more resources
Full Text Sources
Research Materials
