Observational Study
. 2021 Oct;6(10):1245-1258.
doi: 10.1038/s41564-021-00961-5. Epub 2021 Aug 31.

Microbial signatures in the lower airways of mechanically ventilated COVID-19 patients associated with poor clinical outcome

Affiliations
Observational Study

Microbial signatures in the lower airways of mechanically ventilated COVID-19 patients associated with poor clinical outcome

Imran Sulaiman et al. Nat Microbiol. 2021 Oct.

Abstract

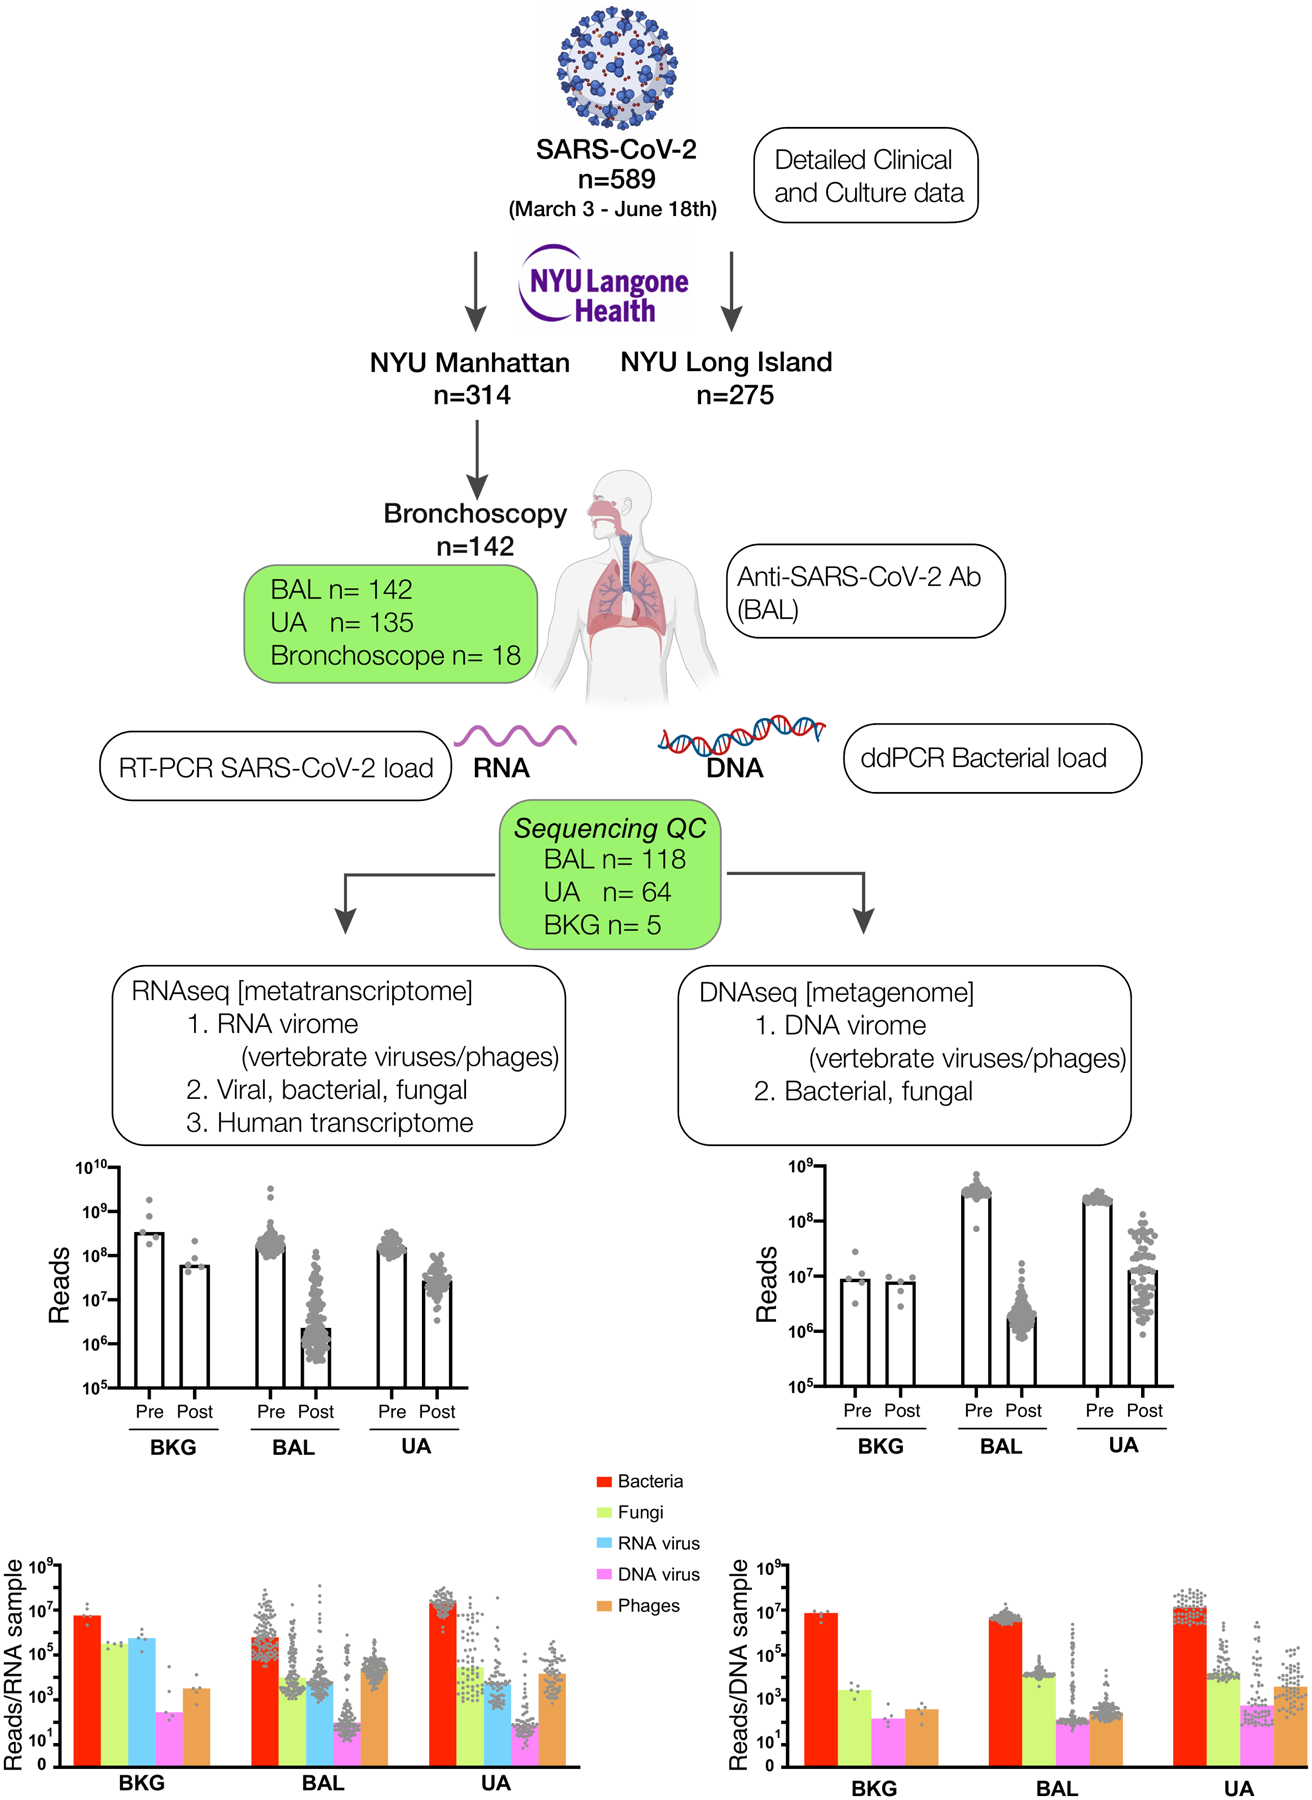
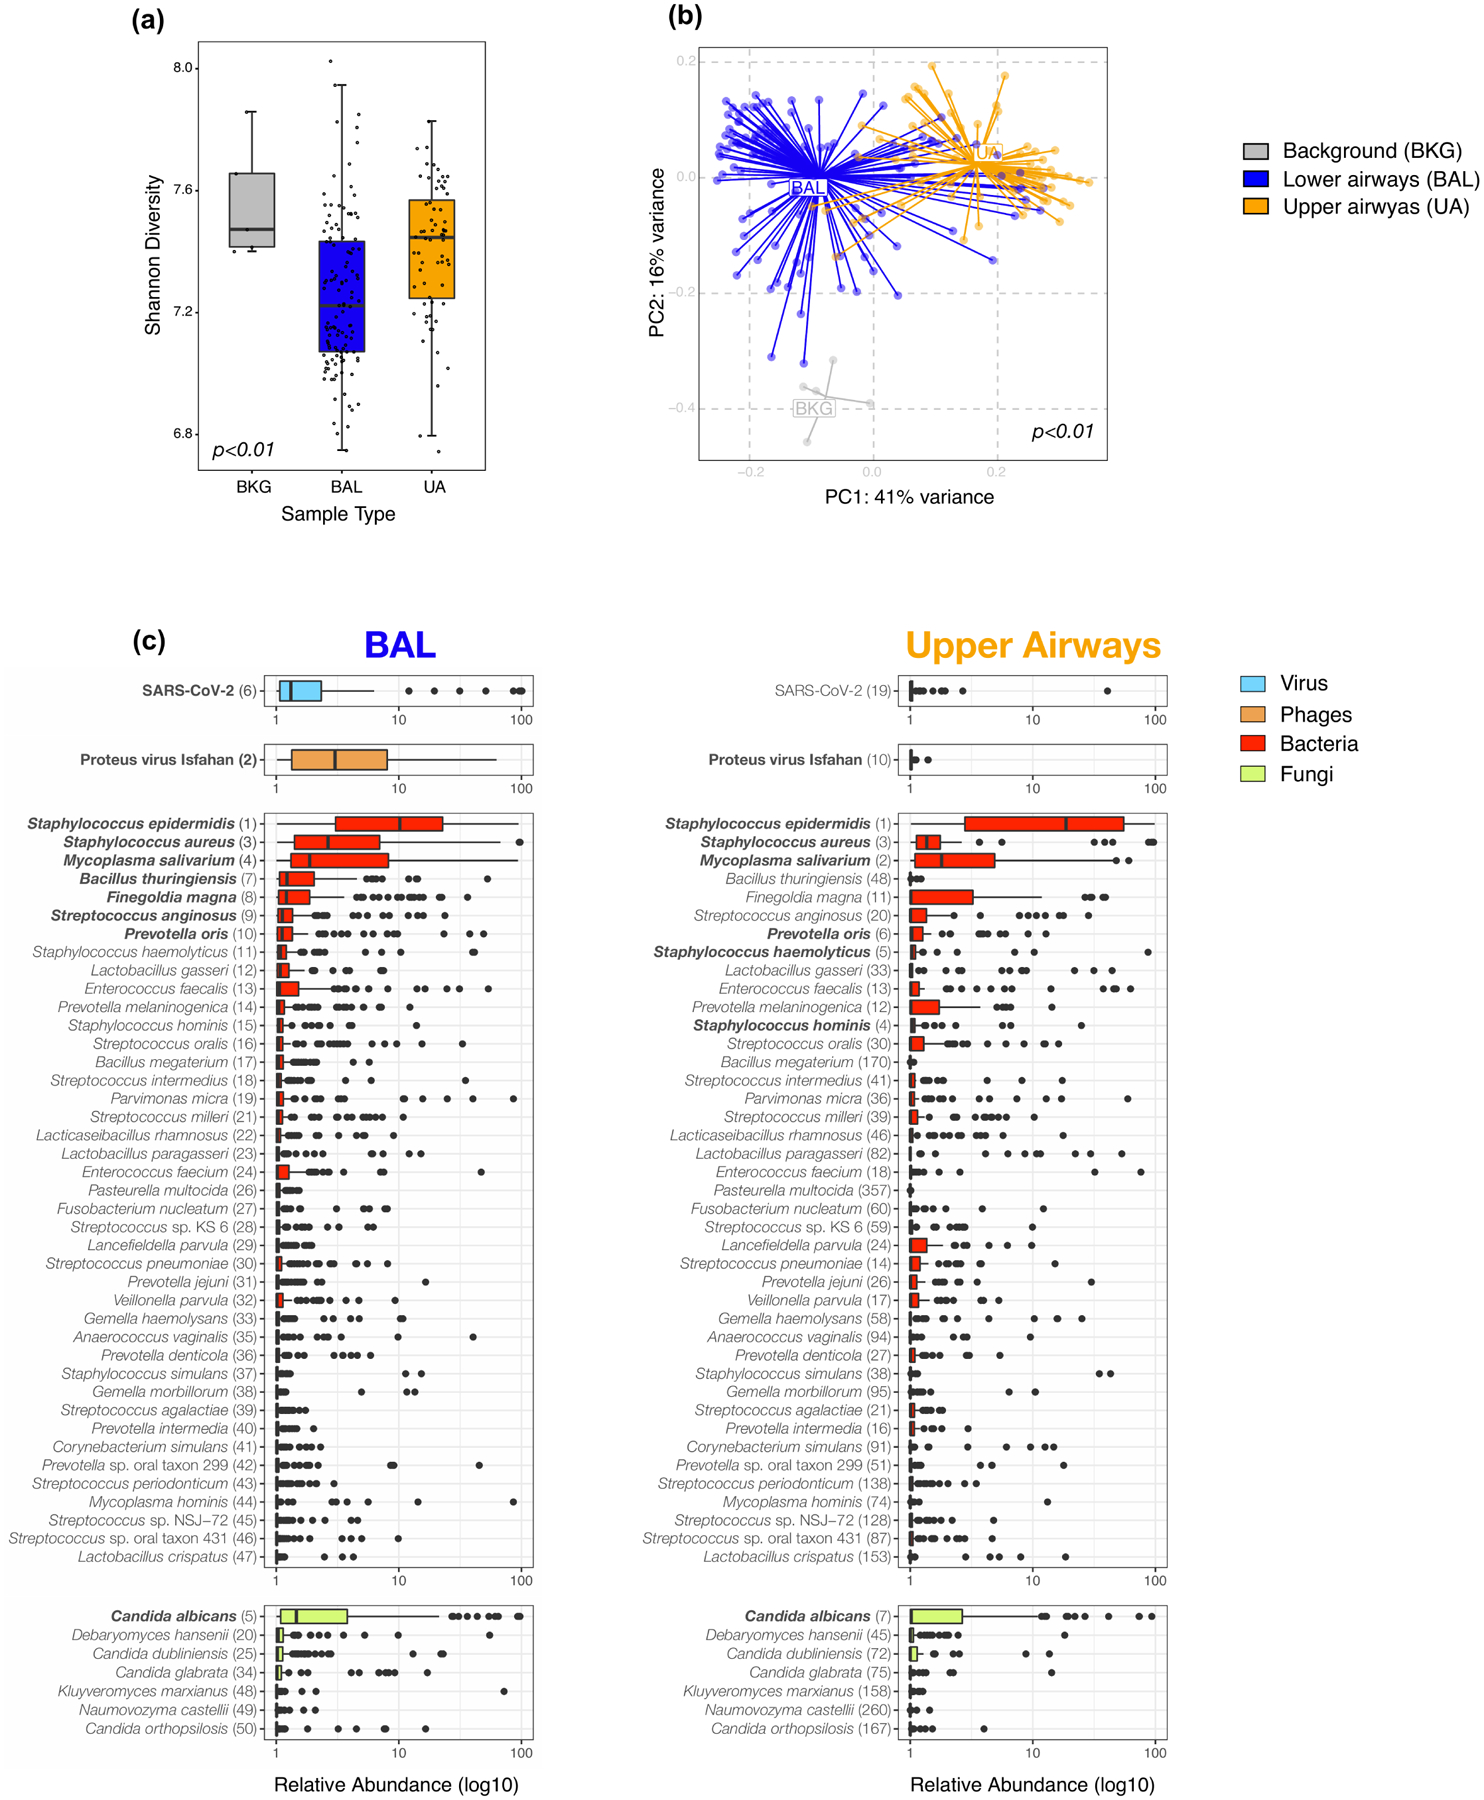
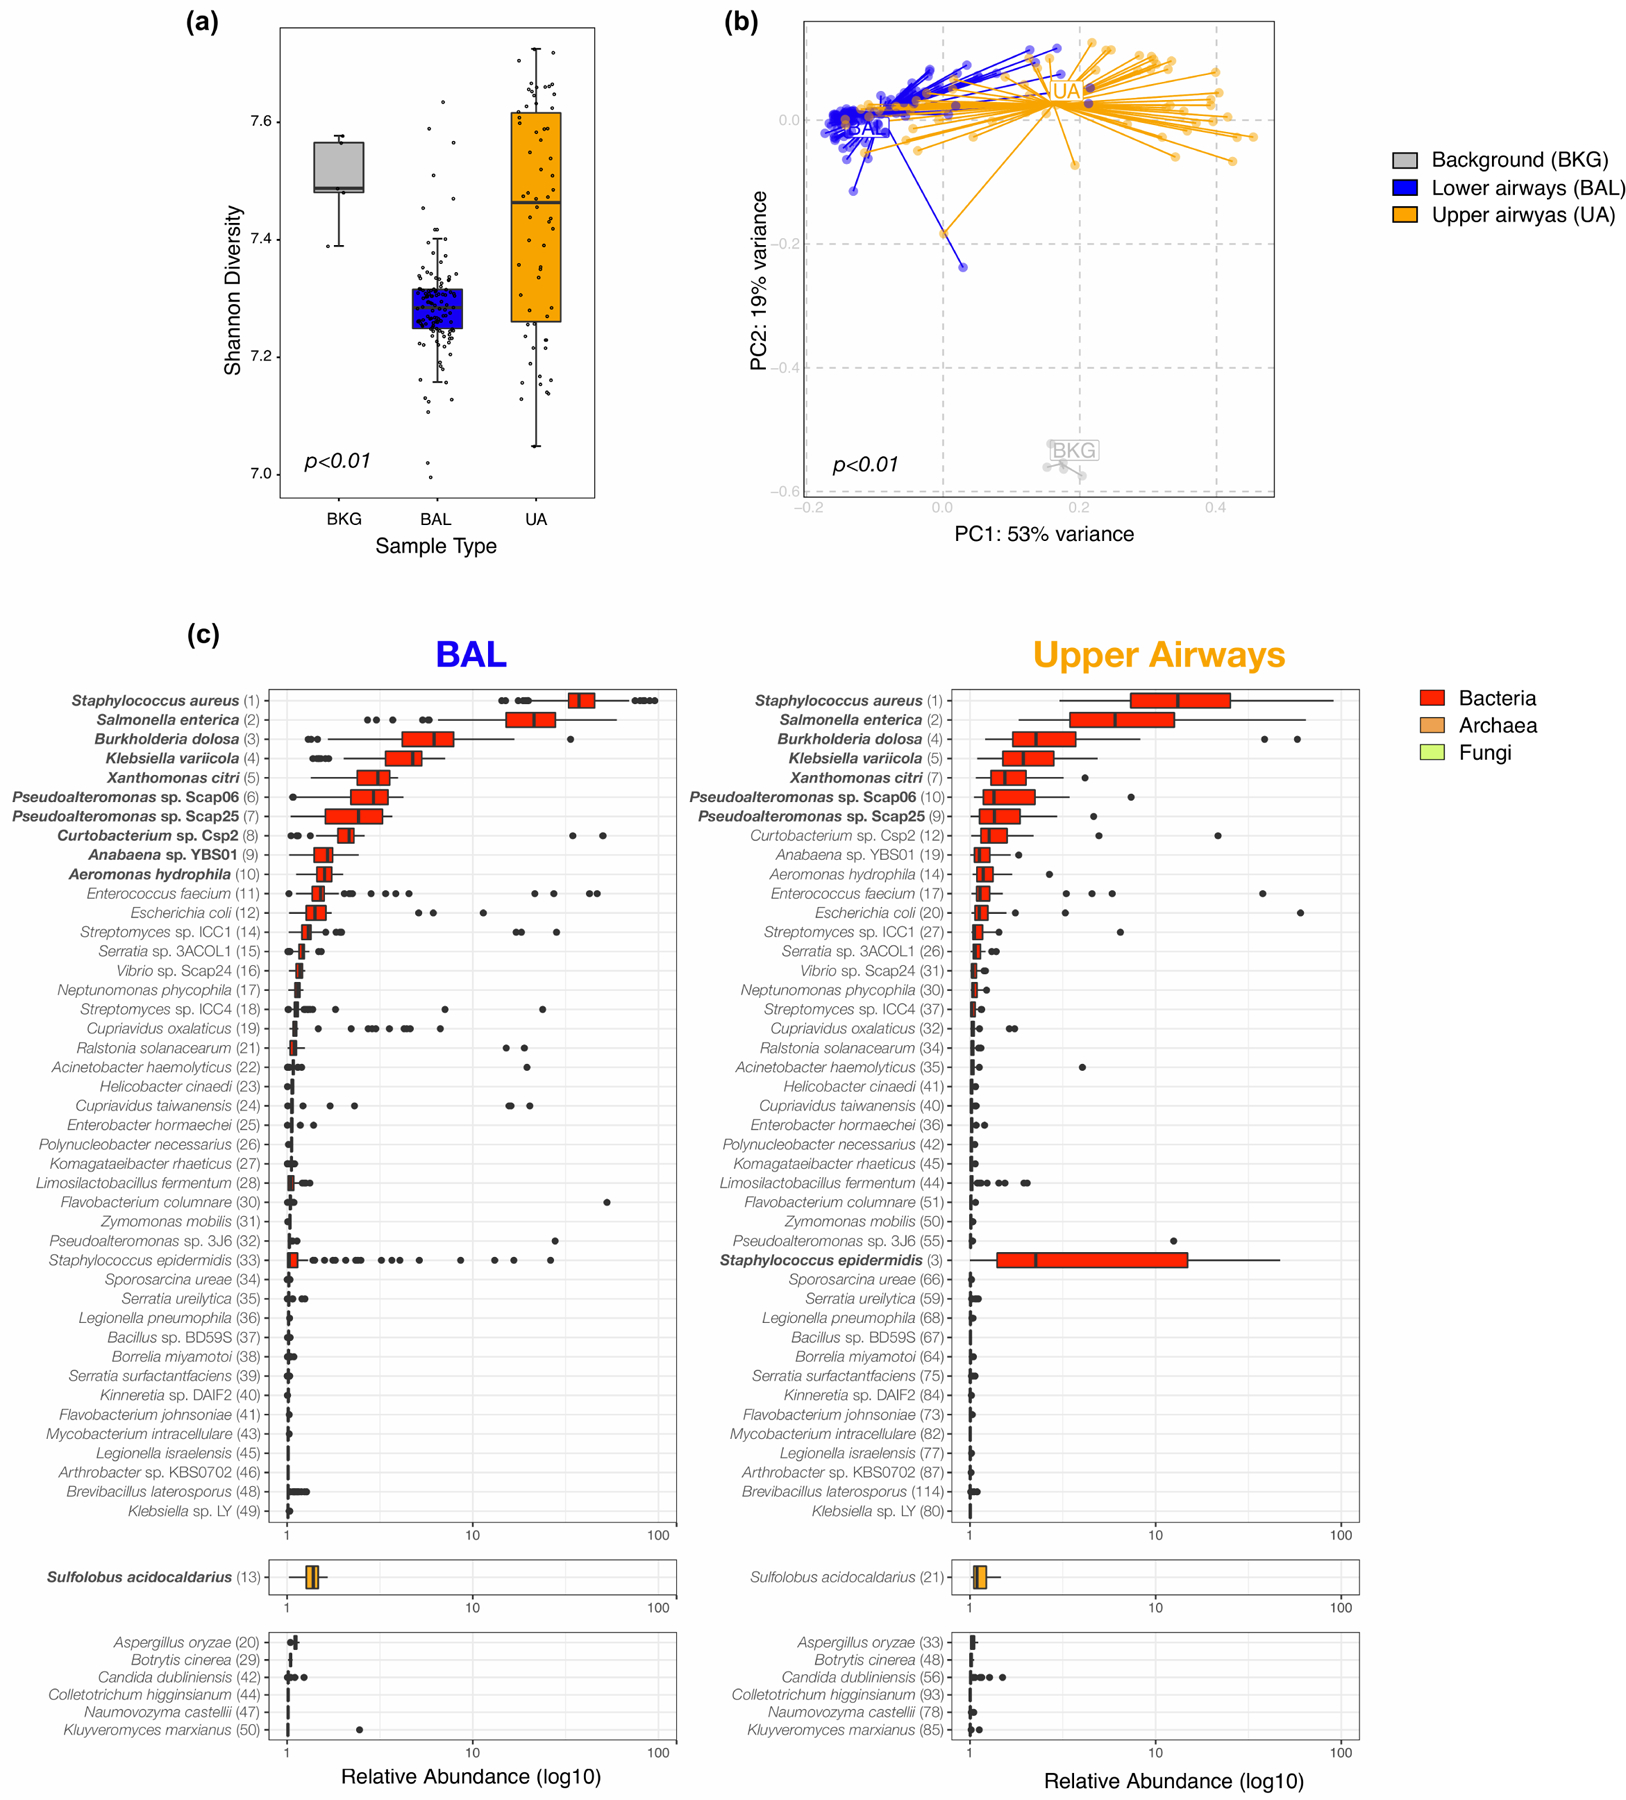
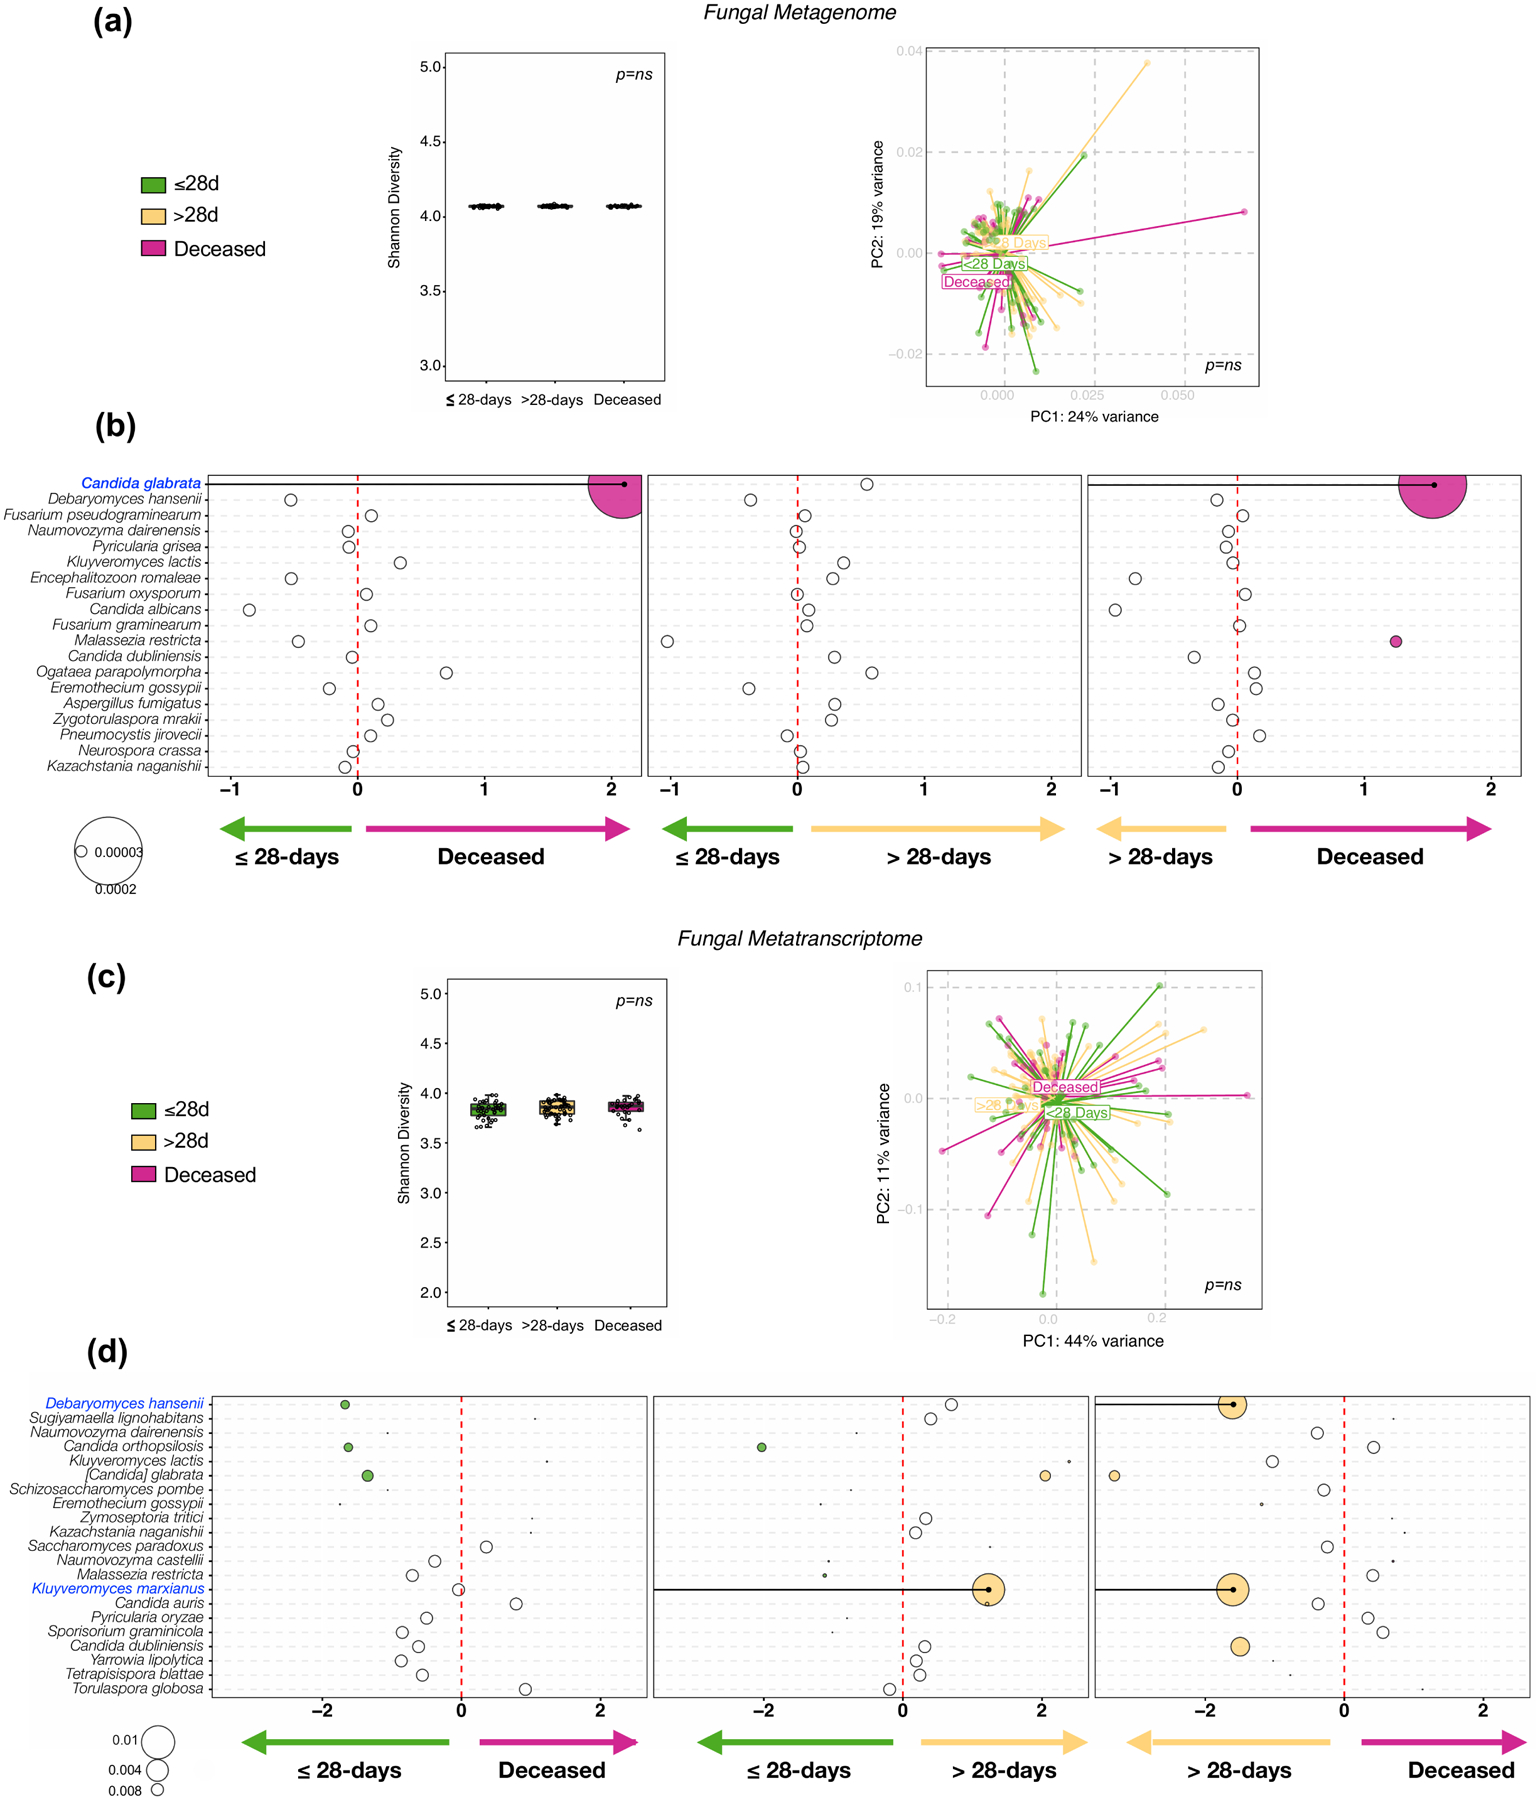
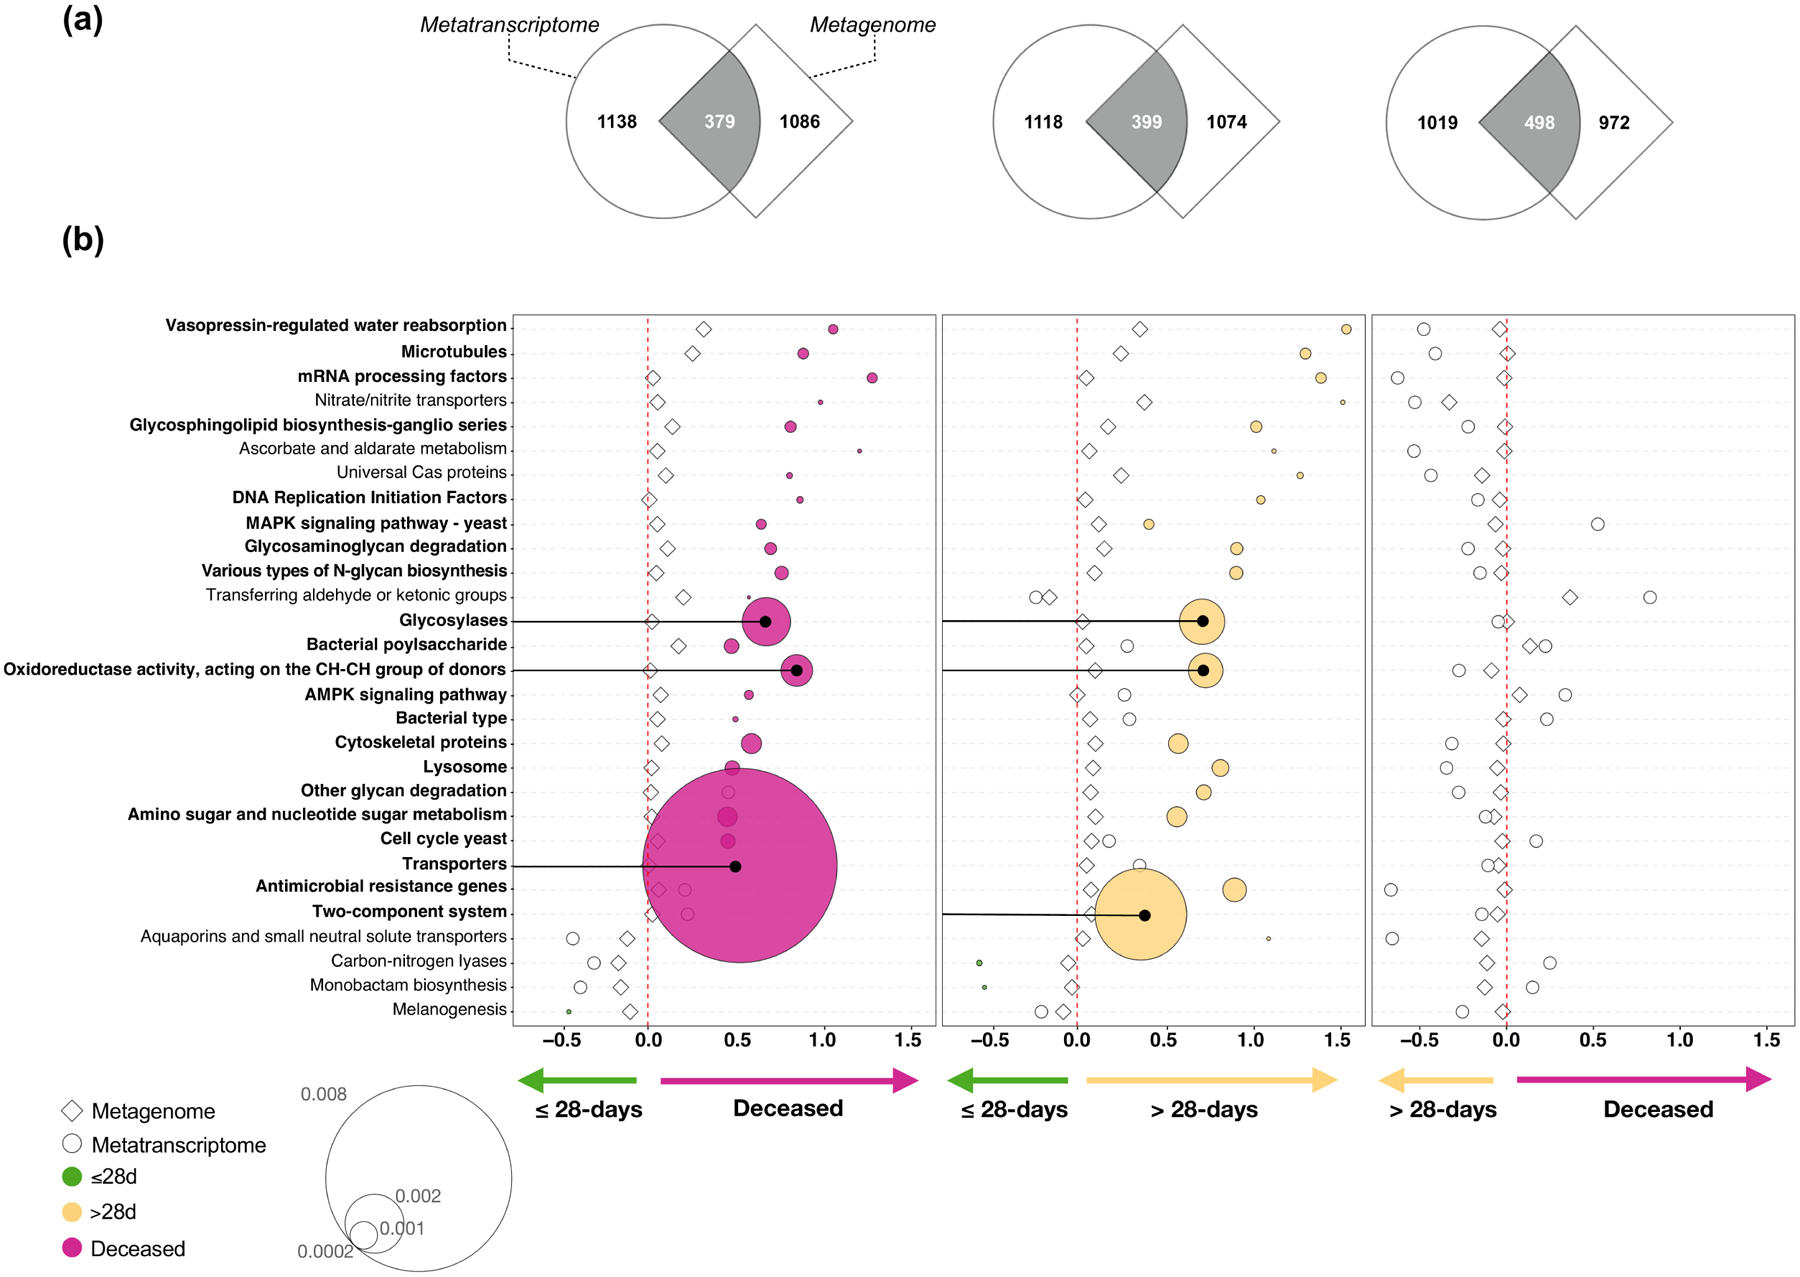
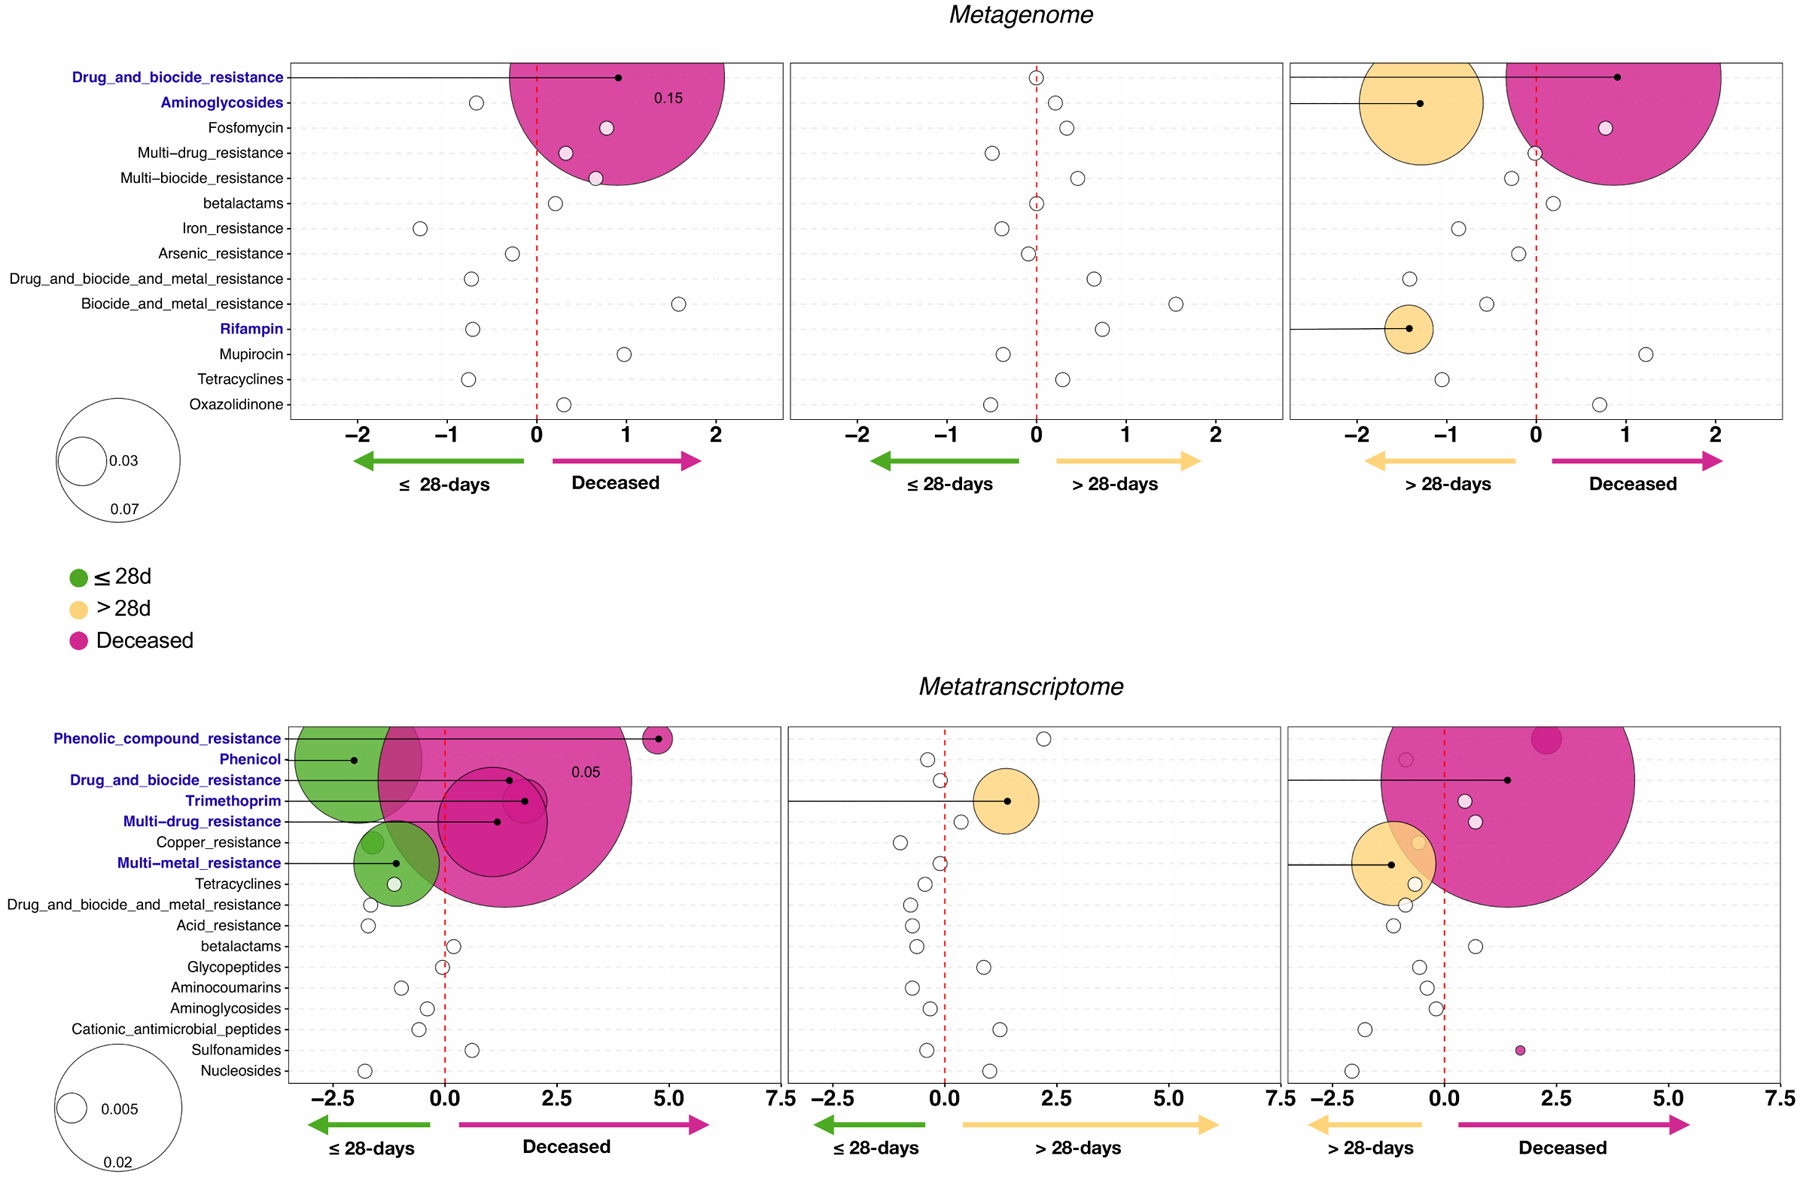
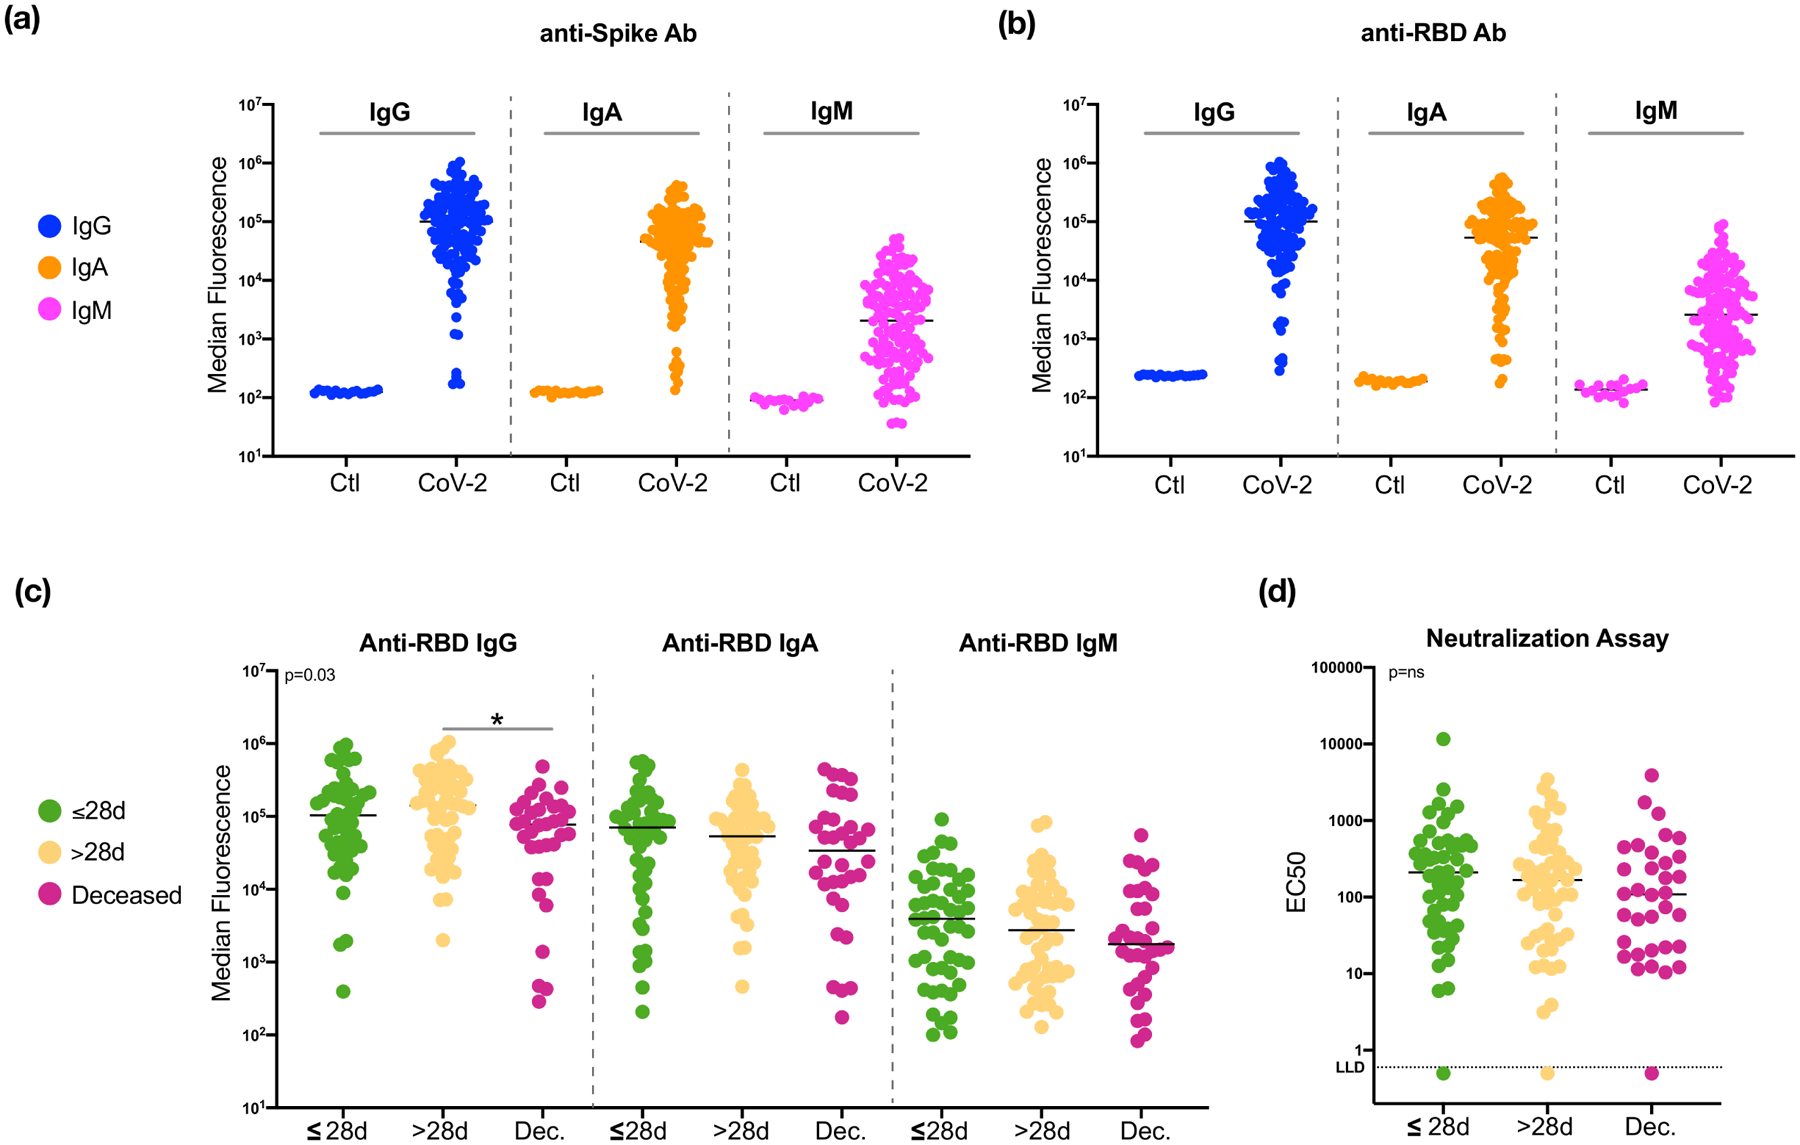
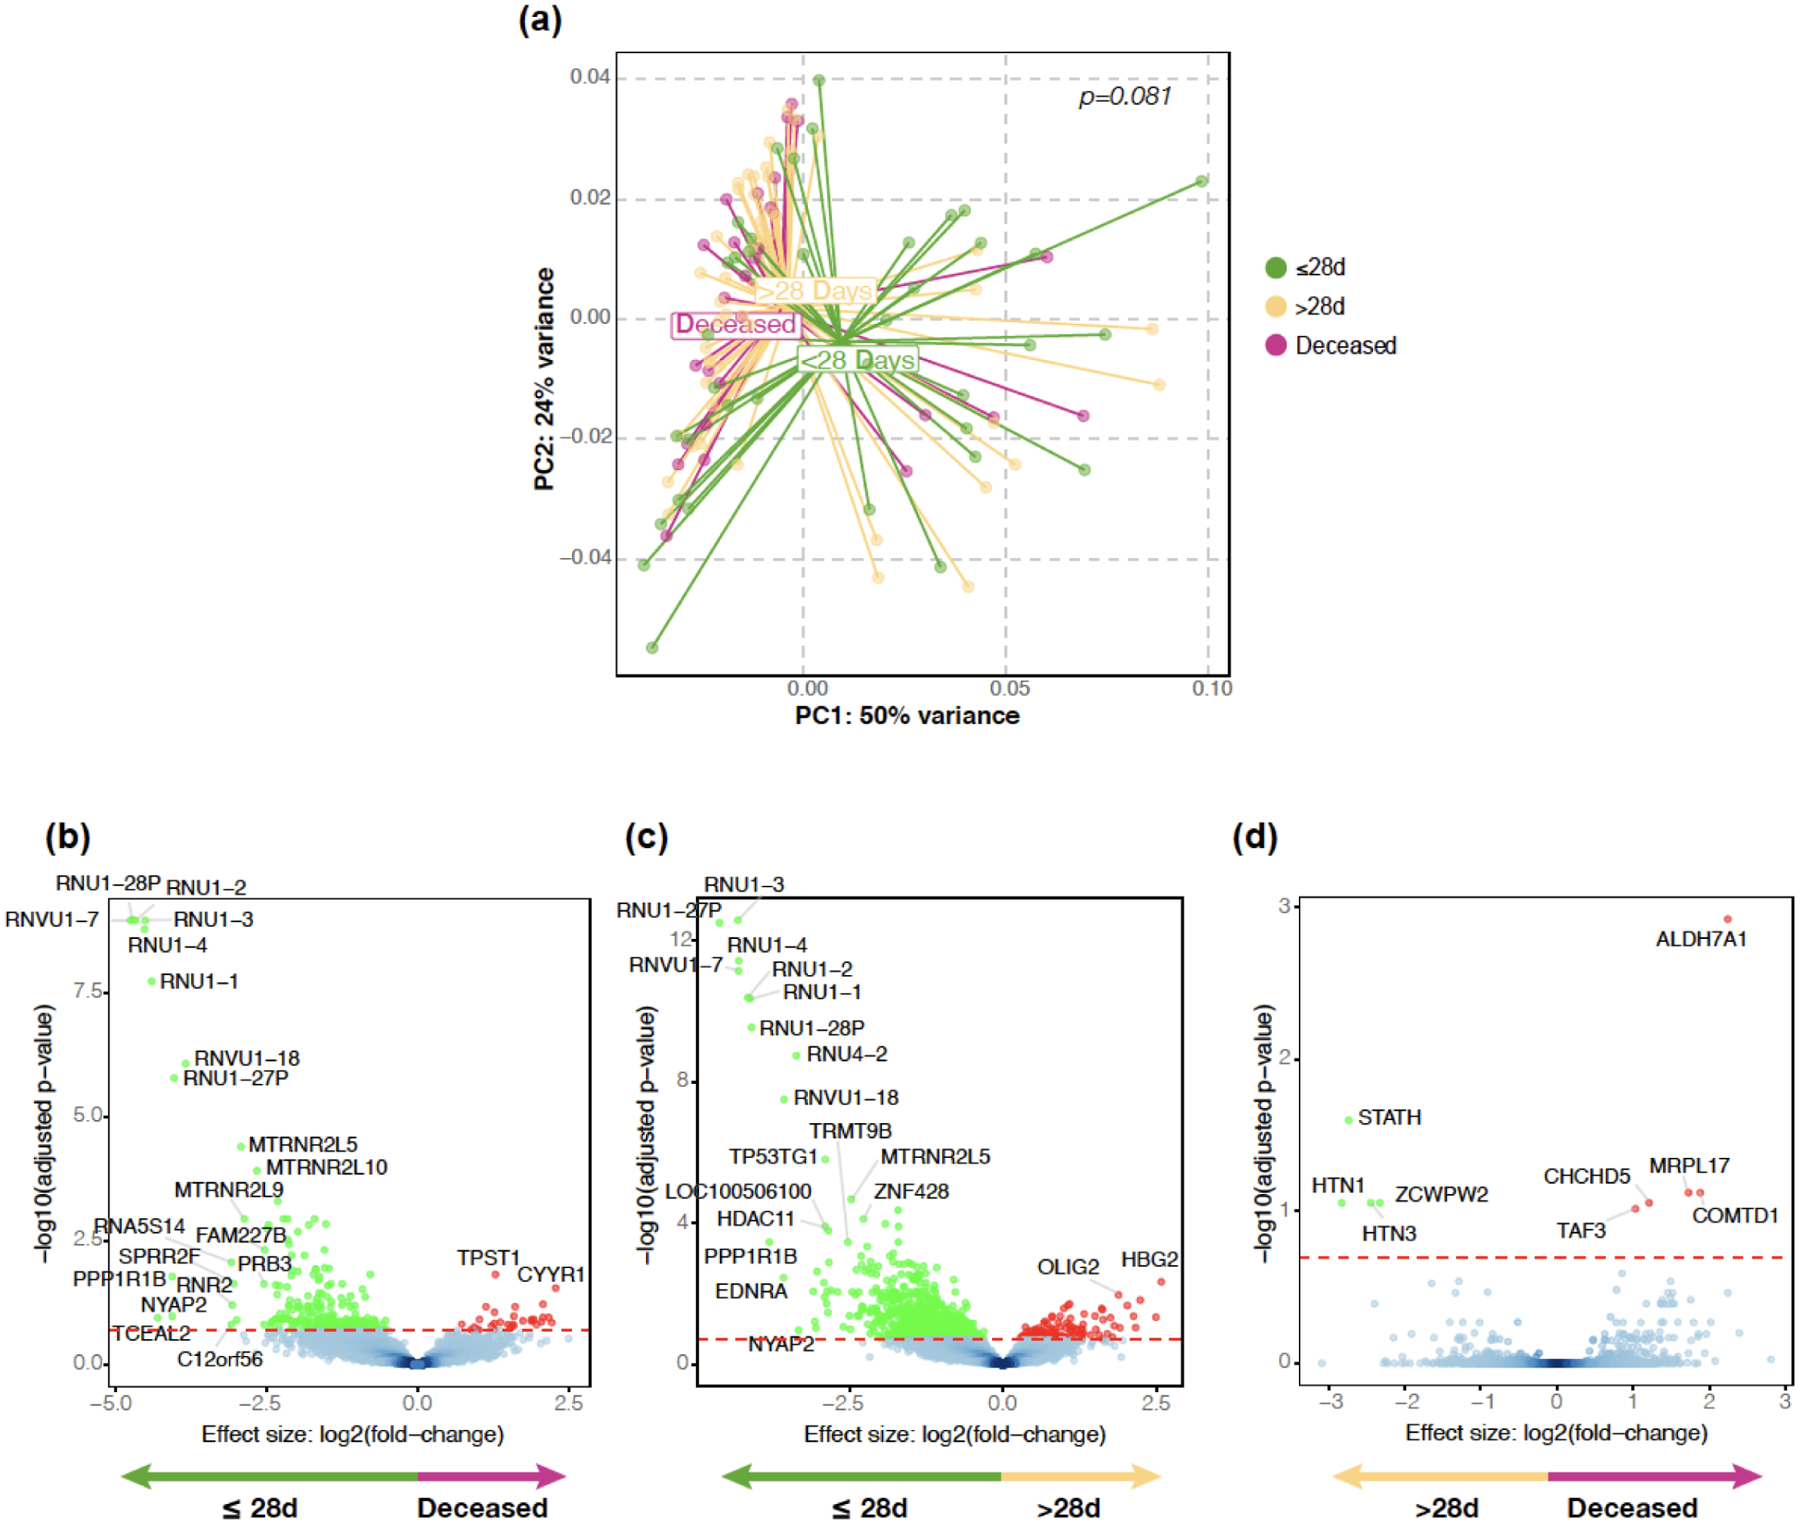
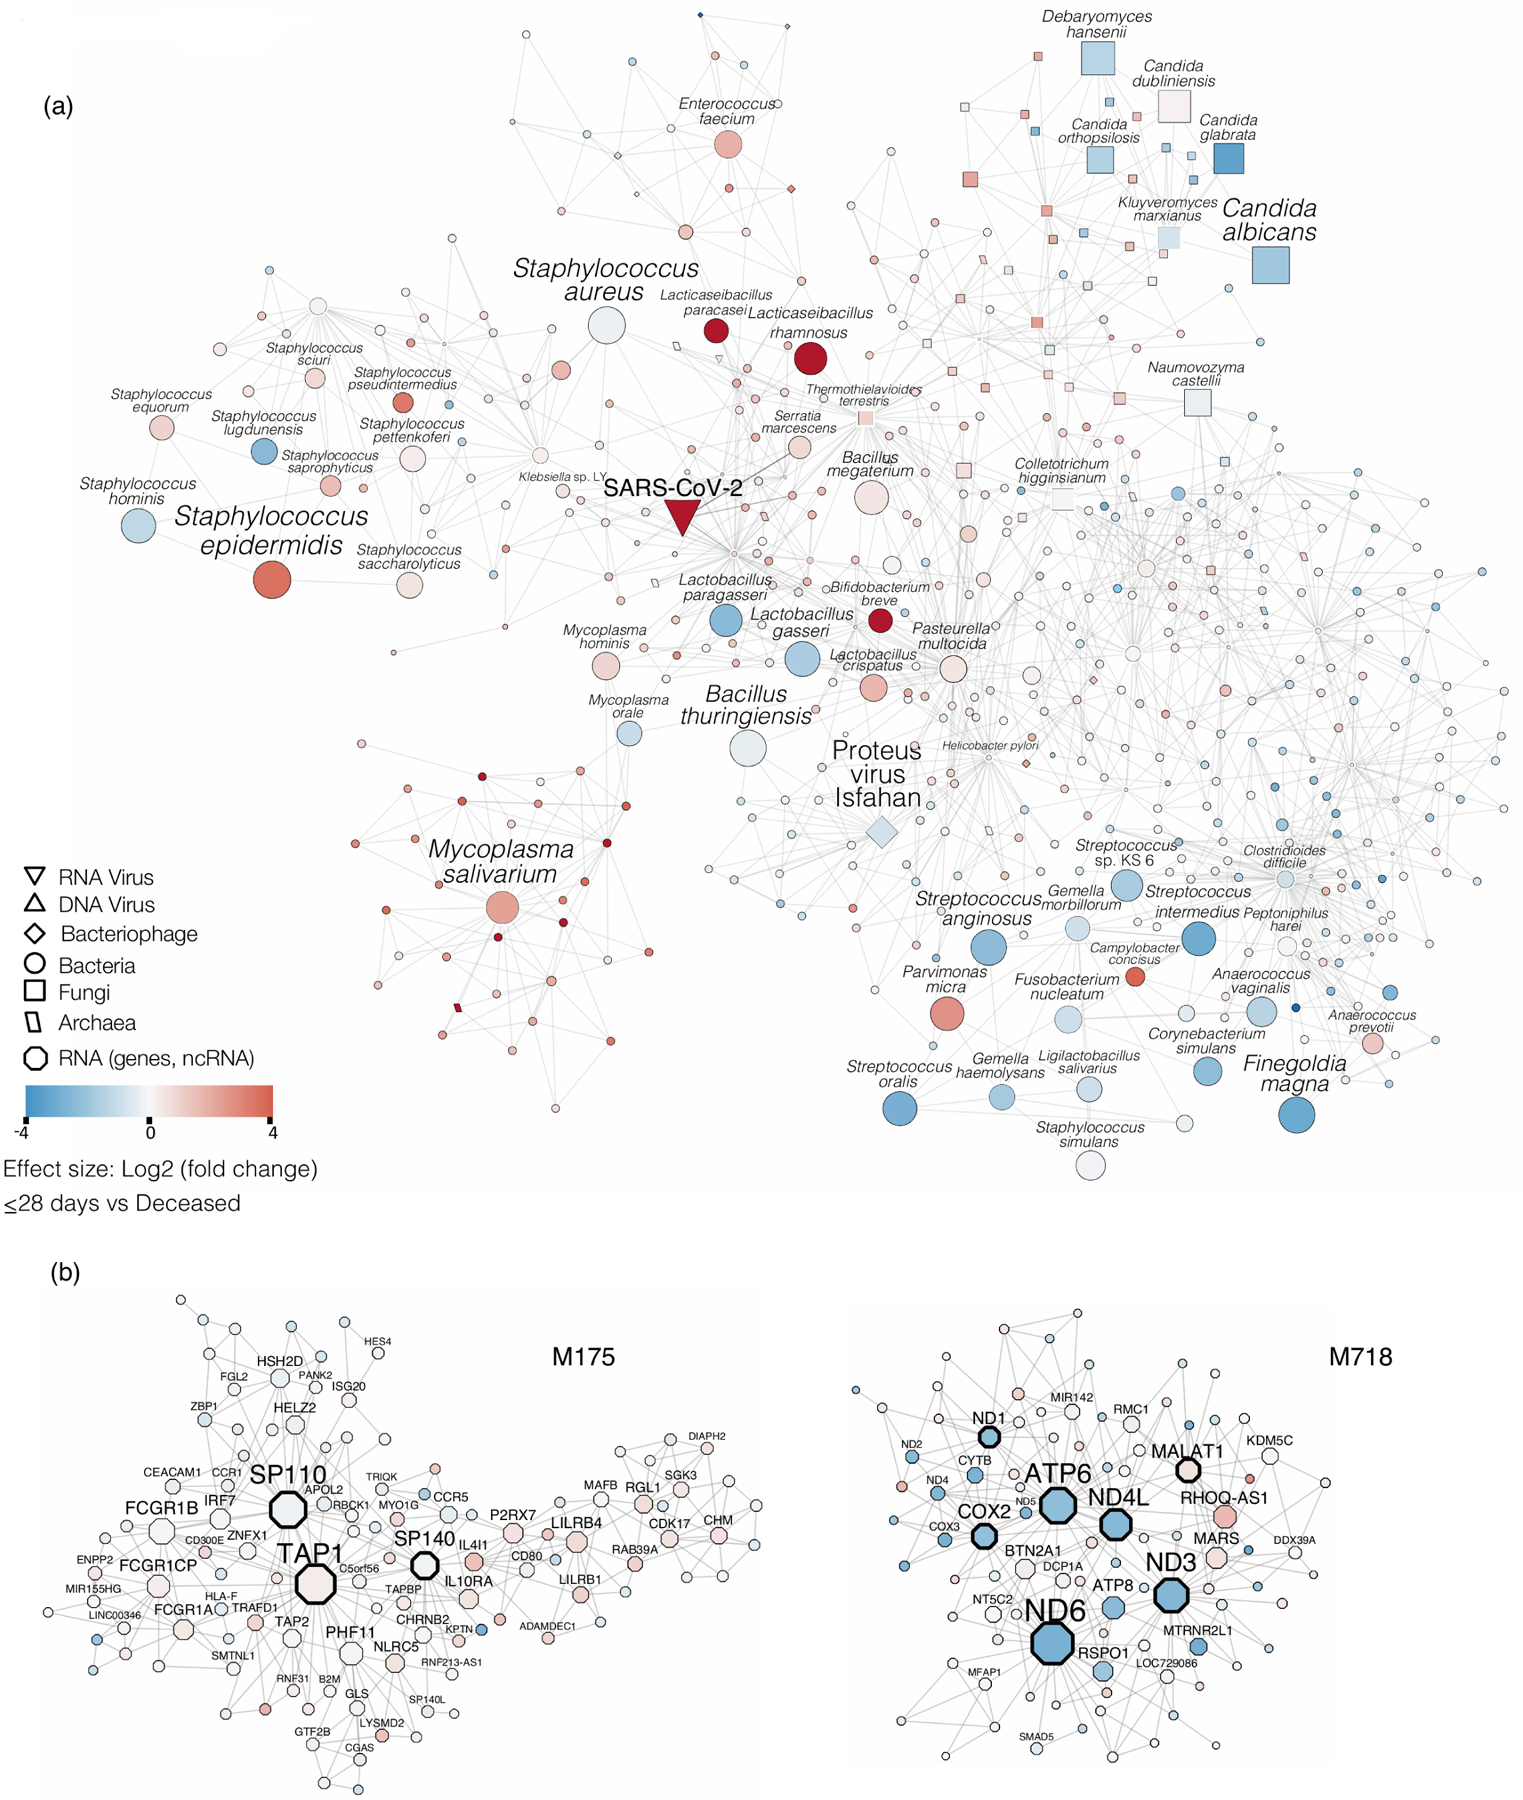
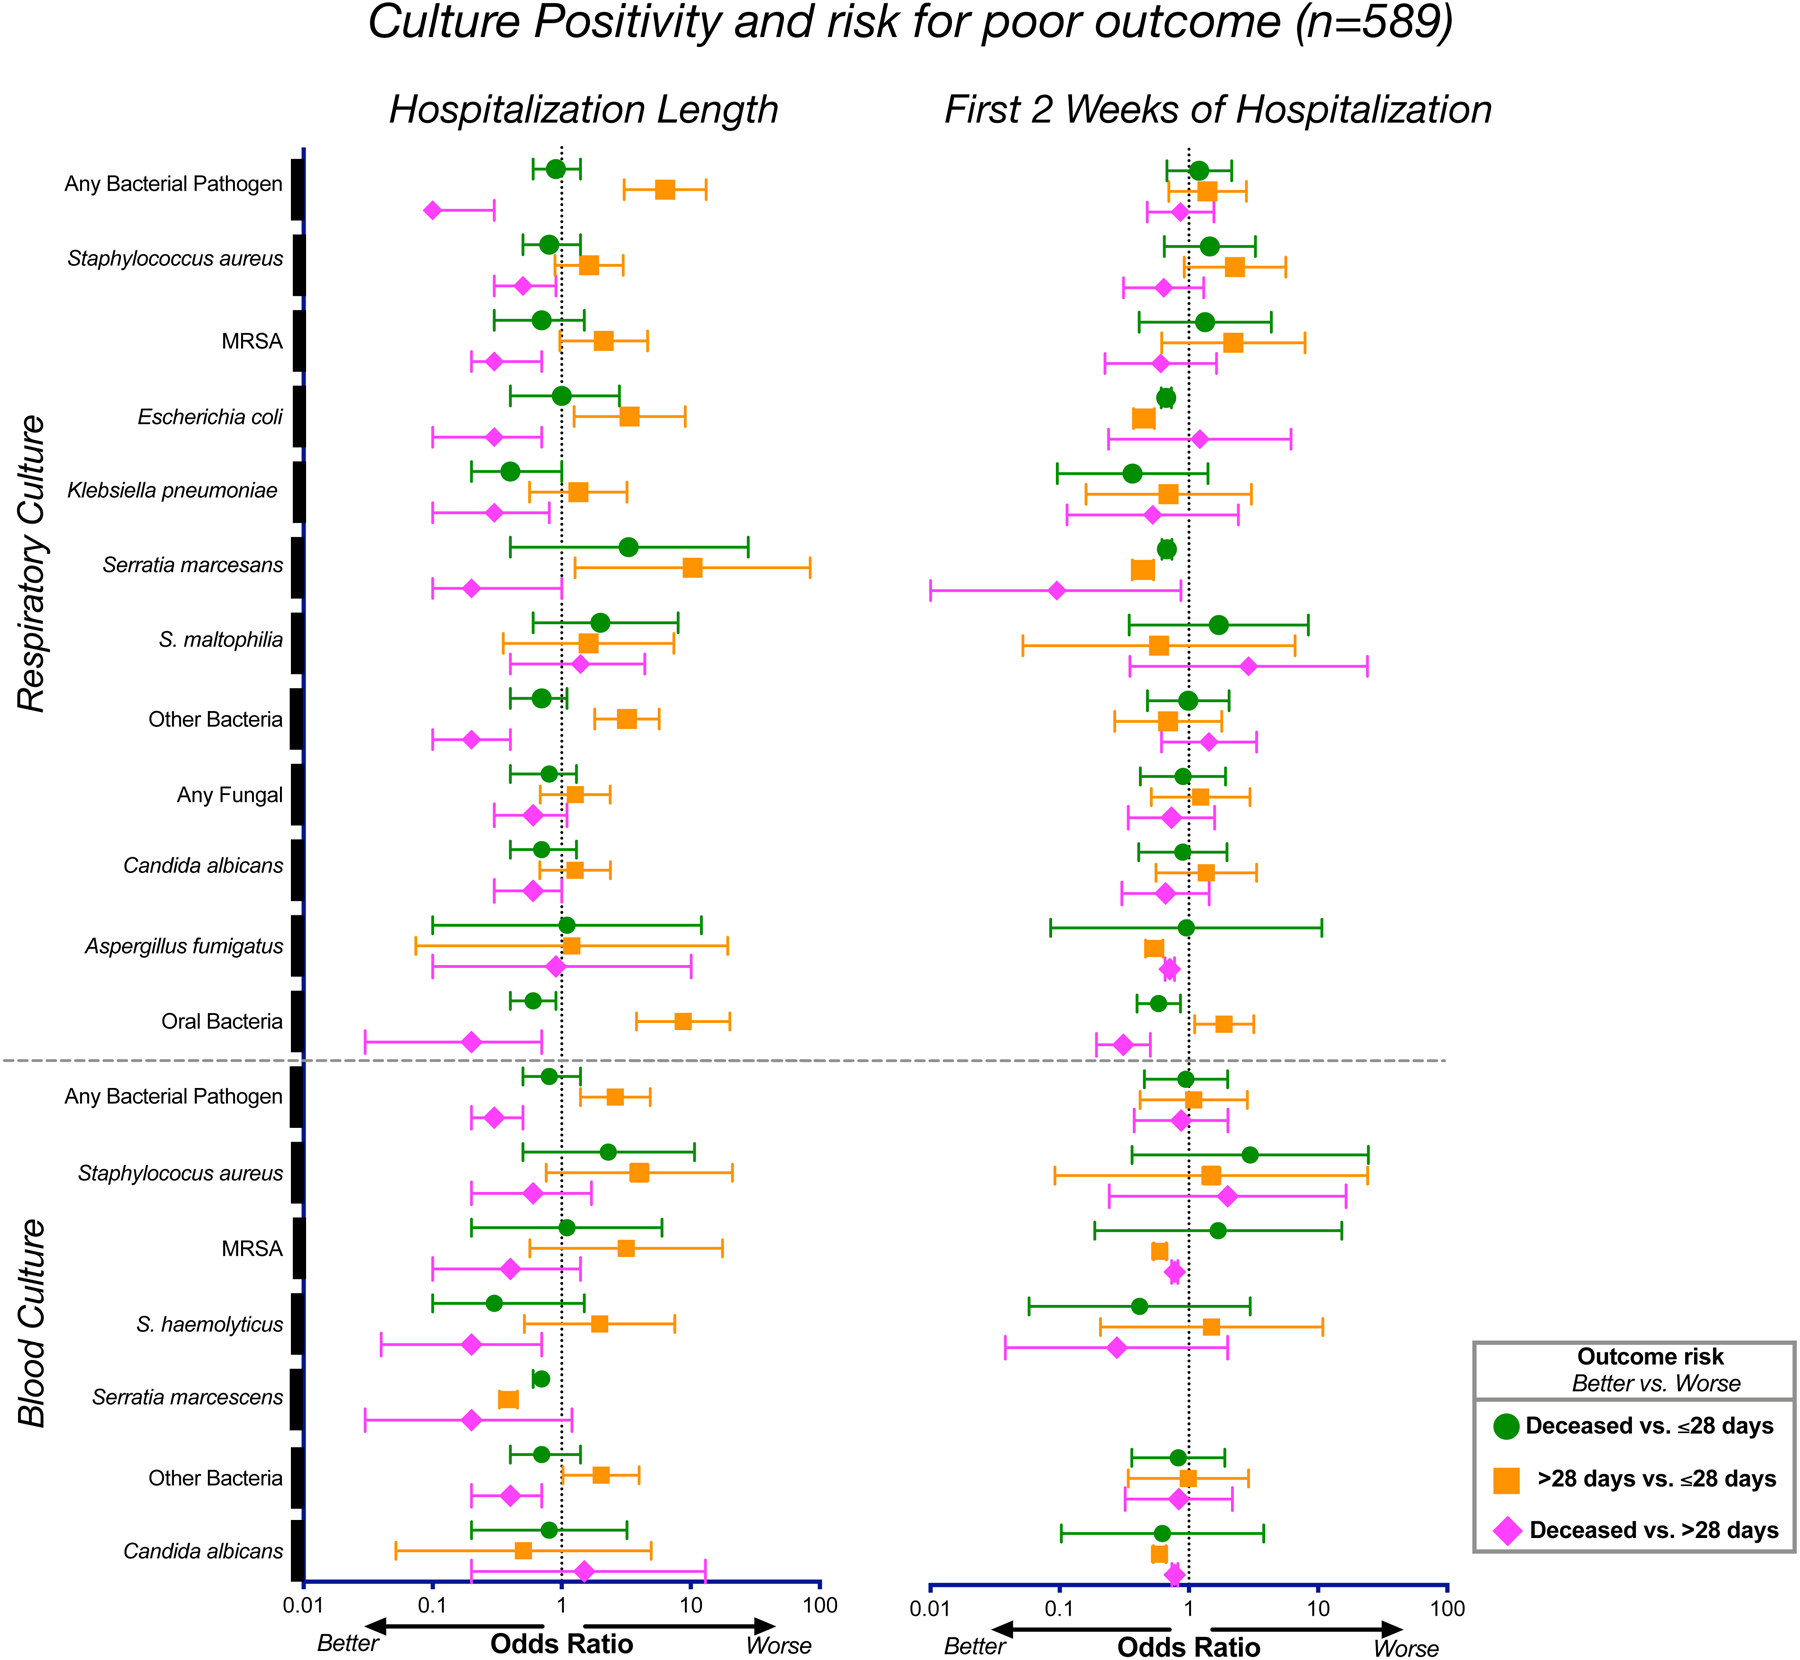
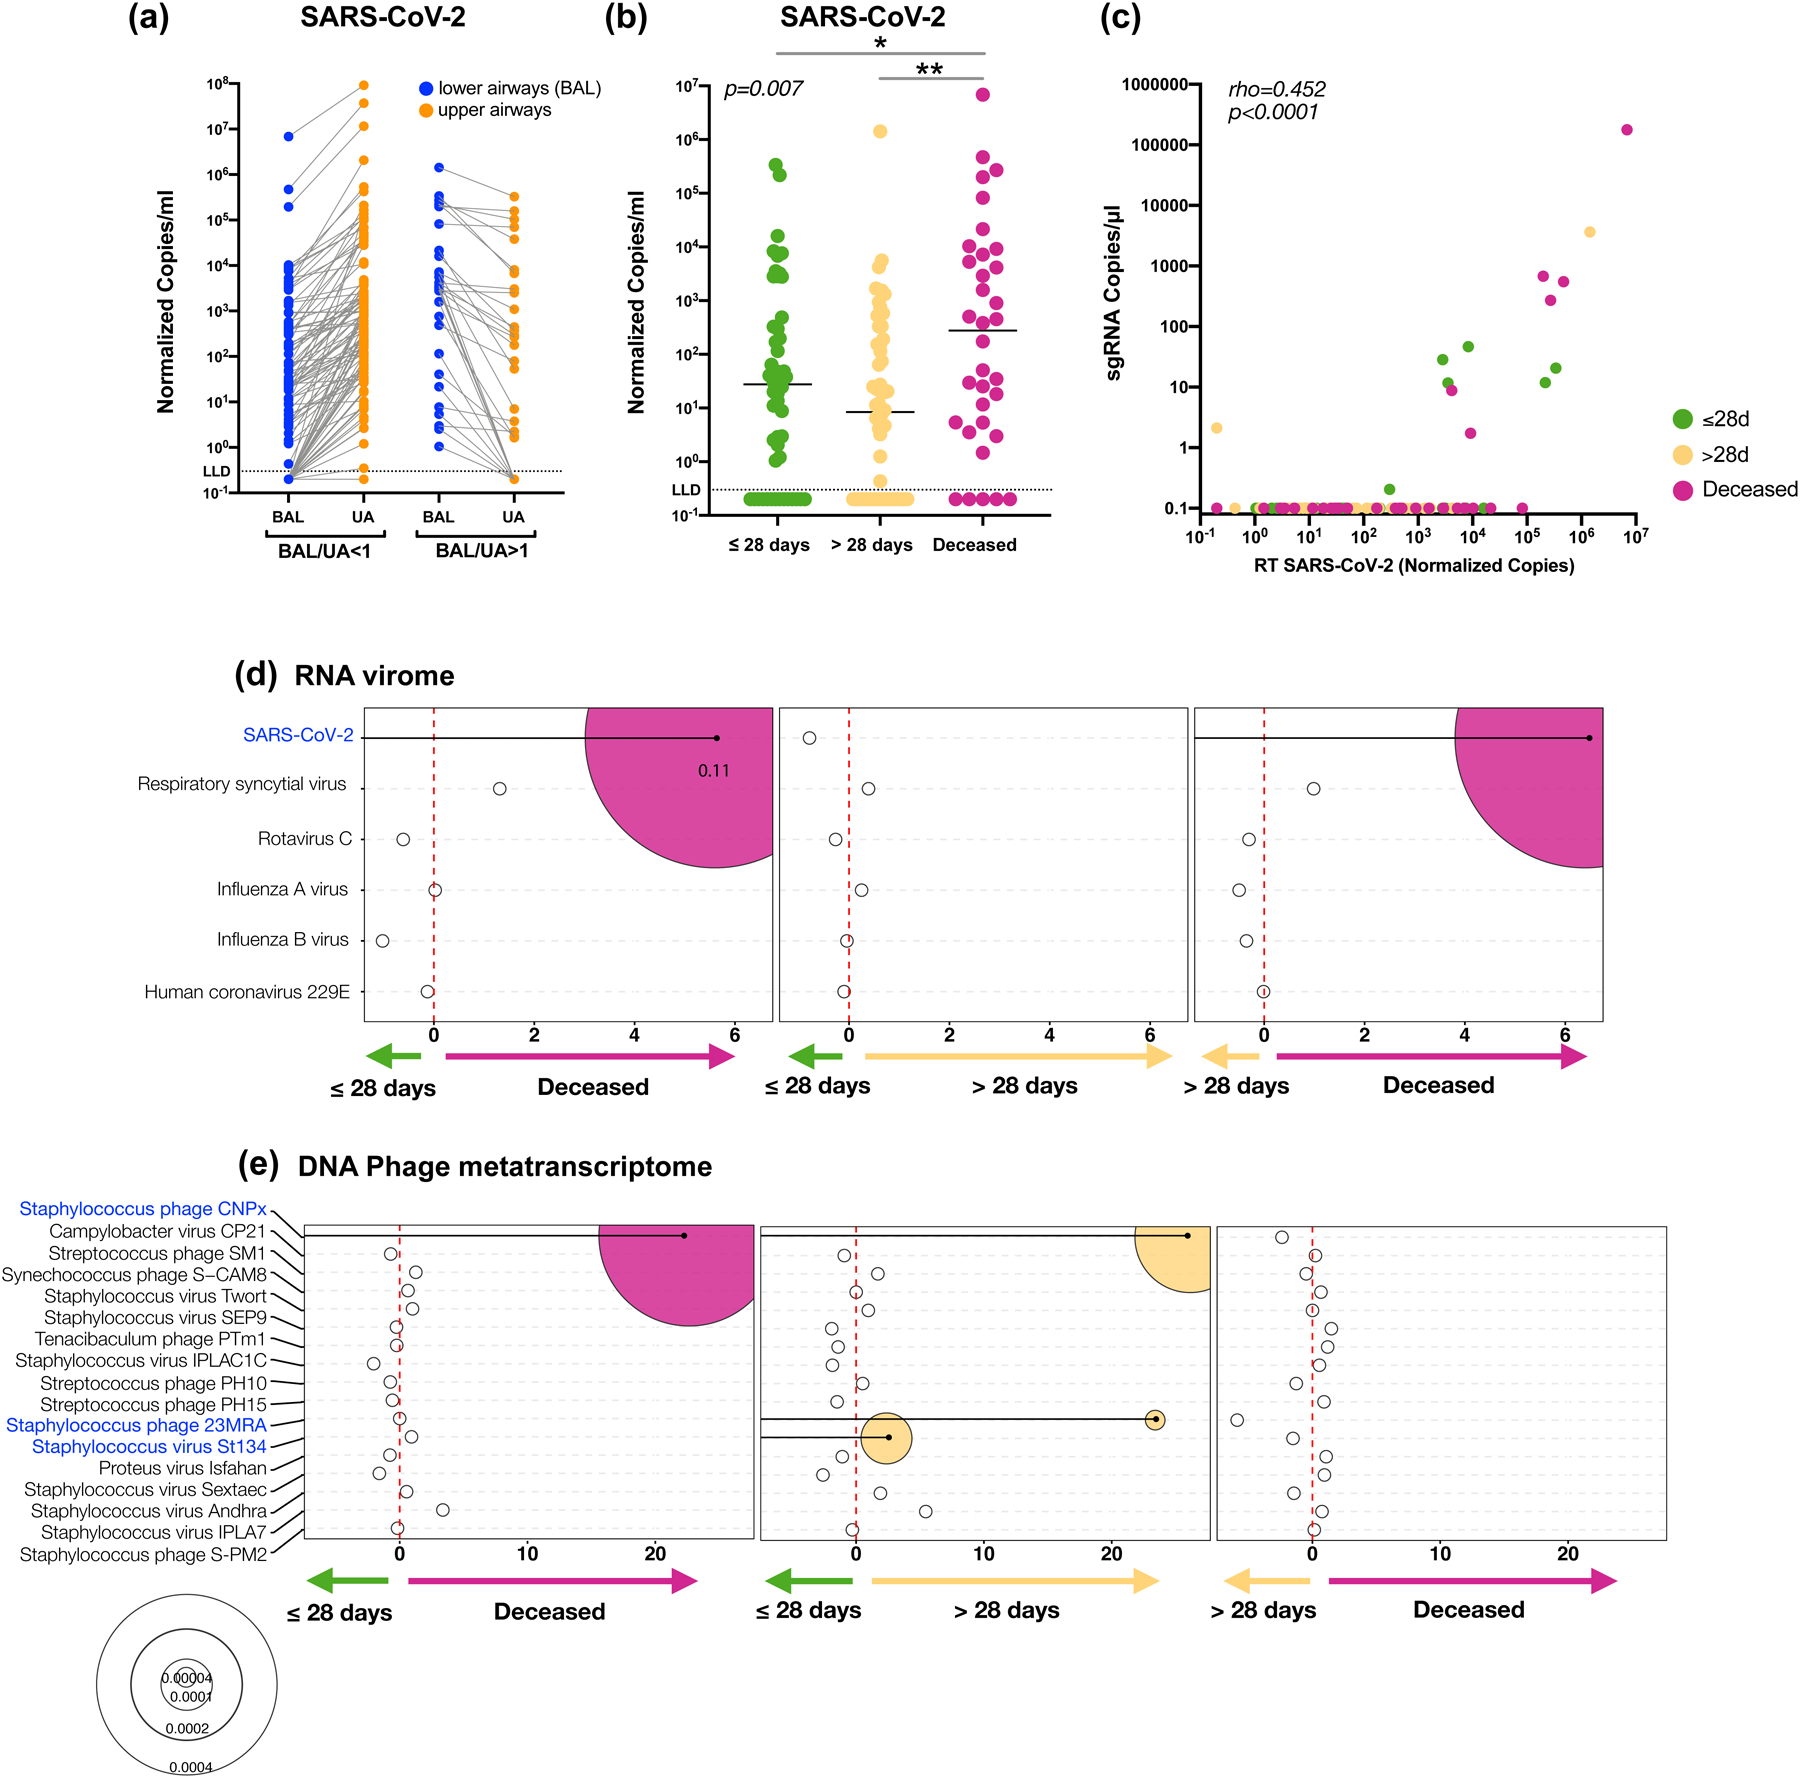
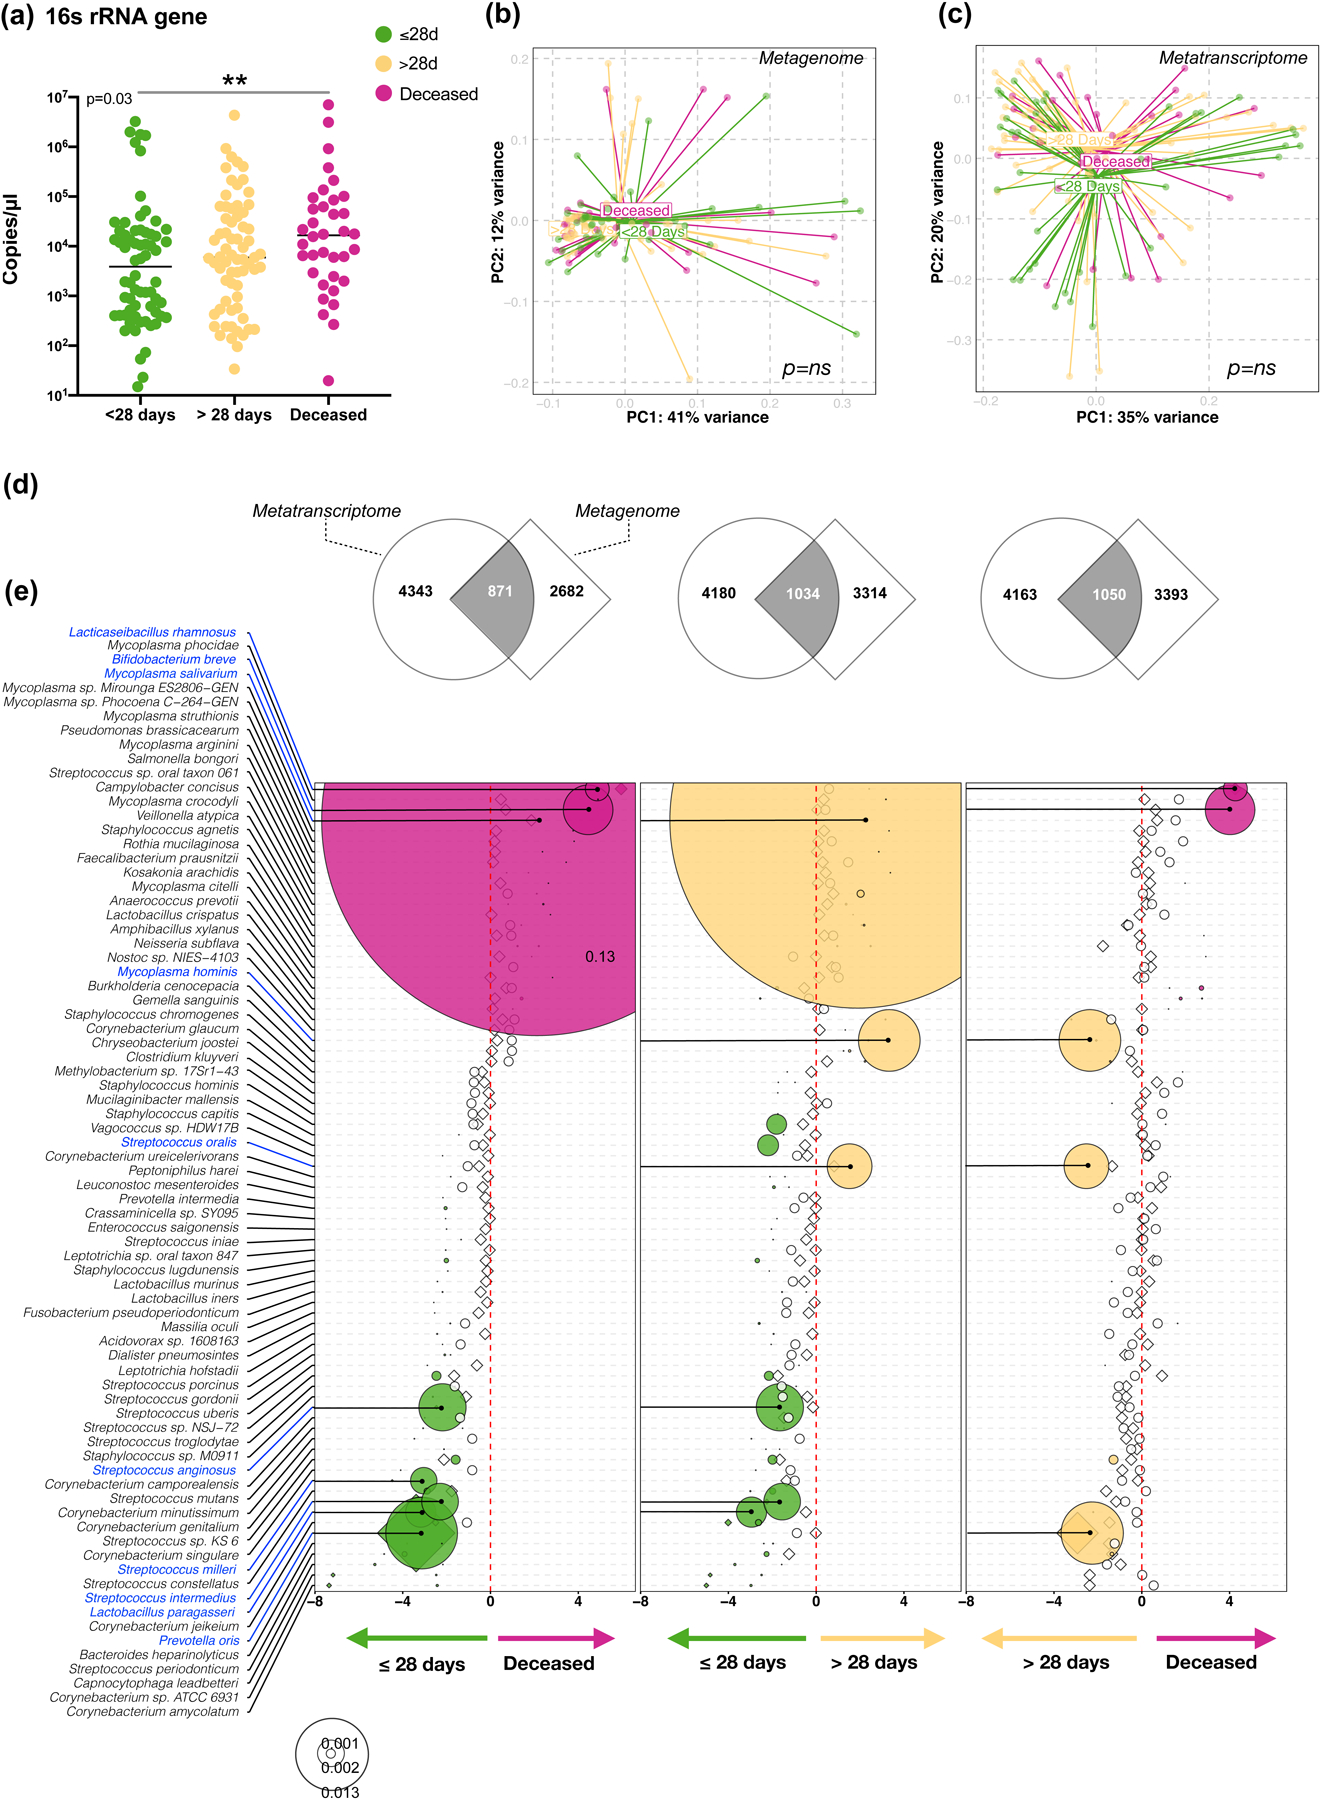
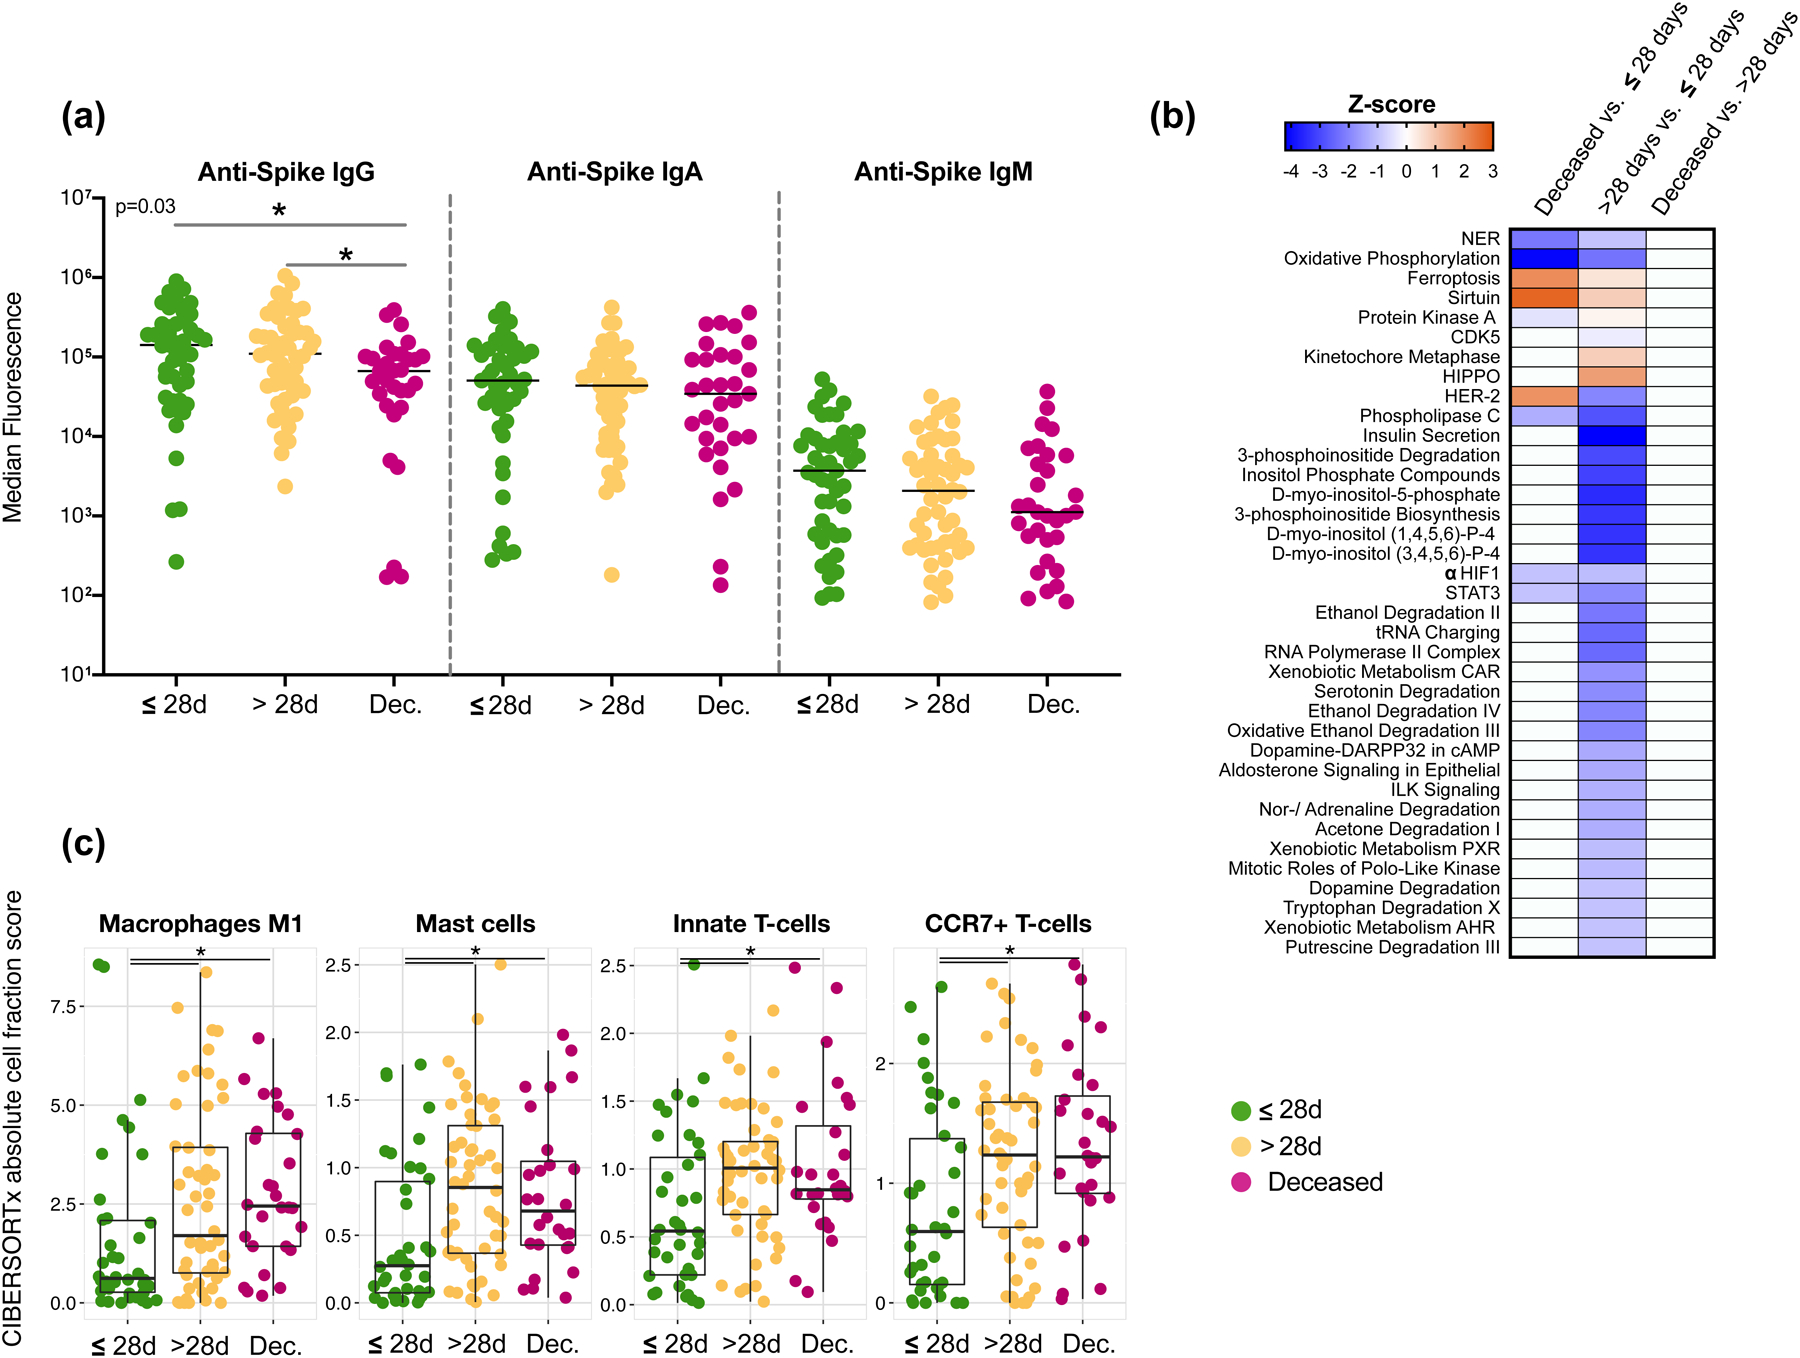
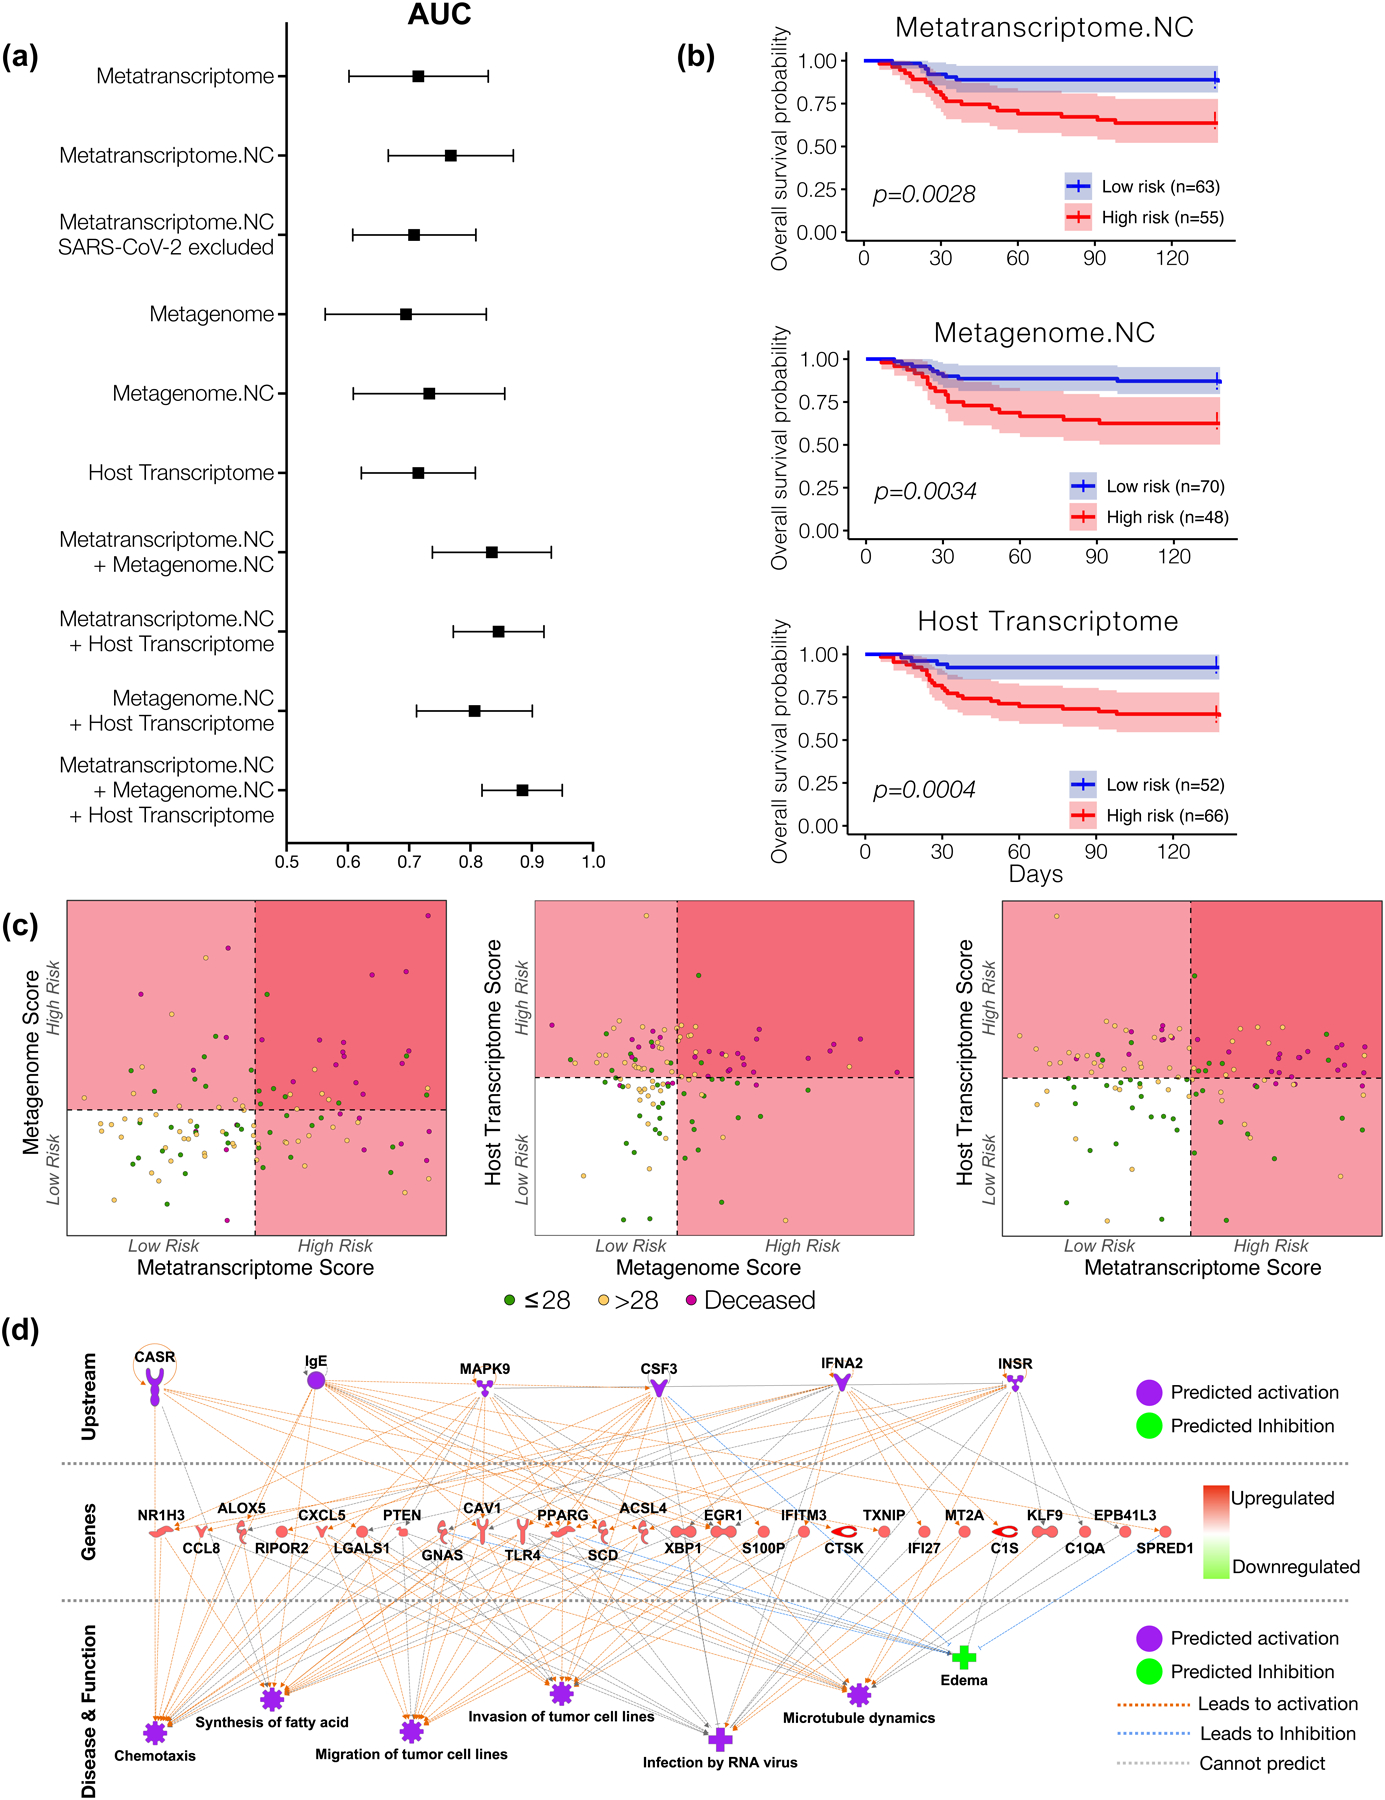
Respiratory failure is associated with increased mortality in COVID-19 patients. There are no validated lower airway biomarkers to predict clinical outcome. We investigated whether bacterial respiratory infections were associated with poor clinical outcome of COVID-19 in a prospective, observational cohort of 589 critically ill adults, all of whom required mechanical ventilation. For a subset of 142 patients who underwent bronchoscopy, we quantified SARS-CoV-2 viral load, analysed the lower respiratory tract microbiome using metagenomics and metatranscriptomics and profiled the host immune response. Acquisition of a hospital-acquired respiratory pathogen was not associated with fatal outcome. Poor clinical outcome was associated with lower airway enrichment with an oral commensal (Mycoplasma salivarium). Increased SARS-CoV-2 abundance, low anti-SARS-CoV-2 antibody response and a distinct host transcriptome profile of the lower airways were most predictive of mortality. Our data provide evidence that secondary respiratory infections do not drive mortality in COVID-19 and clinical management strategies should prioritize reducing viral replication and maximizing host responses to SARS-CoV-2.


Conflict of interest statement

Competing Interests Statement:

The authors declare no competing interests. The authors have no financial or non-financial interests to disclose.

Figures

Extended Data Fig. 1
Extended Data Fig. 1. Description of patient cohort, samples obtained, analyses performed and sequencing depth.
Schematic representation of the measurements obtained in this cohort of 589 critically ill COVID-19 patients. Top barplots summarize median number of reads obtained per sample of 142 independent subjects prior to filtering (Pre) and after filtering (Post). Bottom barplots show the median number of reads annotated to different microbial kingdoms in each sample. *SARS-CoV-2, Human with Lungs, RNA and DNA images were created with BioRender.com **NYU Langone Health is the official brand from NYU Langone Health.
Extended Data Fig. 2
Extended Data Fig. 2. Identification of top taxa found in background samples as compared with BAL and upper airway samples.
Boxplots showing the relative abundance values in log10 relative abundance of taxa ranked ordered based on dominance of Background bronchoscope control samples and compared to abundances in BAL and Upper Airway samples within metatranscriptome (a) and metagenome (b) data. Red labels indicate taxa where relative abundance is higher in background samples than in BAL and therefore considered possible contaminant.
Extended Data Fig. 3
Extended Data Fig. 3. Topographical analyses of metatranscriptome data.
a) Comparison of alpha diversity (Shannon Index, each dot denotes the Shannon diversity of a sample while the box center depicts median, box interquartile range with median at the center and whiskers represent maximum and minimum value) and b) beta diversity (Bray Curtis Dissimilarity index, across 5 background negative controls (bronchoscope), 118 bronchoalveolar lavage (BAL) and 64 upper airway (UA) samples (Kruskal-Wallis p value =0.0006 and PERMANOVA p-values = 0.001, without multiple comparisons, respectively). (c) Boxplots showing the relative abundance values in log10 across all metatranscriptome samples for the 118 BAL and 64 Upper Airway samples. The 50 taxa with the highest relative abundance values in the BAL metatranscriptome data are displayed; the top 10 in the BAL are highlighted in bold. Each column consists of four plots displaying in decreasing order of abundance the top RNA vertebrate viruses, DNA phages, bacteria, and fungi identified (from top to bottom). Numbers in parentheses next to the taxa labels display the ranking in relative abundance for either the BAL or UA metatranscriptome samples, respectively. Each dot denotes the relative abundance of a taxa per sample while the box center depicts median, box inter-quartile range with median at the center and whiskers represent maximum and minimum value.
Extended Data Fig. 4
Extended Data Fig. 4. Topographical analyses of metagenome data
Comparison of a) alpha diversity (Shannon Index, each dot denotes the Shannon diversity of a sample while the box center depicts median, box interquartile range with median at the center and whiskers represent maximum and minimum value) and b) beta diversity (Bray Curtis Dissimilarity index, across 5 background negative controls (bronchoscope), 118 bronchoalveolar lavage (BAL) and 64 upper airway (UA) samples (Kruskal-Wallis p-value = 0.00000000000000022 and PERMANOVA p-value= 0.001, without multiple comparisons, respectively). (c) Boxplots showing the relative abundance values in log10 across all metagenome samples for the 118 BAL and 64 Upper Airway samples. The 50 taxa with the highest relative abundance values in the BAL metagenome are displayed; the top 10 in the BAL are highlighted in bold. Each column consists of two plots displaying the most abundant bacteria and fungi identified. Numbers in parentheses next to the taxa labels displays its ranking in relative abundance for either the BAL or UA metagenome samples, respectively. Each dot denotes the relative abundance of a taxa per sample while the box center depicts median, box inter-quartile range with median at the center and whiskers represent maximum and minimum value.
Extended Data Fig. 5
Extended Data Fig. 5. Evaluation of associations between the lower airway mycobiome and clinical outcome.
Fungal taxonomic data was subtracted from metagenome and metatranscriptome data from 5 background negative controls (bronchoscope), 118 bronchoalveolar lavage (BAL) and 64 upper airway (UA) samples.. (a) Comparisons between the three clinical outcome groups was performed for α diversity (Shannon Index, each dot denotes the Shannon diversity of a sample while the box center depicts median, box inter-quartile range with median at the center and whiskers represent maximum and minimum value, left panel), β diversity (based on Bray Curtis Dissimilarity Index, right panel); Kruskal-Wallis p-value and PERMANOVA p-value respectively; on metagenome data. (b) Bubble plot showing DESeq results of fungi enriched in each clinical outcome comparisons based on metagenome data (bubble size based on median relative abundance for those found to be statistically significant). (c) Comparisons between the three clinical outcome groups was performed for α diversity (Shannon Index, each dot denotes the Shannon diversity of a sample while the box center depicts median, box inter-quartile range with median at the center and whiskers represent maximum and minimum value, left panel), β diversity (based on Bray Curtis Dissimilarity Index, right panel); Kruskal-Wallis p-value and PERMANOVA p-value respectively; on metatranscriptome data. (d) Bubble plot showing DESeq results of fungi enriched in each clinical outcome comparisons based on metatranscriptome data (bubble size based on median relative abundance for those found to be statistically significant).
Extended Data Fig. 6
Extended Data Fig. 6. Functional microbial compositional analyses.
KOs were summarized to associated pathways and differential expression was calculated based on DESeq2 analysis. (a) Gene Set Enrichment Analysis (GSEA) was used to compare the functional signatures identified in BAL metagenome and metatranscriptome as distinctly enriched for comparisons between clinical outcome groups. (b) Bubble plot showing DESeq results of microbial functions found concordantly differentially enriched between clinical outcome groups (bubble size based on median relative abundance for those found statistically significant).
Extended Data Fig. 7
Extended Data Fig. 7. Evaluation of associations between the lower airway antibiotic resistance genes and clinical outcome.
Bubble plot showing DESeq results of summarized categories of antibiotic resistant microbial genes taken from MEGARes for the metagenome (top) and metatranscriptome (bottom) data sets for each clinical outcome comparison (bubble size based on median relative abundance for those found to be statistically significant). Colored bubbles indicate significantly enriched antibiotic resistance groups.
Extended Data Fig. 8
Extended Data Fig. 8. Measurement of anti-SARS-CoV-2 Immunoglobulin levels and neutralization activity.
Levels of anti-SARS-CoV-2 Spike (a) and anti-SARS-CoV-2 receptor binding domain (RBD, b) antibodies in from 20 non-SARS-CoV-2 infected smoker controls and 142 severely ill COVID-19 intubated patients. Note that the signals for different isotypes cannot be compared because they are detected with different reagents. (c) Comparisons of anti-SARS-CoV-2 RBD antibody levels in 142 BAL samples across subjects in different clinical outcome groups (*= Two-sided Mann–Whitney U p<0.05). (d) Neutralizing activity in BAL samples across subjects in different clinical outcome groups.
Extended Data Fig. 9
Extended Data Fig. 9. Evaluation for associations between the lower airway host transcriptome and clinical outcome
(a) PCoA (based on Bray Curtis Dissimilarity Index, PERMANOVA p-value) comparing the three clinical outcome groups. (b, c, d) Volcano plots comparing lower airway host transcriptome between the three clinical outcome groups.
Extended Data Fig. 10
Extended Data Fig. 10. Multi-scale cross-kingdom and co-expression networks.
The neighborhood 5 cross-kingdom metatranscriptome network centered around SARS-CoV-2 is shown. Nodes refer to taxa, edges denote co-abundance after MEGENA. The size of the nodes indicates abundance. Taxa with large nodes are highly abundant. Node shapes are according to the legend and refer to different microbial kingdoms. The differential abundance of taxa in log2(fold change) between the deceased group and the ≤28-day MV groups is shown by node color - red nodes are taxa abundant in the deceased group compared to the ≤28-day MV group, blue colored nodes denote the opposite. (b) Modules M175 and M718 of the host transcriptome are shown. The node size refers to the absolute gene expression value. Nodes with wide node border refer to key regulators/hub genes (see Methods). The differential gene expression of taxa in log2(fold change) between the deceased group and the ≤28-day MV groups is shown by node color - red nodes are up-regulated in the deceased group compared to the ≤28-day MV group, blue colored nodes denote the opposite.
Figure 1.
Figure 1.. Associations between culture positivity and clinical outcome.
Odds ratios and corresponding 95% confidence intervals for rates of culture positivity for the whole cohort (n=589) during length of hospitalization (left) and during the first 2 weeks of hospitalization (right).
Figure 2.
Figure 2.. SARS-CoV-2 viral load and virus metatranscriptome analyses.
Copies of the SARS-CoV-2 N gene per ml, normalized by the Human RNase P gene, comparing paired upper and lower airway samples (a) and levels in BAL comparing clinical outcome groups in 142 subjects (b, *= Two-sided Mann–Whitney U p=0.038, **= Two-sided Mann–Whitney U p=0.001;). (c) PCoA analysis based on Bray Curtis Dissimilarity index of BAL Metatranscriptome data comparing clinical outcome (PERMANOVA p-value). Bubble plot showing DESeq results of RNA viruses (d) and expressed DNA phages (e) enriched in each clinical outcome comparisons (bubble size based on median relative abundance for those found to be statistically significant).
Figure 3.
Figure 3.. Bacteria load and taxonomic compositional analyses.
(a) Bacterial load measured by ddPCR targeting 16S rRNA gene in 142 subjects (**= Two-sided Mann–Whitney U p<0.01). PCoA analysis based on Bray Curtis Dissimilarity index of BAL (b) Metagenome (c) and Metatranscriptome data comparing clinical outcome (Single variable PERMANOVA p-value). (d) Gene Set Enrichment Analysis (GSEA) was used to compare the taxonomic signatures identified in BAL metagenome (diamonds) and metatranscriptome (circles) as distinctly enriched for comparisons between clinical outcome groups (differential enrichment performed based on DESeq2 analysis). (e) Bubble plot showing DESeq results of bacteria found concordantly differentially enriched between clinical outcome groups (bubble size based on median relative abundance for those found statistically significant).
Figure 4.
Figure 4.. Lower airway host immune profiling in severely ill COVID-19.
(a) Levels of anti-SARS-CoV-2 Spike antibodies in BAL of 142 subjects (*= Two-sided Mann–Whitney U; Deceased vs <28D p=0.0133; Deceased vs >28D p=0.0213). (b) Heat-map of canonical pathway analysis based on Ingenuity Pathway Analysis (IPA, RRID:SCR_008653) using the lower airway host transcriptome comparing clinical outcome groups. Orange shows up-regulation of pathway, blue shows down-regulation of pathway. (c) Cell type abundance quantification plots. Comparison of abundance of mast cells and neutrophils among outcome groups in the BAL fluids of 118 critically ill patients with COVID-19. Cell type abundance was estimated from the host transcriptome with CIBERSORTx. Each dot denotes the quantification score of a sample while the box center depicts median, box inter-quartile range with median at the center and whiskers represent maximum and minimum (*=Two-sided Mann–Whitney U; Macrophages: M1 >28D vs <28D p=0.017; Deceased vs <28D p=0.0014; Mast Cells: >28D vs <28D p=0.0013; Deceased vs <28D p=0.0056; Innate T-Cells: >28D vs <28D p=0.0071; Deceased vs <28D p=0.0068; CCR7+ T-cells: >28D vs <28D p=0.0192; Deceased vs <28D p=0.0068).
Figure 5.
Figure 5.. Mortality predictive power of metatranscriptome, metagenome and host transcriptome.
(a) Area under the curve median and 95% confidence interval for receiver operating characteristic curve analyses calculated from each sequencing datasets as predictor and mortality (death time from ICU admission) as outcome from 118 subjects. (b) Kaplan-meier survival analyses with 95% confidence interval based on a cutoff value estimated from features selected from each sequencing dataset. The “High risk” and “Low risk” groups is the mean of predicted risk scores in all samples (p value with Matel Cox). (c) Scatterplot among risk scores from metatranscriptome, metagenome, and host transcriptome. Dotted line denotes the mean of the risk scores across all subjects, which is also the threshold for dividing the samples into “High risk” and “Low risk” groups. (d) IPA analyses of host transcriptomic signatures identified as most predictive of mortality.

Update of

References

    1. The, L. Emerging understandings of 2019-nCoV. Lancet 395, 311 (2020). - PMC - PubMed
    1. WHO coronavirus disease (COVID-19) dashboard. Geneva: World Health Organization, Available online: https://covid19.who.int/ (2020).
    1. Rabaan AA, et al.SARS-CoV-2, SARS-CoV, and MERS-COV: A comparative overview. Infez Med 28, 174–184 (2020). - PubMed
    1. Cao X COVID-19: immunopathology and its implications for therapy. Nat Rev Immunol 20, 269–270 (2020). - PMC - PubMed
    1. Morens DM & Fauci AS The 1918 influenza pandemic: insights for the 21st century. J Infect Dis 195, 1018–1028 (2007). - PubMed

Publication types

MeSH terms