. 2021 Aug 12:30:16-30.
doi: 10.1016/j.jot.2021.06.003. eCollection 2021 Sep.

Cyclooxygenase-2 regulates PTHrP transcription in human articular chondrocytes and is involved in the pathophysiology of osteoarthritis in rats

Affiliations

Cyclooxygenase-2 regulates PTHrP transcription in human articular chondrocytes and is involved in the pathophysiology of osteoarthritis in rats

Ling-Hua Chang et al. J Orthop Translat. .

Abstract

Background: Cyclooxygenase-2 (COX-2) inhibitors are prescribed for the management of osteoarthritis (OA)-associated pain and inflammation. However, the role of COX-2 in normal and osteoarthritic articular chondrocytes has not been well investigated. We hypothesize that COX-2 plays a role in articular chondrocytes under normal conditions and during OA progression.

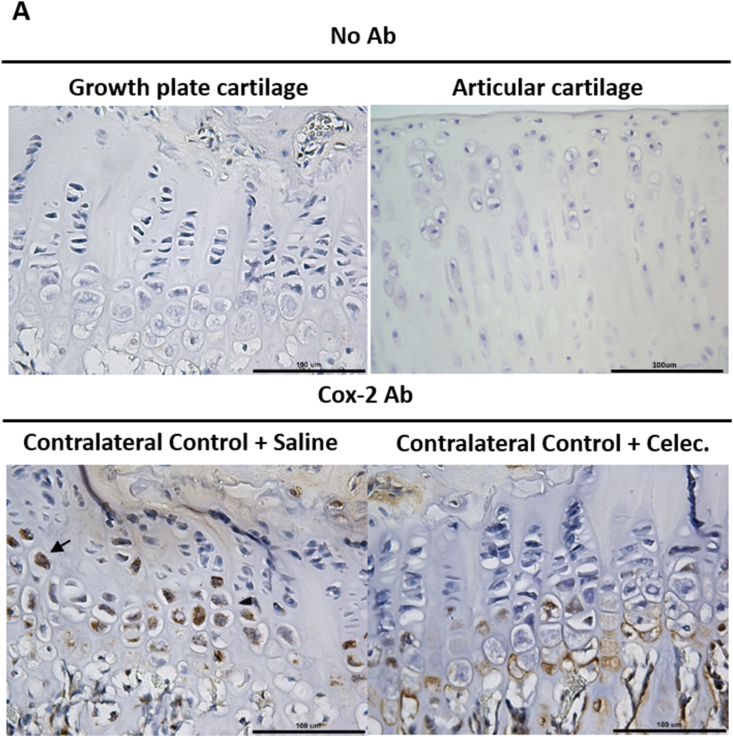
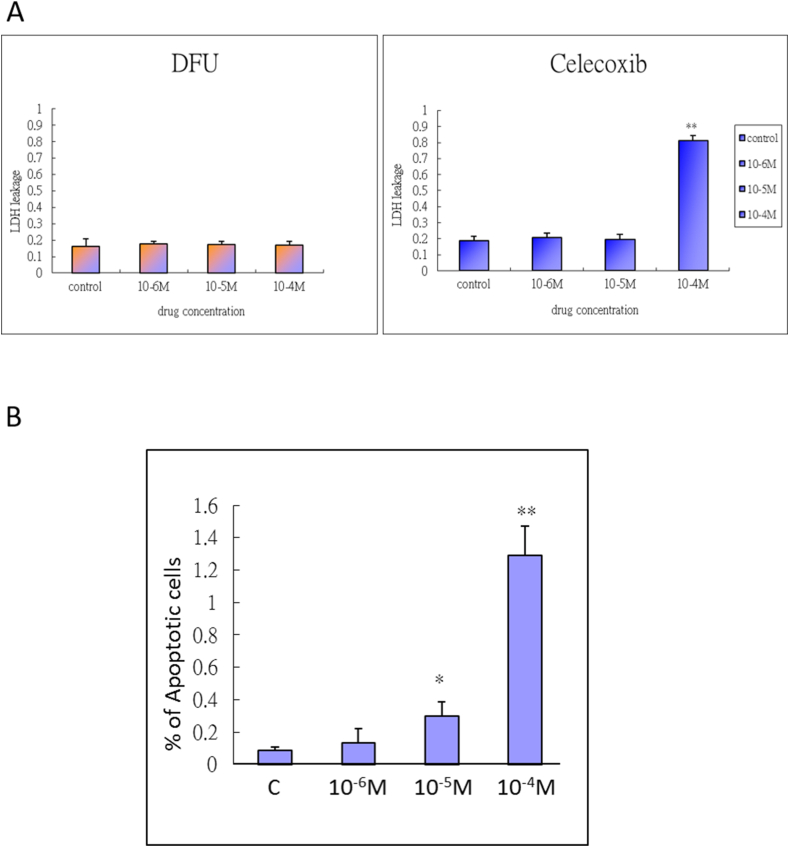
Methods: In vivo COX-2 levels in articular cartilage of normal and papain-induced osteoarthritic rats were compared. The role of COX-2 in human articular chondrocytes (HACs) was tested in vitro by COX-2 overexpression or activity inhibition. The levels of COX-2 and marker gene for normal function or articular cartilage degeneration were evaluated: mRNA by qRT-PCR; proteins by western blotting or immunohistochemistry; and glycosaminoglycan (GAG) by Safranin O-fast green staining. Parathyroid hormone-related protein (PTHrP) promoter activity was detected with luciferase reporter assays.

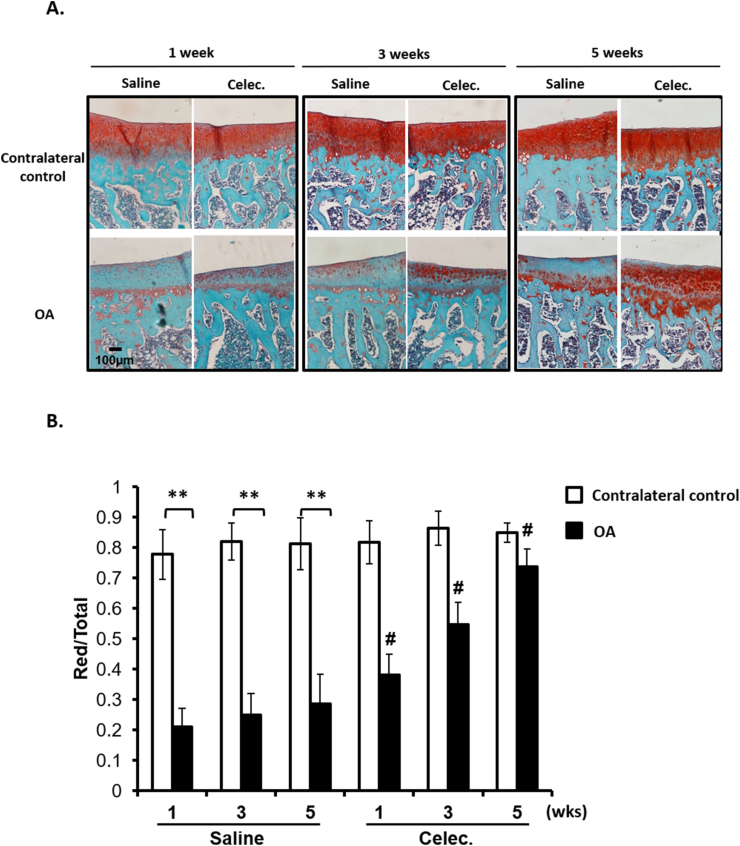
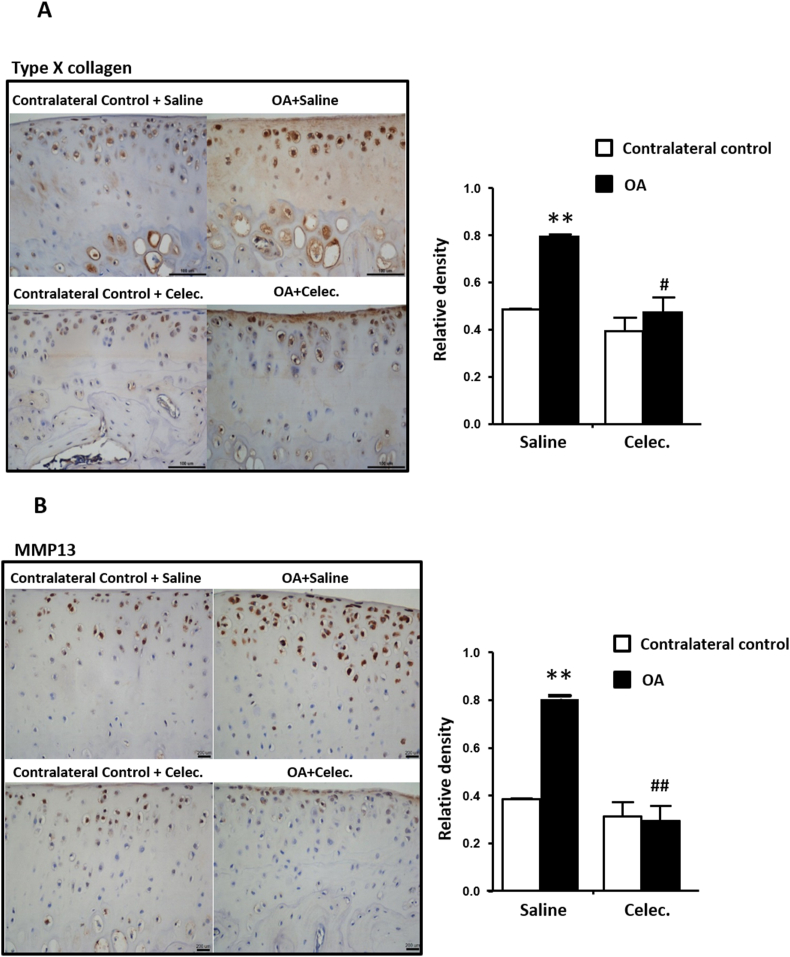
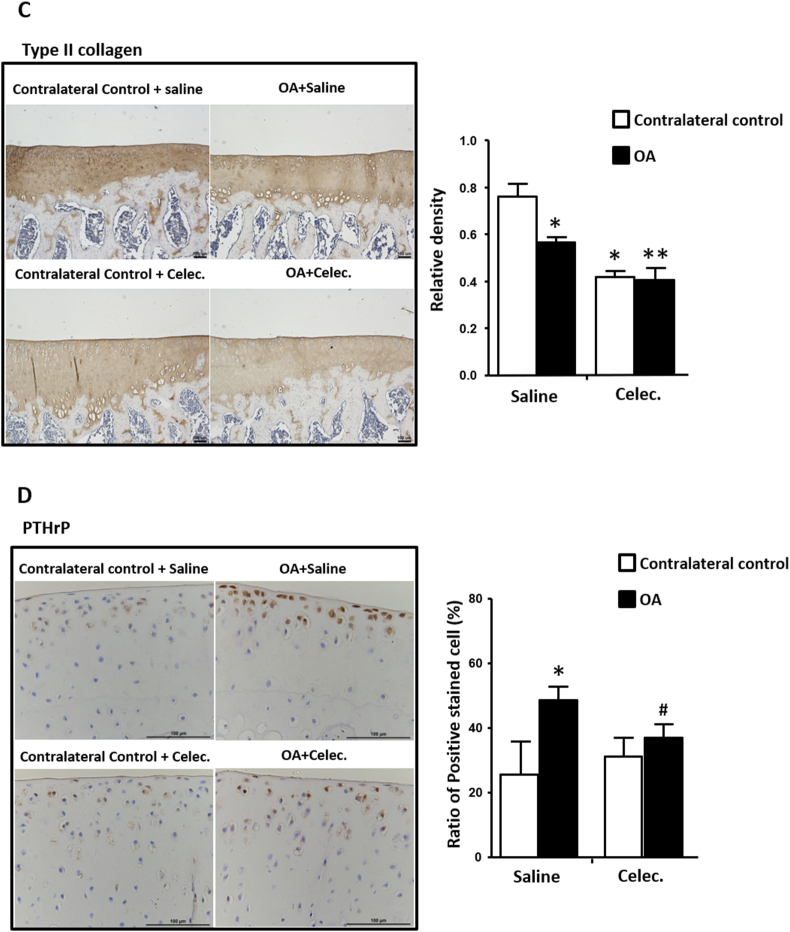
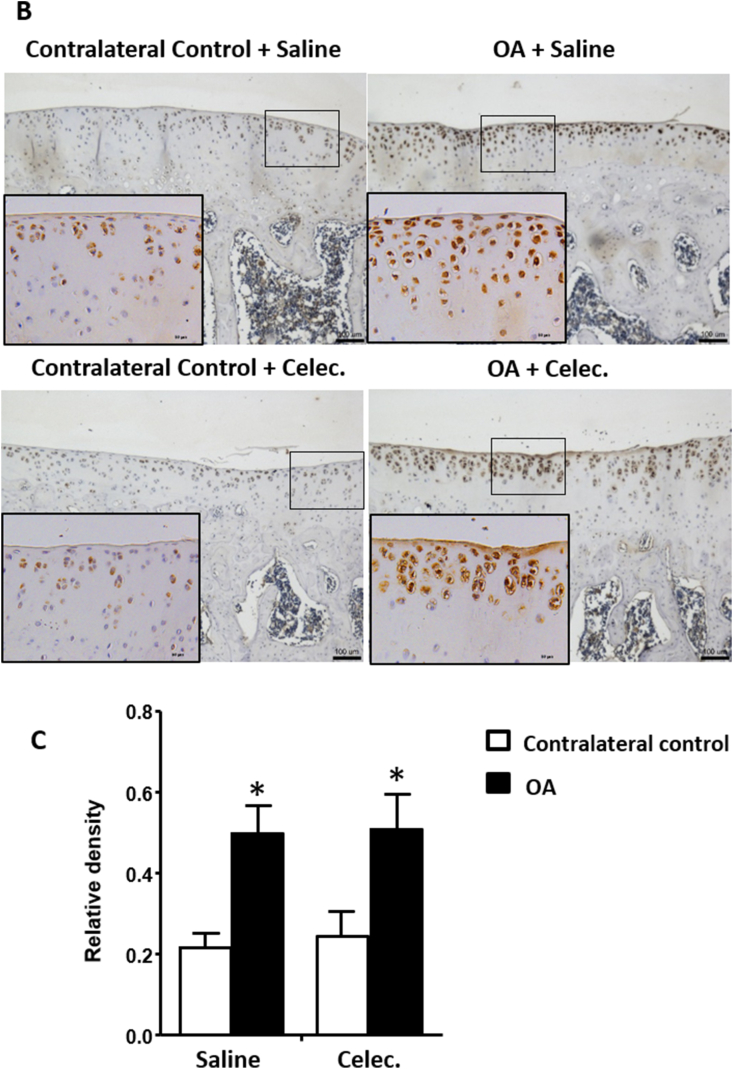
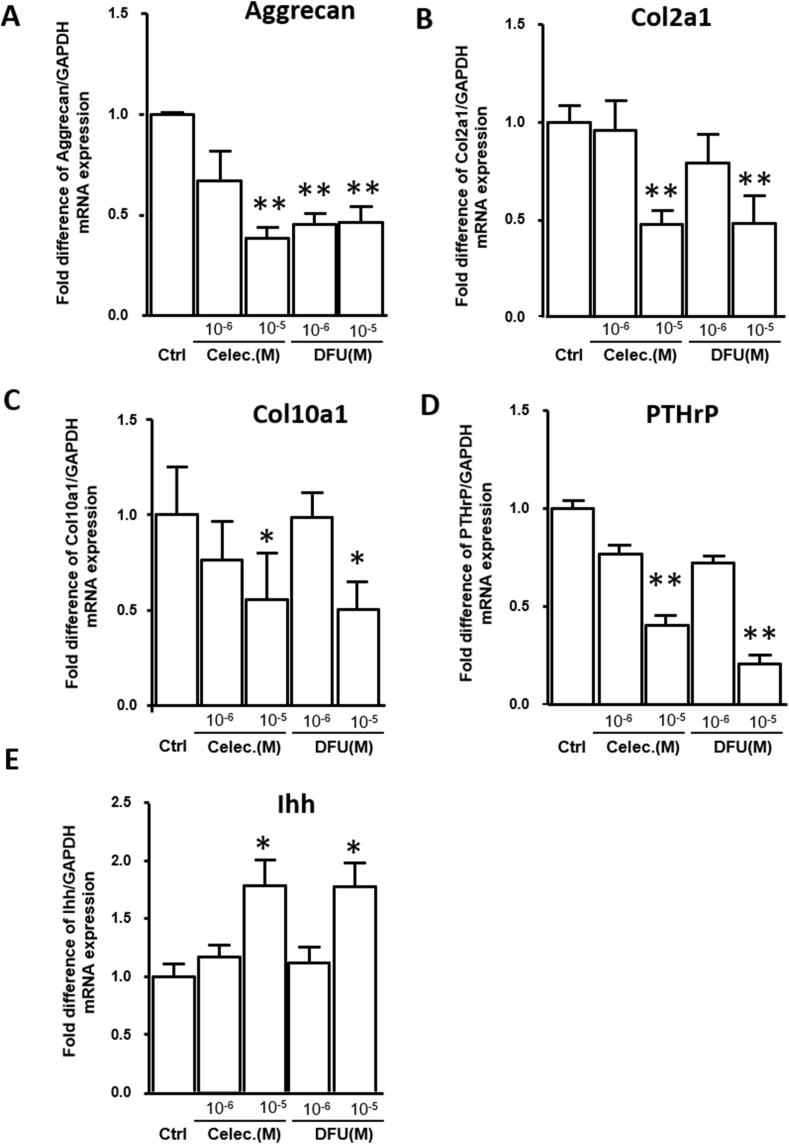
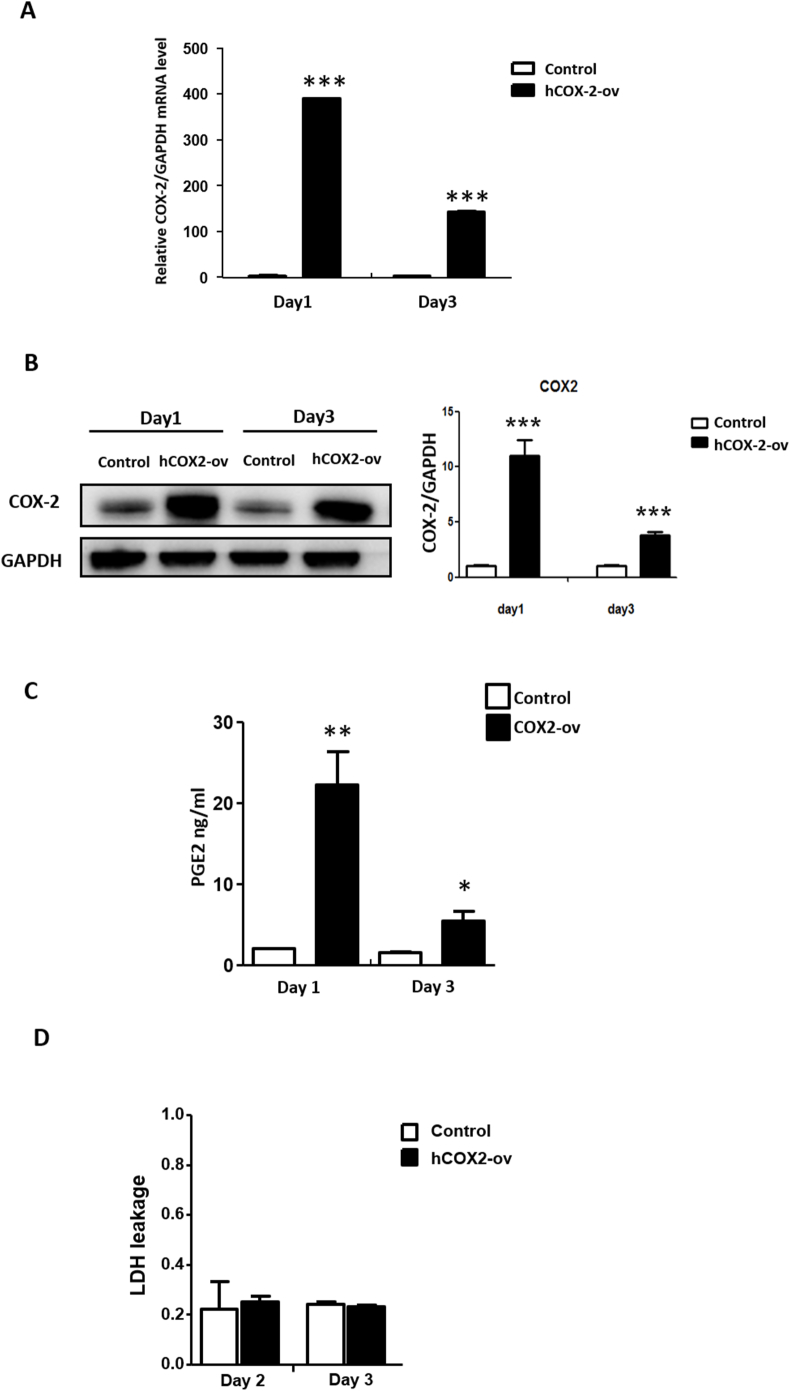
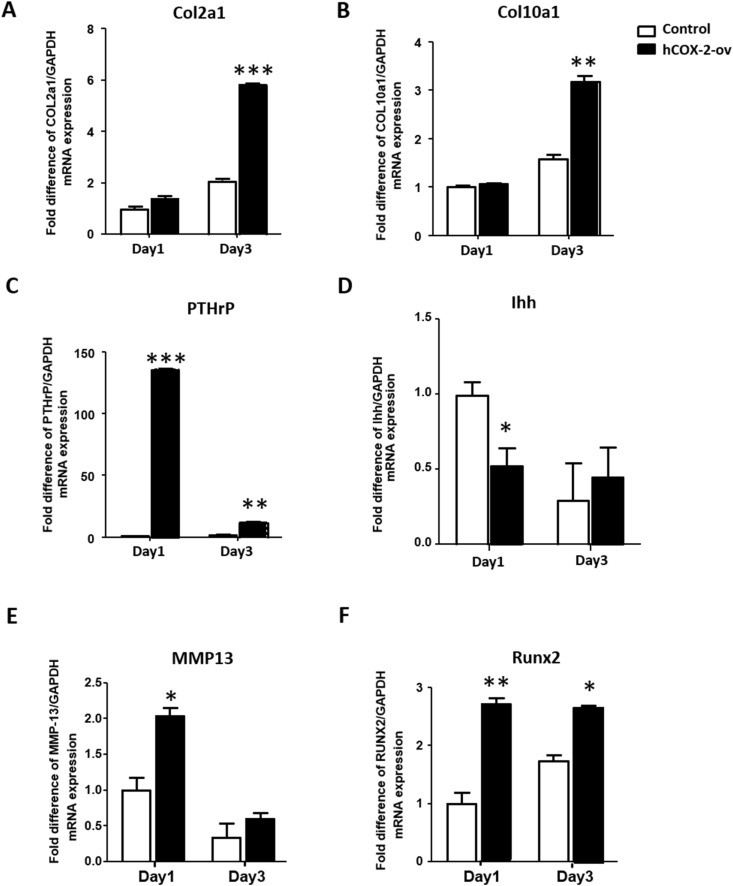
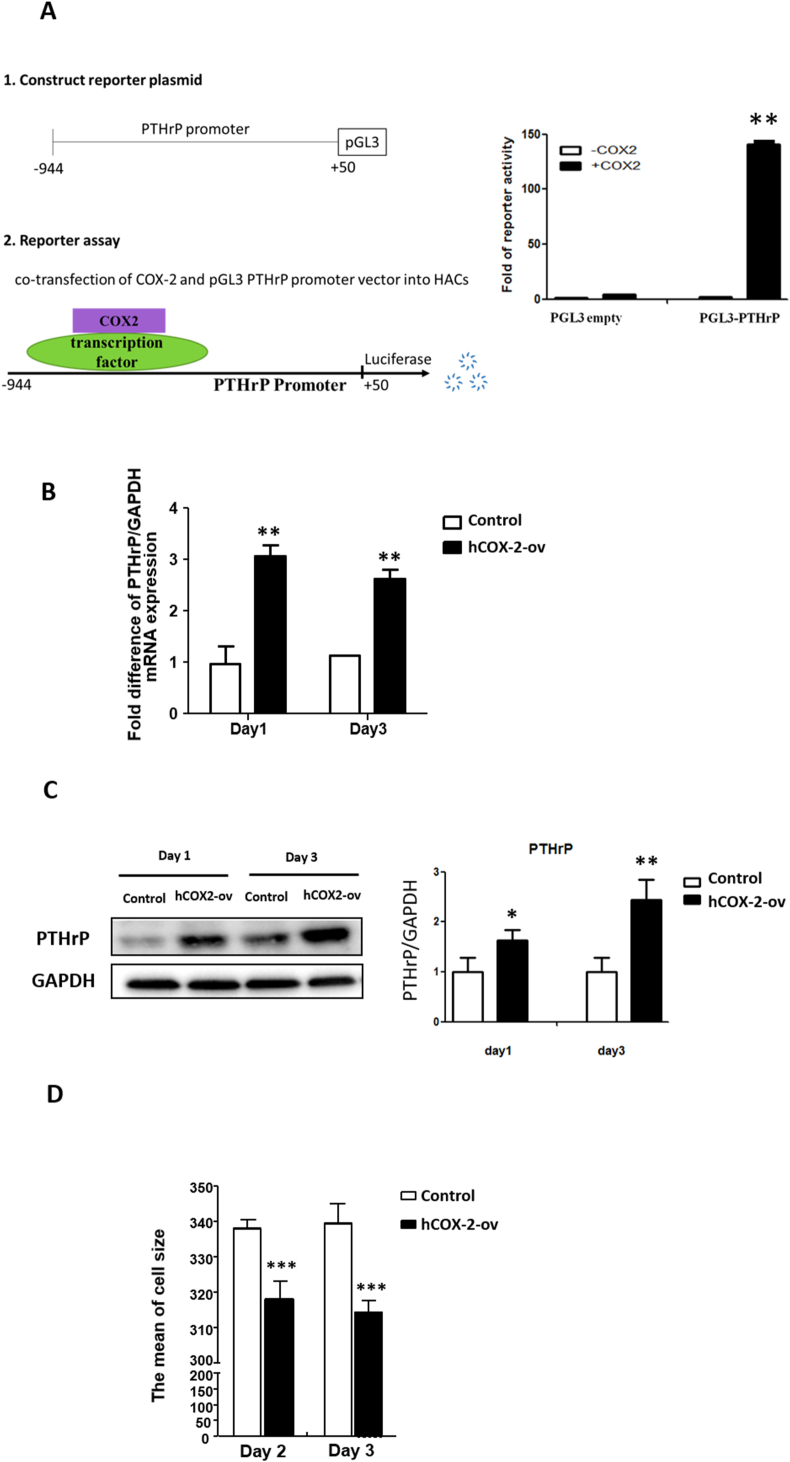
Results: In the OA rat study, COX-2 and PTHrP were simultaneously increased in osteoarthritic rat chondrocytes, while increased PTHrP levels were reduced by celecoxib, a COX-2 selective inhibitor. The levels of normal cartilage matrices, GAG and type II collagen decreased, while markers of degeneration, collagen type X and MMP13 were elevated in osteoarthritic articular chondrocytes. Celecoxib rescued the loss of GAG and the increased collagen type X and MMP13 levels. In vitro, COX-2 overexpression in HACs significantly increased Col2a1, Col10a1, PTHrP and MMP13 mRNA expression, which was decreased when COX-2 activity was suppressed. More importantly, COX-2 overexpression upregulated the PTHrP transcription, mRNA expression and protein levels.

Conclusion: COX-2 plays a pathophysiological role by preventing terminal differentiation of articular chondrocytes by upregulating PTHrP expression at the early stage of OA progression.

The translational potential of this article: COX2 up-regulates PTHrP expression in normal and OA articular chondrocytes.

Keywords: Articular chondrocytes; Cyclooxygenase-2 (COX-2); Osteoarthritis (OA); PTHrP; Terminal differentiation.


Conflict of interest statement

The authors declare no conflict of interest.

Figures

Figure 1
Figure 1
Celecoxib reverses glycosaminoglycan (GAG) content (A) Safranin O staining analysis of GAG content in articular cartilage of tibia sections in the OA ​+ ​Saline and OA ​+ ​Celec groups. The upper panel shows the contralateral control, and the lower panel shows the osteoarthritic articular cartilage (scale bars: 100 ​μm) ​(B) Comparison of the ratio of the Safranin O-stained area to total area (red/total) among all groups after 1, 3, and 5 weeks of celecoxib treatment. Each column shows the mean and SEM of 6 samples. Data were evaluated by one-way analysis of variance (ANOVA), and multiple comparisons were performed using Scheffe's test. ∗, P ​< ​0.05; ∗∗, P ​< ​0.01 compared to the control culture. #, P ​< ​0.05 compared to the OA ​+ ​Saline group.
Figure 2
Figure 2
Celecoxib reduces type X collagen, MMP13 and PTHrP levels and inhibits type II collagen expression in osteoarthritic articular cartilage (A) Immunohistochemical analysis of type X collagen (scale bars: 100 ​μm) (B) MMP13 (scale bars: 200 ​μm) (C) type II collagen, and (D) PTHrP (scale bars: 100 ​μm) in articular cartilage of tibia sections in the OA ​+ ​Saline and OA ​+ ​Celec groups. The histogram illustrates the quantification of the positively stained type X collagen and the relative density of MMP13, type II collagen and PTHrP expression in articular cartilage. Each column represents the mean ​± ​SEM of six samples. Data from each group were compared with those of the OA contralateral control group and were evaluated by one-way ANOVA and Scheffe's test. ∗, P ​< ​0.05; ∗∗, P ​< ​0.01; the OA ​+ ​Celec groups compared to the OA ​+ ​Saline groups #, P ​< ​0.05; ##, P ​< ​0.01.
Figure 2
Figure 2
Celecoxib reduces type X collagen, MMP13 and PTHrP levels and inhibits type II collagen expression in osteoarthritic articular cartilage (A) Immunohistochemical analysis of type X collagen (scale bars: 100 ​μm) (B) MMP13 (scale bars: 200 ​μm) (C) type II collagen, and (D) PTHrP (scale bars: 100 ​μm) in articular cartilage of tibia sections in the OA ​+ ​Saline and OA ​+ ​Celec groups. The histogram illustrates the quantification of the positively stained type X collagen and the relative density of MMP13, type II collagen and PTHrP expression in articular cartilage. Each column represents the mean ​± ​SEM of six samples. Data from each group were compared with those of the OA contralateral control group and were evaluated by one-way ANOVA and Scheffe's test. ∗, P ​< ​0.05; ∗∗, P ​< ​0.01; the OA ​+ ​Celec groups compared to the OA ​+ ​Saline groups #, P ​< ​0.05; ##, P ​< ​0.01.
Figure 3
Figure 3
COX-2 expression increases in hypertrophic growth plate cartilage and osteoarthritic articular cartilage. Immunohistochemical analysis of COX-2 (brown color) expression in the growth plate and articular cartilage of the tibia sections at 5 weeks in the OA and OA ​+ ​Celec groups (A) COX-2 is strongly expressed in the nuclei of hypertrophic chondrocytes but not in resting or proliferative chondrocytes in growth plate cartilage (bottom left panel). The right panel shows that COX-2 was mainly expressed near the cell membrane of hypertrophic chondrocytes (scale bar: 100 ​μm). The upper panel shows the no antibody control (B) High COX-2 expression was detected in osteoarthritic articular cartilage of tibial sections (upper and lower right panels) at the 5-week time points in the OA ​+ ​Saline and OA ​+ ​Celec groups but not in the contralateral control (upper and lower left panel) (scale bar: 100 ​μm). The bottom shows higher magnification of the boxed area (scale bar: 50 ​μm) (C) Histogram illustrating the relative density of COX-2 expression in articular cartilage. Each column represents the mean ​± ​SEM of six samples. Data from each group were compared with those of the OA contralateral control group and were evaluated by one-way ANOVA and Scheffe's test. ∗, P ​< ​0.05.
Figure 3
Figure 3
COX-2 expression increases in hypertrophic growth plate cartilage and osteoarthritic articular cartilage. Immunohistochemical analysis of COX-2 (brown color) expression in the growth plate and articular cartilage of the tibia sections at 5 weeks in the OA and OA ​+ ​Celec groups (A) COX-2 is strongly expressed in the nuclei of hypertrophic chondrocytes but not in resting or proliferative chondrocytes in growth plate cartilage (bottom left panel). The right panel shows that COX-2 was mainly expressed near the cell membrane of hypertrophic chondrocytes (scale bar: 100 ​μm). The upper panel shows the no antibody control (B) High COX-2 expression was detected in osteoarthritic articular cartilage of tibial sections (upper and lower right panels) at the 5-week time points in the OA ​+ ​Saline and OA ​+ ​Celec groups but not in the contralateral control (upper and lower left panel) (scale bar: 100 ​μm). The bottom shows higher magnification of the boxed area (scale bar: 50 ​μm) (C) Histogram illustrating the relative density of COX-2 expression in articular cartilage. Each column represents the mean ​± ​SEM of six samples. Data from each group were compared with those of the OA contralateral control group and were evaluated by one-way ANOVA and Scheffe's test. ∗, P ​< ​0.05.
Figure 4
Figure 4
Inhibition of COX-2 activity by celecoxib and DFU influences downstream targets in cultured HACs (A) Aggrecan (B) Col2a1 (C) Col10a1 (D) PTHrP, and (E) Ihh mRNA expression in vitro in cells treated with celecoxib and DFU (10−6–10−5 ​M) for 7 days. GAPDH mRNA was used as the internal control. Each column represents the mean ​± ​SEM of four replicate cultures. Data from each group were compared with those of the control group and were evaluated by one-way ANOVA and Scheffe's test. ∗, P ​< ​0.05; ∗∗, P ​< ​0.01 compared to the control culture.
Figure 5
Figure 5
The cytotoxic and apoptotic effects of COX-2 inhibitors on human articular chondrocytes (A) Cultures were treated with DFU and celecoxib (10-4 ​M, 10-5 ​M, or 10-6 ​M) for 48 ​h and then harvested to quantify cytotoxicity. Each column represents the lactate dehydrogenase (LDH) leakage mean ​± ​SEM of four replicate cultures. Data from the individual drug treatment experiments were evaluated by one-way ANOVA. ∗∗, P ​< ​0.01 compared to the control culture (B) Cultures were treated with celecoxib (10-4 ​M, 10-5 ​M, or 10-6 ​M) for 48 ​h and then harvested to measure cell apoptosis. The nuclei of apoptotic cells were positively stained by TUNEL and were DNA counterstained by DAPI. Each column represents the % of apoptotic cells as the mean ​± ​SEM of four replicate cultures. Data from each group were compared with those from the control cultures and were evaluated by one-way ANOVA. ∗, P ​< ​0.05; ∗∗, P ​< ​0.01 compared to the control culture.
Figure 6
Figure 6
Transient overexpression of COX-2 in HACs (A) qRT-PCR analysis of COX2 mRNA expression was determined following transfection with pcDNA3-COX-2 and control pcDNA3-empty vector for 1 and 3 days. GAPDH mRNA was used as the internal control. ∗∗∗, P ​< ​0.001 compared to the control pcDNA3-empty vector (B) Western blot analysis of COX-2 protein levels digitally detected and normalized to GAPDH levels as a loading control (left panel). Each bar represents the mean ​± ​SEM of three replicate cultures (right panel). Data from each group were compared with those of the control cultures and were evaluated by one-way ANOVA. ∗∗, P ​< ​0.01 compared to the control vector (C) Human PGE2 concentrations in the supernatant of COX-2-overexpressing chondrocytes measured using an ELISA kit. Each bar represents the mean ​± ​SEM of three replicate cultures. Data from each group were compared with those of the control cultures and were evaluated by one-way ANOVA. ∗, P ​< ​0.05; ∗∗, P ​< ​0.01 compared to the control vector (D) LDH leakage from cells was measured to quantify the cytotoxicity after transfection with pcDNA3.1-COX-2 and control pcDNA3.1-empty vector for 2 and 3 days. Each column represents the mean ​± ​SEM of six replicate cultures.
Figure 7
Figure 7
Overexpression of COX-2 increases Col2a1, Col10a1, PTHrP, MMP13 and Runx2 transcription (A) Col2a1 (B) Col10a1 (C) PTHrP (D) Ihh (E) MMP13, and (F) Runx2 mRNA expression was measured in vitro in cells transfected with pcDNA3.1-COX-2 and the control pcDNA3-empty vector for 1 and 3 days. GAPDH mRNA was used as the internal control. Each column represents the mean ​± ​SEM of four replicate cultures. Data from each group were compared with those of the control group and were evaluated by one-way ANOVA and Scheffe's test. ∗, P ​< ​0.05; ∗∗, P ​< ​0.01; ∗∗∗, P ​< ​0.001 compared to the control culture.
Figure 8
Figure 8
COX-2 promotes PTHrP expression by increasing PTHrP promoter activity and suppressing cell hypertrophy (A) Putative COX-2-binding motifs in the PTHrP reporter. The 5′-flanking region of the human PTHrP gene was subcloned into the pGL3 basic reporter. COX-2 activates PTHrP reporter activity in HACs. pcDNA3.1-COX-2 or pcDNA3.1-empty was cotransfected with the PTHrP (−944 to +50) reporter. The data are presented as the mean ​± ​SE of relative luciferase activity from three independent experiments performed in duplicate. ∗∗, P ​< ​0.01 compared to the pGL3-empty vector (B) qRT-PCR analysis of PTHrP mRNA expression was performed following transfection with pcDNA3-COX-2 and control pcDNA3-empty vector for 1 and 3 days. GAPDH mRNA was used as the internal control. ∗, P ​< ​0.05 compared to the control pcDNA3-empty vector (C) Western blot analysis of PTHrP protein levels digitally detected and normalized to GAPDH levels as a loading control (left panel). Each bar represents the mean ​± ​SEM of three replicate cultures (right panel). Data from the pcDNA3.1-COX-2 vector (hCOX2-ov) group were compared with those of the control pcDNA3.1-empty vector (control vector) group and were evaluated by one-way ANOVA. ∗∗, P ​< ​0.01 compared to the control vector (D) Flow cytometry evaluating the cell size after transfection of cells with pcDNA3.1-COX-2 and control pcDNA3.1-empty vector for 2 and 3 days. Representative results of the mean cell size are shown in the flow cytometry analysis (left panel). Each column represents the mean ​± ​SEM of six replicate cultures. ∗∗∗, P ​< ​0.001 compared to the control culture.

References

    1. Lee A.S., Ellman M.B., Yan D., Kroin J.S., Cole B.J., van Wijnen A.J. A current review of molecular mechanisms regarding osteoarthritis and pain. Gene. 2013;527(2):440–447. - PMC - PubMed
    1. Crofford L.J. Use of NSAIDs in treating patients with arthritis. Arthritis Res Ther. 2013;15(Suppl 3):S2. - PMC - PubMed
    1. Lanza F.L., Chan F.K., Quigley E.M. Practice parameters committee of the American college of G. Guidelines for prevention of NSAID-related ulcer complications. Am J Gastroenterol. 2009;104(3):728–738. - PubMed
    1. Laine L., White W.B., Rostom A., Hochberg M. COX-2 selective inhibitors in the treatment of osteoarthritis. Semin Arthritis Rheum. 2008;38(3):165–187. - PubMed
    1. Nakata K., Hanai T., Take Y., Osada T., Tsuchiya T., Shima D. Disease-modifying effects of COX-2 selective inhibitors and non-selective NSAIDs in osteoarthritis: a systematic review. Osteoarthritis Cartilage. 2018;26(10):1263–1273. - PubMed