. 2021 Aug 17;2(8):100360.
doi: 10.1016/j.xcrm.2021.100360.

Secreted retrovirus-like GAG-domain-containing protein PEG10 is regulated by UBE3A and is involved in Angelman syndrome pathophysiology

Affiliations

Secreted retrovirus-like GAG-domain-containing protein PEG10 is regulated by UBE3A and is involved in Angelman syndrome pathophysiology

Nikhil J Pandya et al. Cell Rep Med. .

Abstract

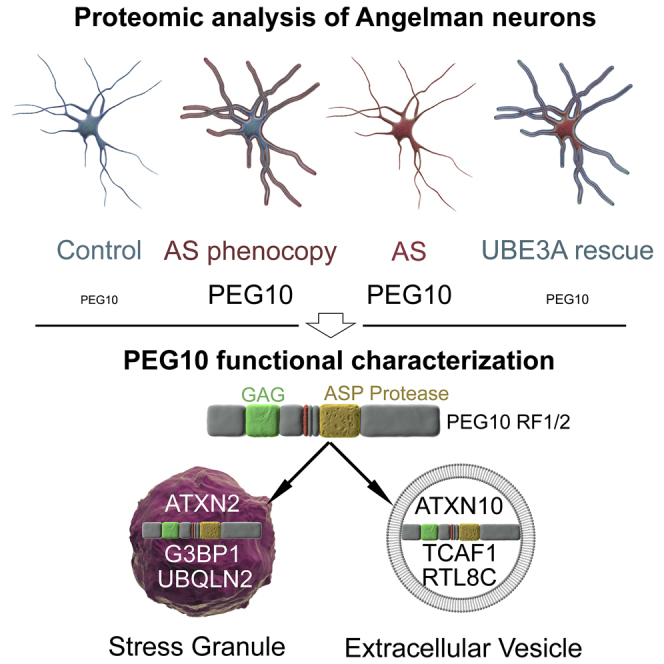
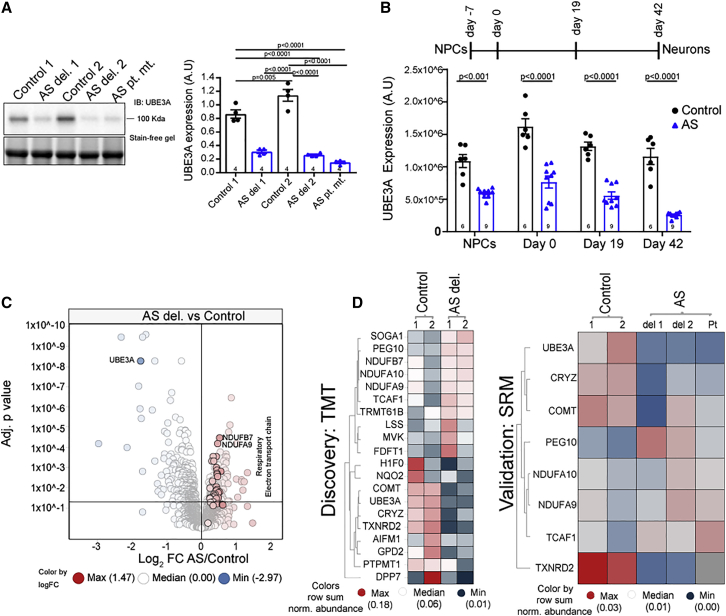
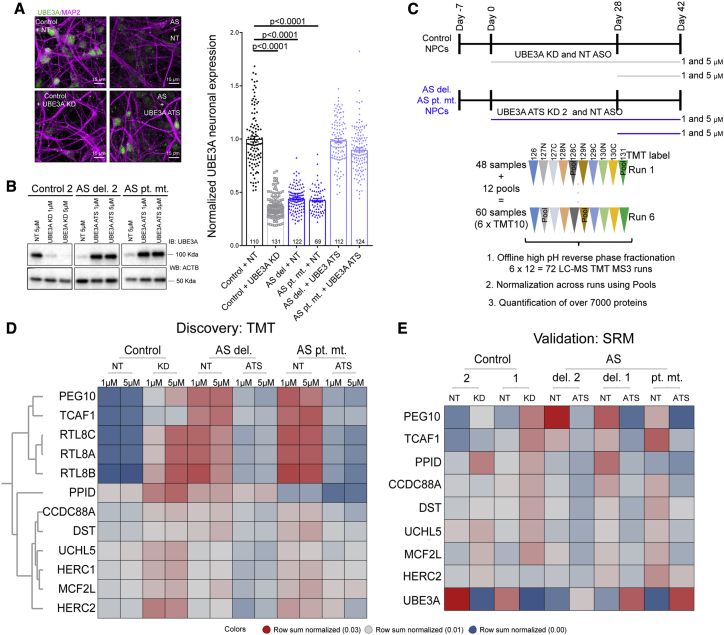
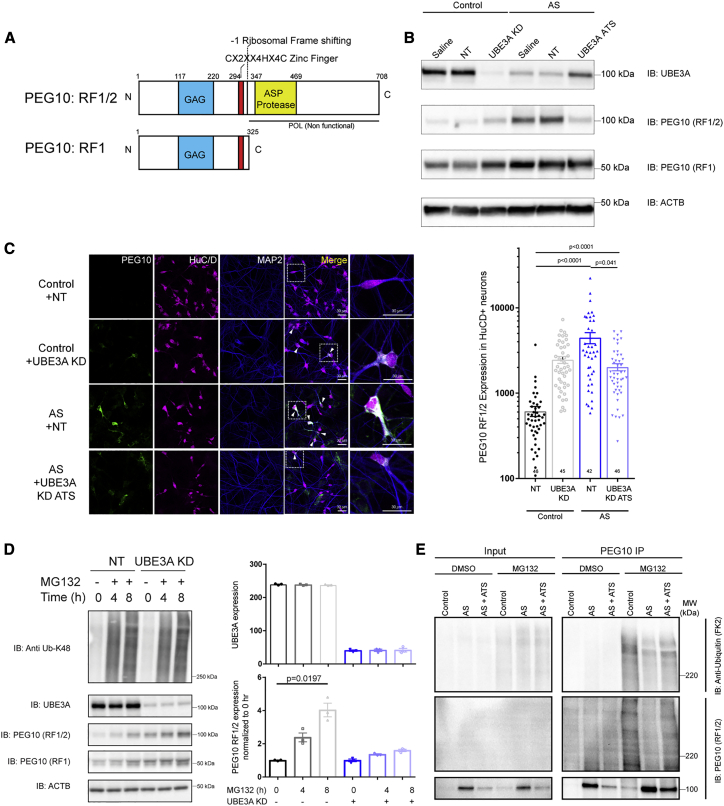
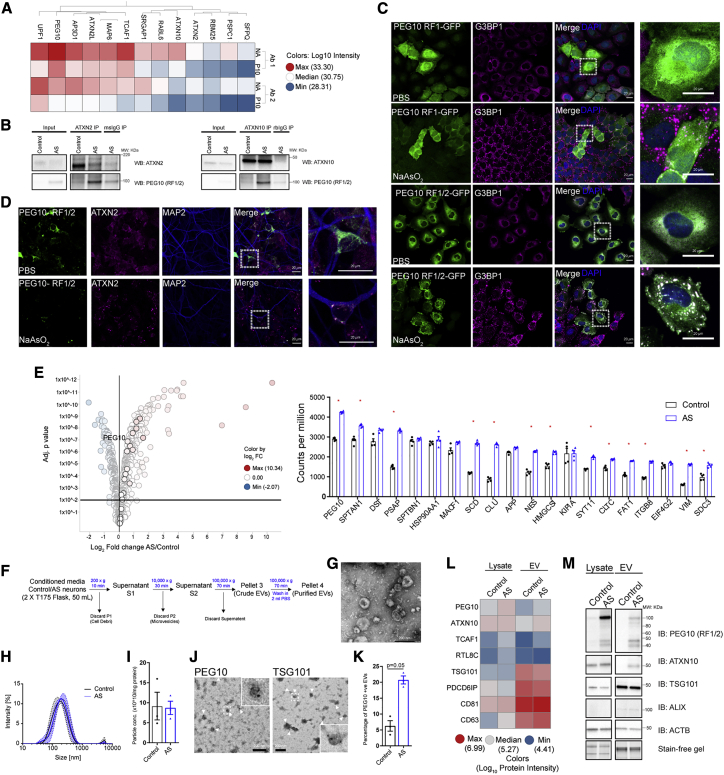
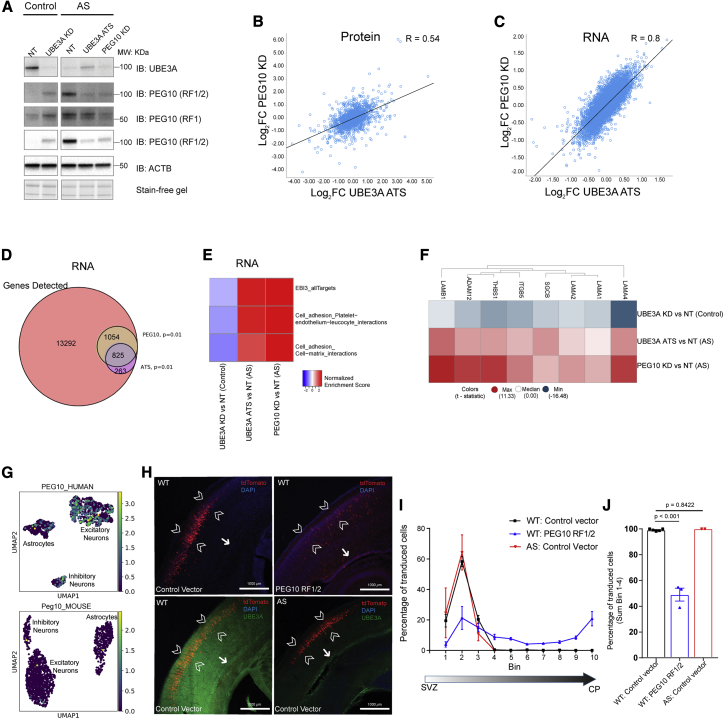
Angelman syndrome (AS) is a neurodevelopmental disorder caused by the loss of maternal UBE3A, a ubiquitin protein ligase E3A. Here, we study neurons derived from patients with AS and neurotypical individuals, and reciprocally modulate UBE3A using antisense oligonucleotides. Unbiased proteomics reveal proteins that are regulated by UBE3A in a disease-specific manner, including PEG10, a retrotransposon-derived GAG protein. PEG10 protein increase, but not RNA, is dependent on UBE3A and proteasome function. PEG10 binds to both RNA and ataxia-associated proteins (ATXN2 and ATXN10), localizes to stress granules, and is secreted in extracellular vesicles, modulating vesicle content. Rescue of AS patient-derived neurons by UBE3A reinstatement or PEG10 reduction reveals similarity in transcriptome changes. Overexpression of PEG10 during mouse brain development alters neuronal migration, suggesting that it can affect brain development. These findings imply that PEG10 is a secreted human UBE3A target involved in AS pathophysiology.

Keywords: Angelman syndrome; PEG10; RNA-binding protein; UBE3A; extracellular vesicles; hiPSC neurons; retroviral GAG; stress granules.


Conflict of interest statement

N.J.P., V.C., C.W., P.L., S.M., P.G., T.D., M.T., Y.M., B.B., C.P., S.R., M.H., M.B., T.K., T.D., M.E., and R.J. are employed by F. Hoffmann-La Roche. Parts of the work in this study have been filed in the patent WO2020/148310. The remaining authors declare no competing financial interests.

Figures

None
Graphical abstract
Figure 1
Figure 1
Angelman syndrome (del. and pt. mut.) patient-derived iPSC neurons recapitulate UBE3A loss and have an altered molecular profile (A) Left: immunoblot analysis of UBE3A in hiPSC-derived neurons from controls and patients with AS (deletions: AS del. 1 and AS del. 2; point mutation: AS pt. mut.). Right: quantification of UBE3A protein expression using immunoblotting. Values represent UBE3A signal intensities normalized to total protein using stain-free gel (n = 4 independent neuronal differentiations, p values: Holm-Sidak’s multiple comparison test). (B) Top: scheme of neuronal differentiation from hiPSC-derived NPCs to mature neurons. Bottom: SRM for UBE3A peptide peak areas in control and AS lines normalized to a peptide for β-actin in NPCs. Results for neurons at day 0, day 19, and mature neurons at day 42 (n = 3 independent differentiations with 2 control and 3 AS cell lines; p values: Holm-Sidak’s multiple comparison test). (C) Volcano plot showing differential protein expression as adjusted p value versus log2-fold change (FC) of AS del. versus control lines (n = 4 independent differentiations). All proteins of the mitochondrial complex 1 are highlighted, with NDUFB7 and NDUFA9 marked with largest effect sizes by p value. Dotted lines indicate adjusted p value cutoff at 0.05. (D) Left: heatmap of top 10 upregulated and downregulated proteins in AS del. versus control neurons. Right: SRM validation of subset of top 10 dysregulated proteins in AS del. and pt. mut. (n = 3 independent differentiations. Colors: row sum normalized intensities per protein).
Figure 2
Figure 2
UBE3A modulation reveals human UBE3A targets in AS neurons (A) Left: representative immunostaining UBE3A (green) and MAP2 (magenta) in control and AS neurons, in control cells with UBE3A knockdown (control + UBE3A KD), and UBE3A reinstatement in AS cells at day 42 with 1 μM antisense oligonucleotide (ASO) treatment (AS + UBE3A ATS). Scale bar: 15 μm. Right: quantification of the UBE3A signal in neuronal cell bodies of control and AS neuronal lines (AS del. and AS pt. mut.) treated with either non-targeting (NT) ASO or UBE3A KD ASO (for controls) or UBE3A-ATS KD ASO (for AS) (pooled results for 2 independent differentiations; each data point is represented by 1 neuron; p values adjusted for multiple comparisons by Kruskal-Wallis test; error bars are means ± SEMs). (B) Immunoblotting analysis of UBE3A expression in control and AS neurons at day 42 of differentiation upon chronic ASO treatment (42-day treatment, 1 and 5 μM ASO treatment). (C) Experimental design for proteomics analysis using TMT-MS3 for the identification of UBE3A targets in control and AS neurons. Neuronal lines: 1 control, 2 AS (deletion: del. 2; point mutation: pt. mut.). Neural progenitor cells (NPCs) were differentiated in 2 independent biologic replicates and treated with either NT ASO or UBE3A KD ASO for controls and NT ASO or UBE3A-ATS KD ASO for AS lines. ASO treatment was either for 2 weeks starting day 28 of neuronal differentiation or for 42 days starting from day 0 of neuronal differentiation. ASO were used at the 1 or 5 μM, resulting in a total of 48 samples (n = 2 independent differentiations per condition). Samples were randomly assigned to 6× TMT10s, with each TMT10 plex experiment containing 2 pooled samples, which were used for normalization across the different runs. (D) Heatmap of proteins significantly and inversely altered in a UBE3A and AS manner (adjusted p < 0.05 for control versus UBE3A KD and AS versus AS UBE3A-ATS KD; FC > 0). Data represent mean row sum normalized intensities per protein, n = 2). NT, NT ASO; KD, UBE3A KD ASO; ATS, UBE3A-ATS ASO. (E) Validation of UBE3A targets identified in (D) with SRM in control and AS lines with chronic treatment (starting at day 0) (n = 3, 3 independent differentiations per line; data represent mean row sum normalized intensities per protein).
Figure 3
Figure 3
UBE3A regulates the expression of retrotransposon-derived GAG protein PEG10 via the proteasome (A) PEG10 domain architecture: 2 isoforms, RF1/2 and RF1, are generated from the PEG10 transcript by a −1 ribosomal frameshift. Labels: GAG-like domain (blue), CCHC-zinc finger motif (red), and the aspartyl protease motif (ASP; yellow). Numbers indicate amino acid positions. (B) Immunoblotting analysis of UBE3A and PEG10 expression in control and AS deletion neurons. Saline: PBS treatment; NT, non-targeting ASO treatment; UBE3A KD, UBE3A KD ASO treatment; UBE3A-ATS KD, UBE3A reinstatement. (C) Left: representative immunostaining for PEG10-RF1/2 in control neurons without (+NT) and with UBE3A KD (+UBE3A KD) and in AS neurons without (+NT) and with UBE3A reinstatement (UBE3A ATS). Scale bar: 30 μm. Right: quantification of PEG10 fluorescence intensity in control and AS HuC/D+ neurons (data points are individual neurons from 2 independent neuronal differentiations; p values are adjusted for multiple comparisons based on Dunn’s multiple comparison test). (D) Left: immunoblotting analysis of UBE3A and PEG10 expression in control neurons at 0, 4, and 8 h after addition of proteasome inhibitor (MG132, 10 mM) with (UBE3A KD) and without (NT) UBE3A KD. Right: quantification of UBE3A and PEG10-RF1/2 expression after proteasome inhibition (n = 3 independent experiments, p values: Dunn’s multiple comparison test). (E) Immunoblotting analysis of PEG10 ubiquitination with PEG10 IP in control, AS, and AS+ATS treatment with proteasome inhibition (MG132, 10 mM, 6 h).
Figure 4
Figure 4
PEG10 binds to RNAs and RNA-binding proteins, localizes to stress granules and extracellular vesicles (EVs) in AS (A) IP-MS analysis of PEG10 binding partners in AS versus AS + PEG10 KD using 2 PEG10-specific antibodies (Ab 1, Ab 2). n = 4 independent IPs, values in heatmap represent average log10 label-free quantification (LFQ) intensities from MaxQuant; hits selected are enriched in PEG10 IPs with an adjusted p value cutoff of 0.001. NA, saline treatment; P10, PEG10 KD. (B) Validation of ATXN2 and ATXN10 binding to PEG10 in AS by IP-immunoblotting. (C) Representative immunostainings for PEG10-RF1-GFP and RF1/2-GFP expressed in H4 cells co-stained with G3BP1 after PBS treatment or treatment with 0.5 mM sodium arsenite (45 min; scale bar: 20 μm). (D) Representative immunostainings for PEG10-RF1/2 in AS neurons along with ATXN2 and MAP2 upon PBS or 0.5 mM sodium arsenate treatment (45 min; scale bar: 20 μm). (E) Left: volcano plot (adjusted p value versus log2 FC AS versus control) of PEG10 RNA immunoprecipitation sequencing (RIP-seq) in control and AS neurons representing the 1,000 most abundant transcripts in PEG10 IPs. Horizontal line represents adjusted p value cutoff of 0.05. Vertical line represents FC > 0. Right: the 20 most abundant transcripts in PEG10 IPs. Data are expressed as raw counts per million and are represented in descending order. Stars represent statistically significant enrichment in AS neurons versus control, adj. p < 0.05. (F) Schematic of EV isolation from human iPS-derived neurons. (G) Representative transmission electron microscope (TEM) images after uranyl acetate negative staining (magnification: 15,000×; scale bar: 200 nm). (H) Hydrodynamic diameter (Dh) of vesicles isolated from control and AS neurons analyzed by dynamic light scattering. Results are shown as means ± SEMs, n = 3 independent replicates for each line. (I) EV particle concentration (per mg EV protein) measurements from control and AS EVs analyzed by multi-angle dynamic light scattering (MALDS). Results are shown as means ± SEMs, n = 3 independent replicates from each line. (J) Representative immuno-EM measurements for PEG10-RF1/2 and TSG101 in EVs from AS cells (magnification: 15,000×; insert 4× magnification; scale bar: 200 nm). (K) Quantification of PEG10-RF1/2-positive EVs from control and AS cells (n = 3 independent EV preparations, p value: Mann-Whitney test). (L) LC-MS heatmap for PEG10 and its binding proteins and selected EV markers in control and AS lysates (values are protein-level intensities obtained from Spectronaut and are averages of 3 independent lysate and EV preparations). (M) Immunoblotting analysis for PEG10-RF1/2 and ATXN10 along with EV markers with equal total protein loaded for lysates and EVs (for quantification, see Figure S5D).
Figure 5
Figure 5
PEG10 regulates the neuronal transcriptome in a UBE3A-dependent manner and alters neuronal migration in vivo (A) Immunoblotting analysis for PEG10 and UBE3A in control neurons without (+NT) and with UBE3A KD (+UBE3A KD), and in AS neurons without (+NT) and with UBE3A reinstatement (UBE3A ATS KD), and with PEG10 KD. PEG10-RF1/2: 100 kDa; PEG10-RF1: 50 kDa. (B) Correlation analysis of FCs of proteins quantified using data-independent acquisition (DIA) upon PEG 10 KD versus UBE3A reinstatement (UBE3A-ATS KD) in AS neurons. R = 0.54, linear regression. (C) Correlation analysis of FCs of transcripts quantified using RNA-seq upon PEG 10 KD versus UBE3A reinstatement (UBE3A-ATS KD) in AS neurons. R = 0.8, linear regression. (D) Venn diagram depicting overlap of significantly (adjusted p < 0.01) altered transcripts upon PEG10 KD and UBE3A reinstatement (UBE3A ATS KD) in AS neurons using RNA-seq. (E) Pathways significantly increased (adjusted p < 0.05) upon PEG10 KD (PEG10 KD versus NT) and UBE3A reinstatement (UBE3A ATS KD versus NT) in AS neurons and downregulated upon UBE3A KD in control neurons (UBE3A KD versus NT). (F) Heatmap of T statistic of transcripts of the cell adhesion-cell matrix interaction network significantly downregulated upon UBE3A KD in control neurons (UBE3A KD versus NT) and increased upon PEG10 KD (PEG10 KD versus NT) and UBE3A reinstatement (UBE3A ATS KD versus NT) in AS neurons. (G) Single-cell RNA-seq data for PEG10 in human and mouse brains in clusters of excitatory neurons, inhibitory neurons, and astrocytes. Colors represent log2 FPKM (fragments per kilobase of transcript per million mapped reads) values. (H) Representative images of P1 WT and AS pups in utero electroporated at E14.5 with empty control vector or PEG10-RF1/2. tdTOMATO+ cells indicate the successfully targeted neurons. Arrowheads indicate the cortical plate (CP) of the somatosensory cortex, while the arrow indicates the subventricular zone (SVZ). Scale bar: 1,000 μm. (I) Quantification of percentage of electroporated cells (tdTomato expressing) in bins from SVZ to the CP for WT (black) and AS (red) pups with tdTOMATO empty vector and WT pups with PEG10-RF1/2_tdTOMATO construct (blue). (J) Quantitation of sum of percentage of cells in bins 1–4 (from the CP) (p values: Holm-Sidak multiple test).

Comment in

References

    1. Matsuura T., Sutcliffe J.S., Fang P., Galjaard R.J., Jiang Y.H., Benton C.S., Rommens J.M., Beaudet A.L. De novo truncating mutations in E6-AP ubiquitin-protein ligase gene (UBE3A) in Angelman syndrome. Nat. Genet. 1997;15:74–77. - PubMed
    1. Fang P., Lev-Lehman E., Tsai T.F., Matsuura T., Benton C.S., Sutcliffe J.S., Christian S.L., Kubota T., Halley D.J., Meijers-Heijboer H. The spectrum of mutations in UBE3A causing Angelman syndrome. Hum. Mol. Genet. 1999;8:129–135. - PubMed
    1. Cook E.H., Jr., Lindgren V., Leventhal B.L., Courchesne R., Lincoln A., Shulman C., Lord C., Courchesne E. Autism or atypical autism in maternally but not paternally derived proximal 15q duplication. Am. J. Hum. Genet. 1997;60:928–934. - PMC - PubMed
    1. Clayton-Smith J., Laan L. Angelman syndrome: a review of the clinical and genetic aspects. J. Med. Genet. 2003;40:87–95. - PMC - PubMed
    1. Buiting K., Williams C., Horsthemke B. Angelman syndrome - insights into a rare neurogenetic disorder. Nat. Rev. Neurol. 2016;12:584–593. - PubMed

Publication types

MeSH terms