

Regional and sociodemographic differences in average BMI among US children in the ECHO program
- PMID: 34467678
- PMCID: PMC9088705
- DOI: 10.1002/oby.23235
Regional and sociodemographic differences in average BMI among US children in the ECHO program
Abstract
Objective: The aim of this study was to describe the association of individual-level characteristics (sex, race/ethnicity, birth weight, maternal education) with child BMI within each US Census region and variation in child BMI by region.
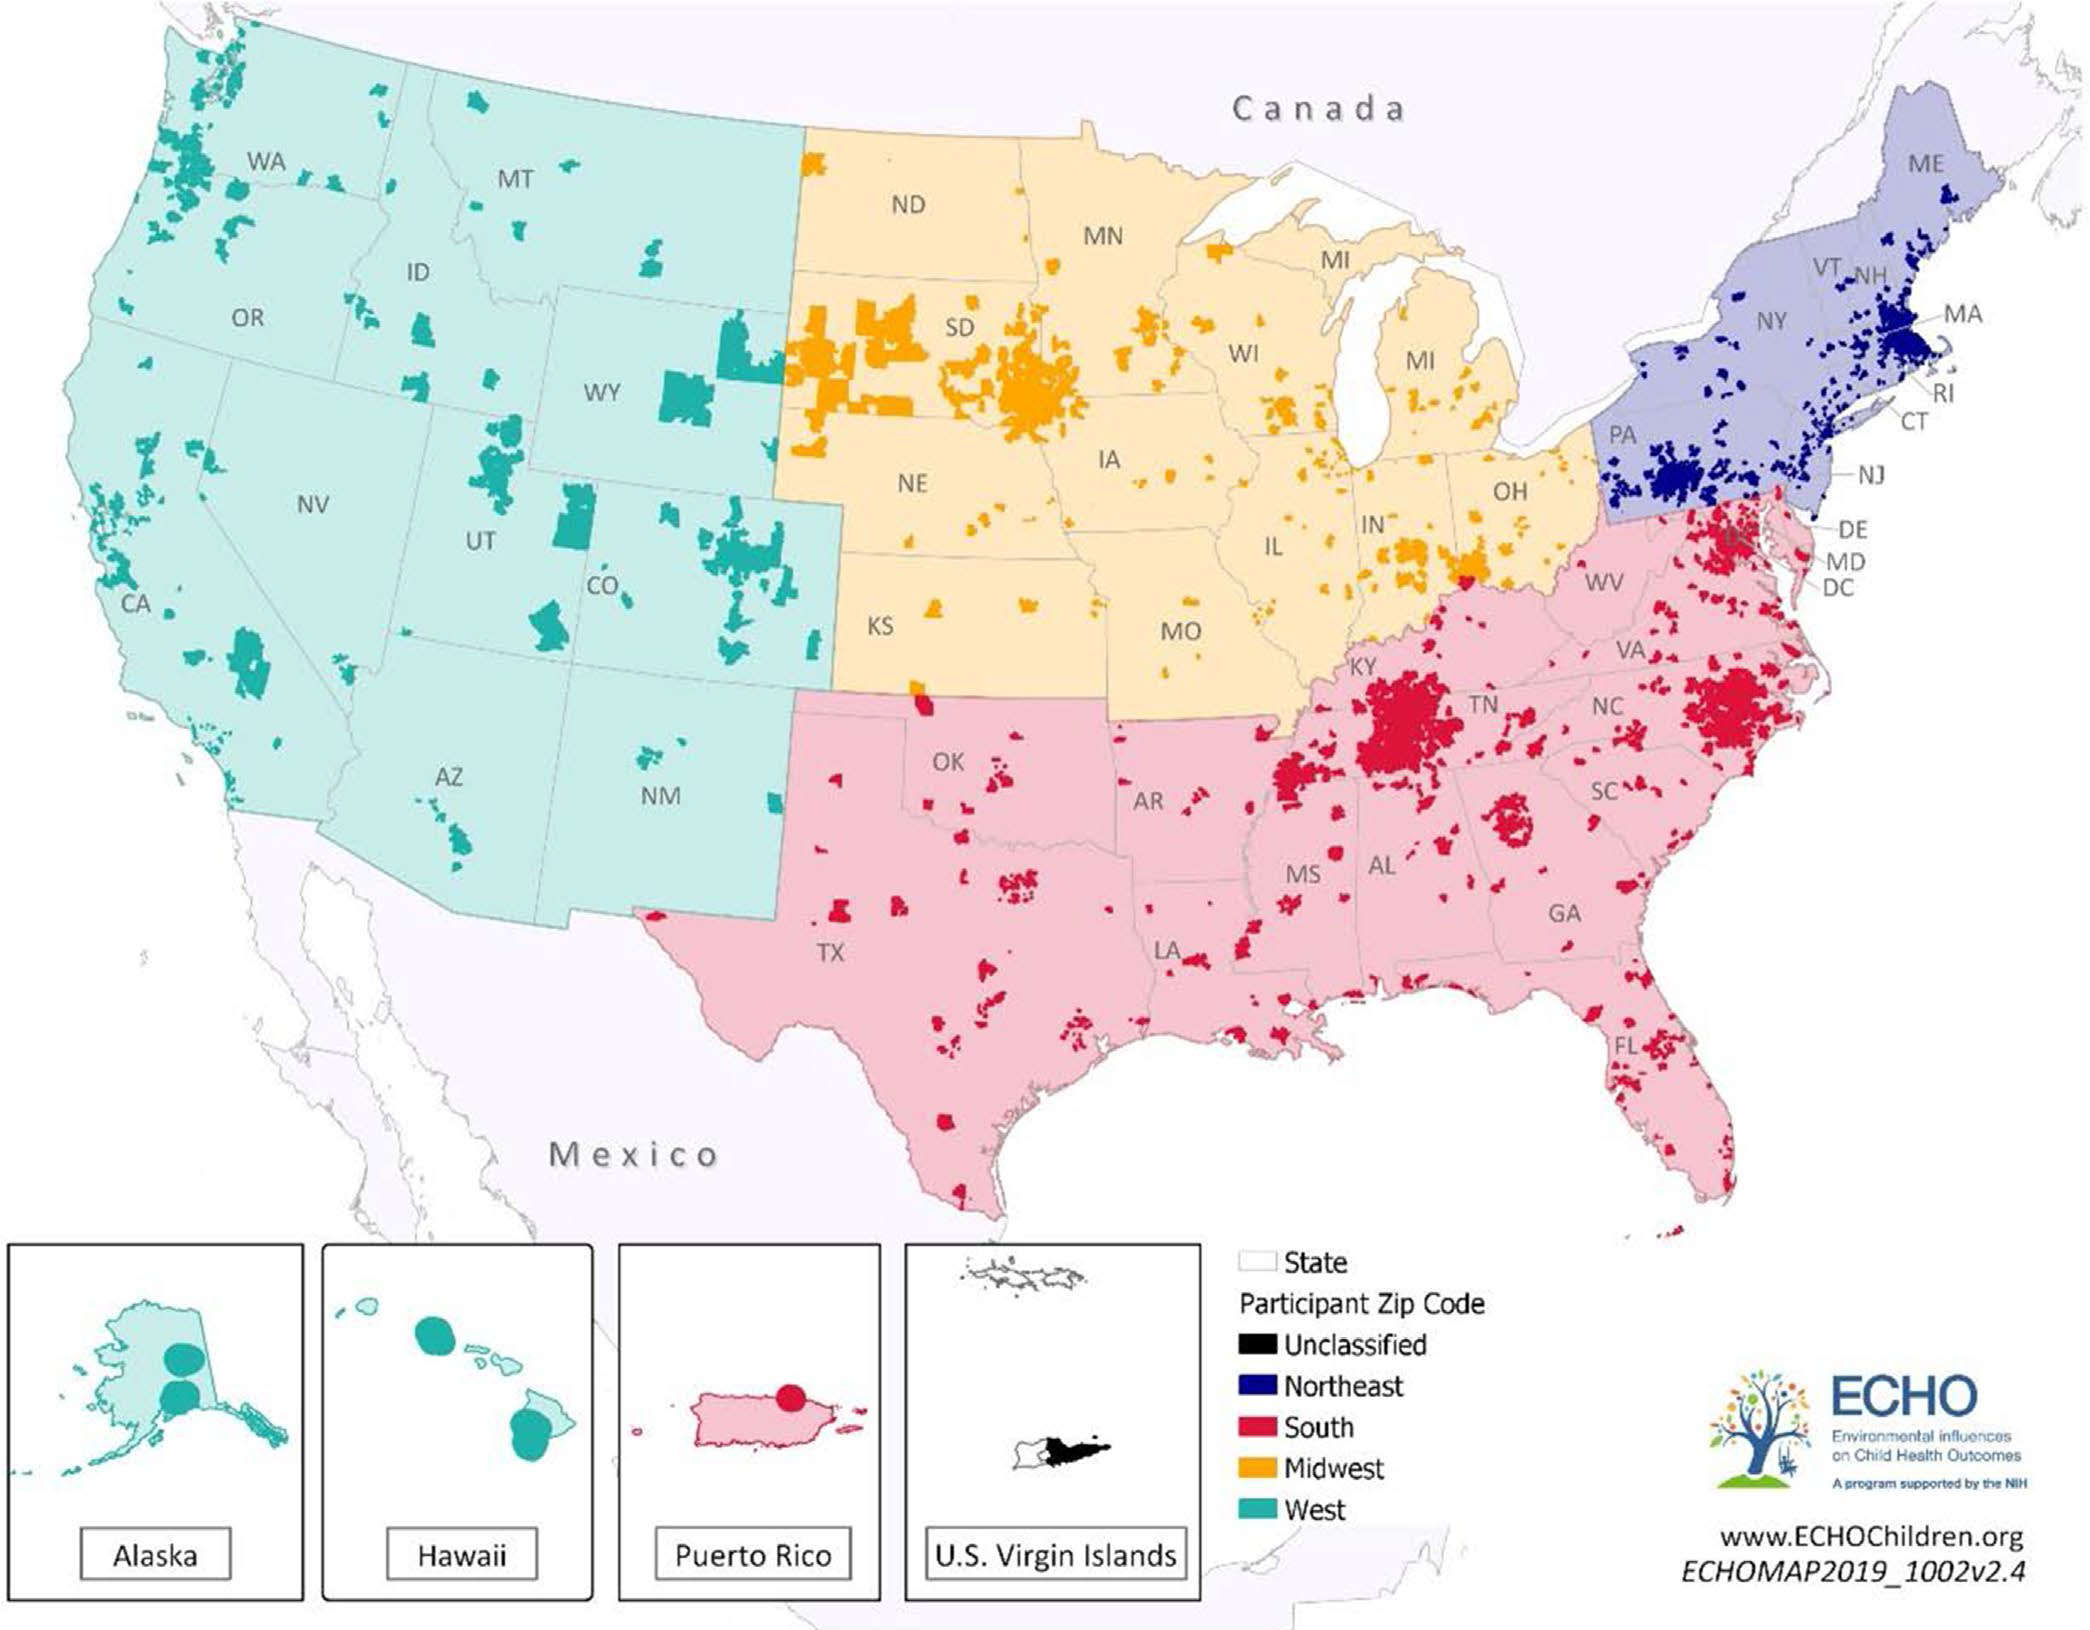
Methods: This study used pooled data from 25 prospective cohort studies. Region of residence (Northeast, Midwest, South, West) was based on residential zip codes. Age- and sex-specific BMI z scores were the outcome.
Results: The final sample included 14,313 children with 85,428 BMI measurements, 49% female and 51% non-Hispanic White. Males had a lower average BMI z score compared with females in the Midwest (β = -0.12, 95% CI: -0.19 to -0.05) and West (β = -0.12, 95% CI: -0.20 to -0.04). Compared with non-Hispanic White children, BMI z score was generally higher among children who were Hispanic and Black but not across all regions. Compared with the Northeast, average BMI z score was significantly higher in the Midwest (β = 0.09, 95% CI: 0.05 to 0.14) and lower in the South (β = -0.12, 95% CI: -0.16 to -0.08) and West (β = -0.14, 95% CI: -0.19 to -0.09) after adjustment for age, sex, race/ethnicity, and birth weight.
Conclusions: Region of residence was associated with child BMI z scores, even after adjustment for sociodemographic characteristics. Understanding regional influences can inform targeted efforts to mitigate BMI-related disparities among children.
© 2021 The Obesity Society.
Conflict of interest statement
CONFLICT OF INTEREST
Dr. Althoff reports personal fees from The All of Us study and from Trio Health. The other authors declared no conflict of interest.
Figures
Comment in
-
What can regional estimates of the prevalence of obesity tell us about what risk factors we should target?Obesity (Silver Spring). 2021 Dec;29(12):1992-1993. doi: 10.1002/oby.23272. Epub 2021 Sep 14. Obesity (Silver Spring). 2021. PMID: 34519157 No abstract available.
References
-
- Rahman T, Cushing RA, Jackson RJ. Contributions of built environment to childhood obesity. Mt Sinai J Med. 2011;78:49–57. - PubMed
-
- Caprio S, Daniels SR, Drewnowski A, et al. Influence of race, ethnicity, and culture on childhood obesity: implications for prevention and treatment. Obesity (Silver Spring). 2008;16(12):2566–2577. - PubMed
Publication types
MeSH terms
Grants and funding
- U24OD023319/NH/NIH HHS/United States
- U2C OD023375/OD/NIH HHS/United States
- UH3 OD023248/OD/NIH HHS/United States
- P30 ES007033/ES/NIEHS NIH HHS/United States
- UG3 OD023282/OD/NIH HHS/United States
- UH3 OD023365/OD/NIH HHS/United States
- U24 OD023382/OD/NIH HHS/United States
- UH3 OD023289/OD/NIH HHS/United States
- UH3 OD023249/OD/NIH HHS/United States
- UH3 OD023389/OD/NIH HHS/United States
- UH3 OD023290/OD/NIH HHS/United States
- UH3 OD023285/OD/NIH HHS/United States
- UG3 OD035517/OD/NIH HHS/United States
- U2COD023375/NH/NIH HHS/United States
- UG3 OD023248/OD/NIH HHS/United States
- UH3 OD023275/OD/NIH HHS/United States
- UH3 OD023318/OD/NIH HHS/United States
- UG3 OD023244/OD/NIH HHS/United States
- UH3 OD023271/OD/NIH HHS/United States
- UG3 OD023337/OD/NIH HHS/United States
- UH3 OD023282/OD/NIH HHS/United States
- UG3 OD023271/OD/NIH HHS/United States
- UG3 OD023328/OD/NIH HHS/United States
- UG3 OD023389/OD/NIH HHS/United States
- UG3 OD023288/OD/NIH HHS/United States
- U24 OD023319/OD/NIH HHS/United States
- P30 ES023513/ES/NIEHS NIH HHS/United States
- UG3 OD023365/OD/NIH HHS/United States
- UH3 OD023253/OD/NIH HHS/United States
- UH3 OD023279/OD/NIH HHS/United States
- UG1 HD090904/HD/NICHD NIH HHS/United States
- UG1 OD024954/OD/NIH HHS/United States
- UH3 OD023288/OD/NIH HHS/United States
- U24OD023382/NH/NIH HHS/United States
- UG3 OD023289/OD/NIH HHS/United States
- UG3 OD023275/OD/NIH HHS/United States
- UG3 OD023253/OD/NIH HHS/United States
- U19 AI095227/AI/NIAID NIH HHS/United States
- R24 ES029490/ES/NIEHS NIH HHS/United States
- UH3 OD023244/OD/NIH HHS/United States
- UG1 OD024956/OD/NIH HHS/United States
- UG3 OD023285/OD/NIH HHS/United States
- UH3 OD023337/OD/NIH HHS/United States
- UG3 OD023318/OD/NIH HHS/United States
- UG3 OD023249/OD/NIH HHS/United States
- UG3 OD023290/OD/NIH HHS/United States
- UG3 OD023279/OD/NIH HHS/United States
- UG3 OD035516/OD/NIH HHS/United States
- UH3 OD023328/OD/NIH HHS/United States
LinkOut - more resources
Full Text Sources
Molecular Biology Databases
