. 2021 Sep 15;13(36):43221-43232.
doi: 10.1021/acsami.1c09825. Epub 2021 Sep 1.

Long-Lived Ensembles of Shallow NV- Centers in Flat and Nanostructured Diamonds by Photoconversion

Affiliations

Long-Lived Ensembles of Shallow NV- Centers in Flat and Nanostructured Diamonds by Photoconversion

Federico Gorrini et al. ACS Appl Mater Interfaces. .

Abstract

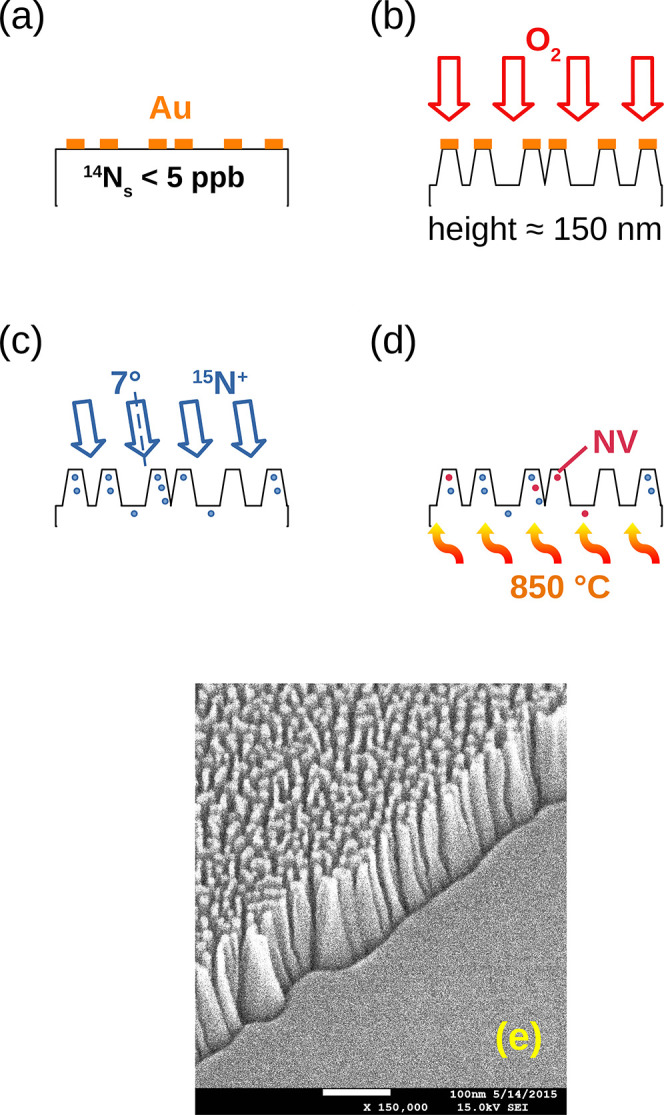
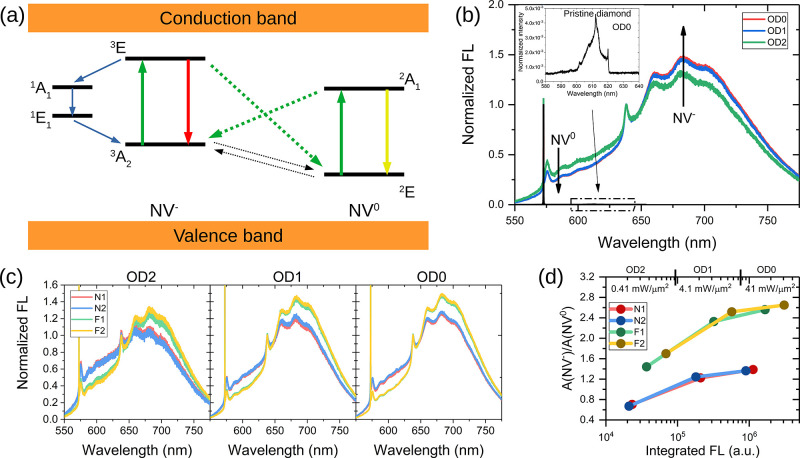
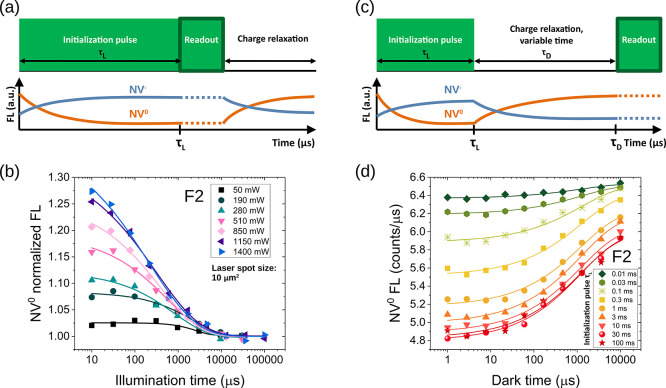
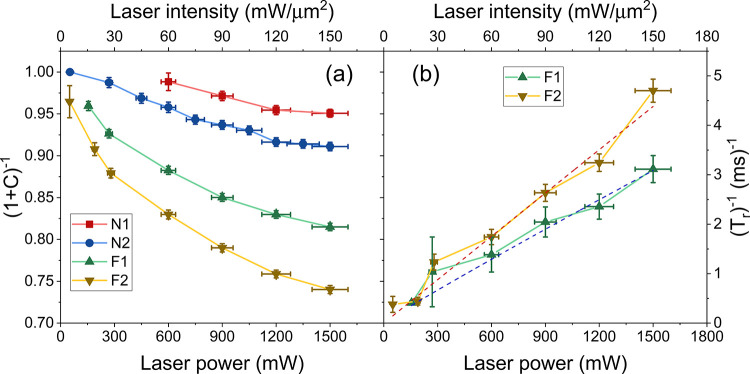
Shallow, negatively charged nitrogen-vacancy centers (NV-) in diamond have been proposed for high-sensitivity magnetometry and spin-polarization transfer applications. However, surface effects tend to favor and stabilize the less useful neutral form, the NV0 centers. Here, we report the effects of green laser irradiation on ensembles of nanometer-shallow NV centers in flat and nanostructured diamond surfaces as a function of laser power in a range not previously explored (up to 150 mW/μm2). Fluorescence spectroscopy, optically detected magnetic resonance (ODMR), and charge-photoconversion detection are applied to characterize the properties and dynamics of NV- and NV0 centers. We demonstrate that high laser power strongly promotes photoconversion of NV0 to NV- centers. Surprisingly, the excess NV- population is stable over a timescale of 100 ms after switching off the laser, resulting in long-lived enrichment of shallow NV-. The beneficial effect of photoconversion is less marked in nanostructured samples. Our results are important to inform the design of samples and experimental procedures for applications relying on ensembles of shallow NV- centers in diamond.

Keywords: NV0; diamond; nanostructures; nitrogen-vacancy centers; photoconversion; surface effects.


Conflict of interest statement

The authors declare no competing financial interest.

Figures

Figure 1
Figure 1
Nanofabrication process and synthesis of shallow NV centers in nanostructured samples. Electronic grade diamond with a very low concentration of nitrogen, less than 5 ppb, was masked with gold by sputtering (a) and then etched using oxygen reactive ion etching (b) to fabricate nanostructures, onto which nitrogen was implanted after gold removal (c). Samples were then annealed (d). SEM images show ≈150 nm high nanopillar-like structures (e). The SEM image was taken between steps (b) and (c), with still some conductive gold on the tips to improve image quality. Flat samples were implanted with 15N ions and then annealed, without application of any etching procedure.
Figure 2
Figure 2
Fluorescence properties of NV centers. Electronic structures of NV and NV0 centers are represented in (a). Green arrows indicate optical excitation and photoconversion (continuous and dotted arrows, respectively). Red and yellow arrows denote radiative decay from NV and NV0 centers. Blue arrows indicate the nonradiative pathway, which leads to polarization of the ms = 0 NV ground state. Black arrows represent tunneling transitions in the dark between the two charged states. (b) Both NV and NV0 fluorescence spectra were detected in implanted samples; no signal was detectable in nonimplanted, nonannealed samples (inset). Notably, emission from NVs increases with laser power, at the expense of NV0s. (c): the FL of nanostructured samples is lower compared to flat samples at all laser power levels (indicated by the filter optical density (OD)), with a larger component of NV0. The ratio of NV and NV0 FL intensities is plotted in (d), as a function of total integrated fluorescence and laser intensity. The NV/NV0 ratio increases with laser power in all samples and is systematically larger in flat samples.
Figure 3
Figure 3
Detection of charge dynamics. (a) Pulse sequence adopted to investigate charge dynamics under laser pumping, for variable irradiation pulse length τL. Laser-induced NV0 → NV photoconversion results in a decrease of the NV0 signal and an increase of the NV. As an example, panel (b) shows the decrease in NV0 FL for sample F2, as measured in the 550–600 nm window, for different laser powers. (c) Pulse sequence used to detect the charge recovery in the dark after a preparation pulse. Recovery of NV0 FL for sample F2 at a laser power of 625 mW is shown in panel (d). Various curves in panel (d) correspond to different durations of the initialization pulse.
Figure 4
Figure 4
Parameters describing NV0 → NV photoconversion under laser irradiation. The quantity (1 + C)−1 in (a) indicates the ratio between the equilibrium value of FL and the initial value, right after the initialization pulse. The decrement is more consistent for the flat samples (down to 75% for sample F2). The photoconversion rate (Tr)−1 displayed in (b) is nearly linear with laser power, following a power law with exponents of 0.95 ± 0.07 for F1 and 1 ± 0.07 for F2 (red and blue dashed curves).
Figure 5
Figure 5
Spin and charge dynamics after the laser pulse. The effect of a strong magnetic field (750 G) on the fluorescence of sample F2 at a laser power of 1500 mW is shown in (a). FL was collected in the 550–600 nm region (blue curves) and in the >750 nm window (red curves), with and without magnetic field (empty and solid symbols, respectively). When considering only the NV0 centers (550–600 nm window), no change in the FL profile is observed, irrespective of the magnetic field applied. On the contrary, the signal in the >750 nm window is reduced by a strong magnetic field. This difference is the result of quenching NV spin polarization through spin state mixing. However, beyond ≈10 ms, the difference vanishes, and the evolution at longer times is dominated by charge dynamics. At low (b) and high (c) laser powers, the 10 ms laser pulse creates an excess of NVs (red curve) that convert to NV0s (blue curve) in the dark. NV and NV0 populations are normalized such that their sum is 1 (yellow-azure curve). The ratio R is indicated by the black curve. A near-equilibrium ratio (0.15) is reached after 100 ms at low power (50 mW), while a large and sustained R (1.13) value is observed after high power irradiation (1500 mW). Results of (b) and (c) are taken at a magnetic field of 750 G, which enables determining the charge state ratio (for more details, see the text or Section S4 of the Supporting Information).
Figure 6
Figure 6
Optically detected magnetic resonance. (a) ODMR spectra from sample F2 as a function of laser power. (b) ODMR contrast for all samples. The increase, in contrast, is more pronounced for flat samples.

References

    1. Kucsko G.; Maurer P. C.; Yao N. Y.; Kubo M.; Noh H. J.; Lo P. K.; Park H.; Lukin M. D. Nanometre-Scale Thermometry in a Living Cell. Nature 2013, 500, 54–58. 10.1038/nature12373. - DOI - PMC - PubMed
    1. Singam S. K. R.; Nesladek M.; Goovaerts E. Nitrogen-Vacancy Nanodiamond Based Local Thermometry Using Frequency-Jump Modulation. Nanotechnology 2020, 31, 10550110.1088/1361-6528/ab5a0c. - DOI - PubMed
    1. Davis H. C.; Ramesh P.; Bhatnagar A.; Lee-Gosselin A.; Barry J. F.; Glenn D. R.; Walsworth R. L.; Shapiro M. G. Mapping the Microscale Origins of Magnetic Resonance Image Contrast with Subcellular Diamond Magnetometry. Nat. Commun. 2018, 9, 13110.1038/s41467-017-02471-7. - DOI - PMC - PubMed
    1. Schloss J. M.; Barry J. F.; Turner M. J.; Walsworth R. L. Simultaneous Broadband Vector Magnetometry Using Solid-State Spins. Phys. Rev. Appl. 2018, 10, 03404410.1103/PhysRevApplied.10.034044. - DOI
    1. Iwasaki T.; Naruki W.; Tahara K.; Makino T.; Kato H.; Ogura M.; Takeuchi D.; Yamasaki S.; Hatano M. Direct Nanoscale Sensing of the Internal Electric Field in Operating Semiconductor Devices Using Single Electron Spins. ACS Nano 2017, 11, 1238–1245. 10.1021/acsnano.6b04460. - DOI - PubMed