. 2021 Oct 31;9(2):e0069221.
doi: 10.1128/Spectrum.00692-21. Epub 2021 Sep 1.

Biodesulfurization Induces Reprogramming of Sulfur Metabolism in Rhodococcus qingshengii IGTS8: Proteomics and Untargeted Metabolomics

Affiliations

Biodesulfurization Induces Reprogramming of Sulfur Metabolism in Rhodococcus qingshengii IGTS8: Proteomics and Untargeted Metabolomics

Aurélie Hirschler et al. Microbiol Spectr. .

Abstract

Sulfur metabolism in fuel-biodesulfurizing bacteria and the underlying physiological adaptations are not understood, which has impeded the development of a commercially viable bioprocess for fuel desulfurization. To fill these knowledge gaps, we performed comparative proteomics and untargeted metabolomics in cultures of the biodesulfurization reference strain Rhodococcus qingshengii IGTS8 grown on either inorganic sulfate or the diesel-borne organosulfur compound dibenzothiophene as a sole sulfur source. Dibenzothiophene significantly altered the biosynthesis of many sulfur metabolism proteins and metabolites in a growth phase-dependent manner, which enabled us to reconstruct the first experimental model for sulfur metabolism in a fuel-biodesulfurizing bacterium. All key pathways related to assimilatory sulfur metabolism were represented in the sulfur proteome, including uptake of the sulfur sources, sulfur acquisition, and assimilatory sulfate reduction, in addition to biosynthesis of key sulfur-containing metabolites such as S-adenosylmethionine, coenzyme A, biotin, thiamin, molybdenum cofactor, mycothiol, and ergothioneine (low-molecular weight thiols). Fifty-two proteins exhibited significantly different abundance during at least one growth phase. Sixteen proteins were uniquely detected and 47 proteins were significantly more abundant in the dibenzothiophene culture during at least one growth phase. The sulfate-free dibenzothiophene-containing culture reacted to sulfate starvation by restricting sulfur assimilation, enforcing sulfur-sparing, and maintaining redox homeostasis. Biodesulfurization triggered alternative pathways for sulfur assimilation different from those operating in the inorganic sulfate culture. Sulfur metabolism reprogramming and metabolic switches in the dibenzothiophene culture were manifested in limiting sulfite reduction and biosynthesis of cysteine, while boosting the production of methionine via the cobalamin-independent pathway, as well as the biosynthesis of the redox buffers mycothiol and ergothioneine. The omics data underscore the key role of sulfur metabolism in shaping the biodesulfurization phenotype and highlight potential targets for improving the biodesulfurization catalytic activity via metabolic engineering. IMPORTANCE For many decades, research on biodesulfurization of fossil fuels was conducted amid a large gap in knowledge of sulfur metabolism and its regulation in fuel-biodesulfurizing bacteria, which has impeded the development of a commercially viable bioprocess. In addition, lack of understanding of biodesulfurization-associated metabolic and physiological adaptations prohibited the development of efficient biodesulfurizers. Our integrated omics-based findings reveal the assimilatory sulfur metabolism in the biodesulfurization reference strain Rhodococcus qingshengii IGTS8 and show how sulfur metabolism and oxidative stress response were remodeled and orchestrated to shape the biodesulfurization phenotype. Our findings not only explain the frequently encountered low catalytic activity of native fuel-biodesulfurizing bacteria but also uncover unprecedented potential targets in sulfur metabolism that could be exploited via metabolic engineering to boost the biodesulfurization catalytic activity, a prerequisite for commercial application.

Keywords: 4S pathway; cysteine biosynthesis; dibenzothiophene; mycothiol; sulfate activation complex; sulfate starvation.


Figures
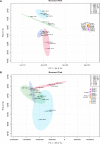
FIG 1
FIG 1
Principal-component analysis for (A) proteins and (B) metabolites related to sulfur metabolism using the two main dimensions. DBT indicates the dibenzothiophene culture and IS indicates the inorganic sulfate culture. The growth phases are abbreviated as EL (early log), ML (mid-log), LL (late log), and SP (stationary phase). The number shown after the growth phase indicates the number of the replicates.
FIG 2
FIG 2
A proposed model for assimilatory sulfur metabolism in R. qingshengii IGTS8 under both sulfate starvation (biodesulfurization, highlighted in light yellow) and sulfate-rich (highlighted in light gray) conditions. Proteins and metabolites in blue font are significantly more abundant in the dibenzothiophene culture at least during one growth phase, while those appearing in red font are significantly more abundant in the inorganic sulfate culture at least during one growth phase. The abundance of proteins and metabolites appearing in green font was not significantly different between the dibenzothiophene and inorganic sulfate cultures. Proteins in black font were either not detected or detected but could not be quantified (see Table 1 and Tables S1 and S3 for details of the abundance profiles). PAP, 3′-phosphoadenosine 5′-phosphate.
FIG 3
FIG 3
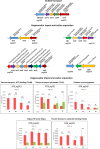
Gene clusters and proteins of sulfur source uptake and sulfur acquisition (see Table S1 for details of the abundance profiles and proposed functions of the proteins). Protein annotations are shown above the gene clusters, and gene names and IDs of the first and last genes are shown below the gene clusters. The growth phases are abbreviated as EL (early log), ML (mid-log), LL (late log), and SP (stationary phase). Bar charts represent the label-free quantification (LFQ) values showing the abundance profile of proteins encoded by a putative taurine transport operon in both the DBT (dibenzothiophene) and IS (inorganic sulfate) cultures. Significance of the data is attested by a Welsch moderated t test as follows: NS for P > 0.05, * for P ≤ 0.05, ** for P ≤ 0.01, *** for P ≤ 0.001, **** for P ≤ 0.0001, DS for a protein which was uniquely identified in the dibenzothiophene cultures but not detected in the sulfate cultures, D for a protein which was identified but not confidently quantified.
FIG 4
FIG 4
Gene clusters and proteins of sulfate/sulfite activation and reduction (see Table S1 for details of the abundance profiles and proposed functions of the proteins). Protein annotations are shown above the gene clusters, and gene names and IDs of the first and last genes are shown below the gene clusters. The growth phases are abbreviated as EL (early log), ML (mid-log), LL (late log), and SP (stationary phase). Bar charts represent the label-free quantification (LFQ) values showing the abundance profile of the proteins in both the DBT (dibenzothiophene) and IS (inorganic sulfate) cultures. Significance of the data is attested by a Welch moderated t test as follows: NS for P > 0.05, * for P ≤ 0.05, ** for P ≤ 0.01, *** for P ≤ 0.001, **** for P ≤ 0.0001, DS for a protein which was uniquely identified in the dibenzothiophene cultures but not detected in the sulfate cultures, D for a protein which was identified but not confidently quantified.
FIG 5
FIG 5
Proteins and metabolites of dibenzothiophene biodesulfurization via the 4S pathway (see Table S1 for details of the abundance profiles and proposed functions of the proteins). The growth phases are abbreviated as EL (early log), ML (mid-log), LL (late log), and SP (stationary phase). Bar charts represent the label-free quantification (LFQ) values showing the abundance profile of the proteins in both the DBT (dibenzothiophene) and IS (inorganic sulfate) cultures. Significance of the data is attested by a Welch moderated t test as follows: NS for P > 0.05, * for P ≤ 0.05, ** for P ≤ 0.01, *** for P ≤ 0.001, **** for P ≤ 0.0001, DS for a protein which was uniquely identified in the dibenzothiophene cultures but not detected in the sulfate cultures, D for a protein which was identified but not confidently quantified. Metabolomics data are shown as boxplots displaying the distribution for each growth phase with the minimum, maximum, and median values for the dibenzothiophene (DBT) and inorganic sulfate (IS) cultures. Significance of the data (P value [rank], Wilcoxon test) is indicated by asterisks: * for P < 0.01, ** for P < 0.05, *** for P < 0.1, no asterisk for P > 0.1.
FIG 6
FIG 6
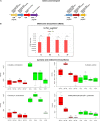
(A) Gene clusters of amino acid transport. (B) Proteins and metabolites of methionine and cysteine biosynthesis (see Table S1 for details of the abundance profiles and proposed functions of the proteins). Protein annotations are shown above the gene clusters, and gene names and IDs of the first and last genes are shown below the gene clusters. The growth phases are abbreviated as EL (early log), ML (mid-log), LL (late log), and SP (stationary phase). Bar charts represent the label-free quantification (LFQ) values showing the abundance profile of MetE in both the DBT (dibenzothiophene) and IS (inorganic sulfate) cultures. Significance of the data is attested by a Welch moderated t test as follows: NS for P > 0.05, * for P ≤ 0.05, ** for P ≤ 0.01, *** for P ≤ 0.001, **** for P ≤ 0.0001, DS for a protein which was uniquely identified in the dibenzothiophene cultures but not detected in the sulfate cultures, D for a protein which was identified but not confidently quantified. Metabolomics data are shown as boxplots displaying the distribution for each growth phase with the minimum, maximum, and median values for the dibenzothiophene (DBT) and inorganic sulfate (IS) cultures. Significance of the data (P value [rank], Wilcoxon test) is indicated by asterisks: * for P < 0.01, ** for P < 0.05, *** for P < 0.1, no asterisk for P > 0.1.
FIG 7
FIG 7
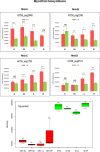
Proteins of mycothiol biosynthesis (see Table S1 for details of the abundance profiles and proposed functions of the proteins). The growth phases are abbreviated as EL (early log), ML (mid-log), LL (late log), and SP (stationary phase). Bar charts represent the label-free quantification (LFQ) values showing the abundance profile of the proteins in both the DBT (dibenzothiophene) and IS (inorganic sulfate) cultures. Significance of the data is attested by a Welch moderated t test as follows: NS for P > 0.05, * for P ≤ 0.05, ** for P ≤ 0.01, *** for P ≤ 0.001, **** for P ≤ 0.0001, DS for a protein which was uniquely identified in the dibenzothiophene cultures but not detected in the sulfate cultures, D for a protein which was identified but not confidently quantified. Metabolomics data are shown as boxplots displaying the distribution for each growth phase with the minimum, maximum, and median values for the dibenzothiophene (DBT) and inorganic sulfate (IS) cultures. Significance of the data (P value [rank], Wilcoxon test) is indicated by asterisks: * for P < 0.01, ** for P < 0.05, *** for P < 0.1, no asterisk for P > 0.1.
FIG 8
FIG 8
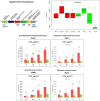
Gene cluster, proteins, and a metabolite of ergothioneine biosynthesis (see Table S1 for details of the abundance profiles and proposed functions of the proteins). Protein annotations are shown above the gene clusters, and gene names and IDs of the first and last genes are shown below the gene clusters. The growth phases are abbreviated as EL (early log), ML (mid-log), LL (late log), and SP (stationary phase). Bar charts represent the label-free quantification (LFQ) values showing the abundance profile of the proteins in both the DBT (dibenzothiophene) and IS (inorganic sulfate) cultures. Significance of the data is attested by a Welch moderated t test as follows: NS for P > 0.05, * for P ≤ 0.05, ** for P ≤ 0.01, *** for P ≤ 0.001, **** for P ≤ 0.0001, DS for a protein which was uniquely identified in the dibenzothiophene cultures but not detected in the sulfate cultures, D for a protein which was identified but not confidently quantified. Metabolomics data are shown as boxplots displaying the distribution for each growth phase with the minimum, maximum, and median values for the dibenzothiophene (DBT) and inorganic sulfate (IS) cultures. Significance of the data (P value [rank], Wilcoxon test) is indicated by asterisks: * for P < 0.01, ** for P < 0.05, *** for P < 0.1, no asterisk for P > 0.1.

References

    1. Kilbane JJ. 2006. Microbial biocatalyst developments to upgrade fossil fuels. Curr Opin Biotechnol 17:305–314. doi:10.1016/j.copbio.2006.04.005. - DOI - PubMed
    1. Mohebali G, Ball AS. 2016. Biodesulfurization of diesel fuels - past, present and future perspectives. Int Biodeterior Biodegradation 110:163–180. doi:10.1016/j.ibiod.2016.03.011. - DOI
    1. Kilbane JJ. 2017. Biodesulfurization: how to make it work? Arab J Sci Eng 42:1–9. doi:10.1007/s13369-016-2269-1. - DOI
    1. Li S, Ma T. 2019. The desulfurization pathway in Rhodococcus, p 203–229. In Alvarez HM (ed), Biology of Rhodococcus; Microbiology monographs, vol 16. Springer, Berlin.
    1. Kilbane JJ. 1990. Sulfur-specific microbial metabolism of organic compounds. Resour Conserv Recycl 3:69–79. doi:10.1016/0921-3449(90)90046-7. - DOI

Publication types

Supplementary concepts

LinkOut - more resources