. 2021 Dec;9(4):1529-1540.
doi: 10.1002/iid3.506. Epub 2021 Sep 1.

Machine learning gene expression predicting model for ustekinumab response in patients with Crohn's disease

Affiliations

Machine learning gene expression predicting model for ustekinumab response in patients with Crohn's disease

Manrong He et al. Immun Inflamm Dis. 2021 Dec.

Abstract

Background: Recent studies reported the responses of ustekinumab (UST) for the treatment of Crohn's disease (CD) differ among patients, while the cause was unrevealed. The study aimed to develop a prediction model based on the gene transcription profiling of patients with CD in response to UST.

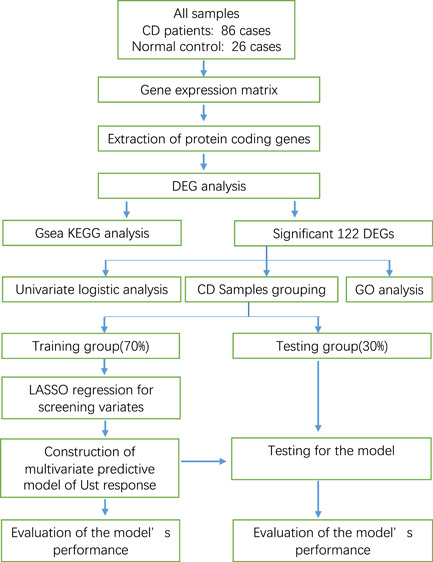
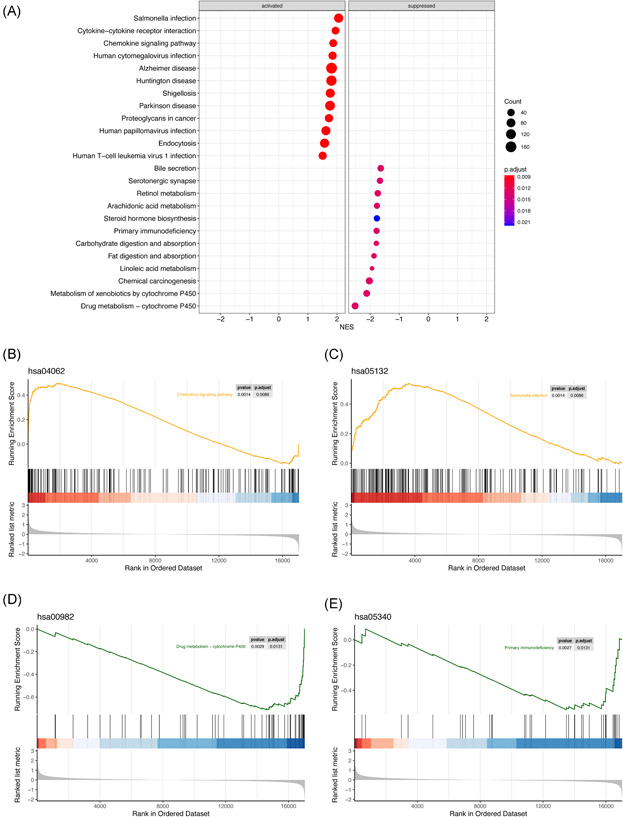
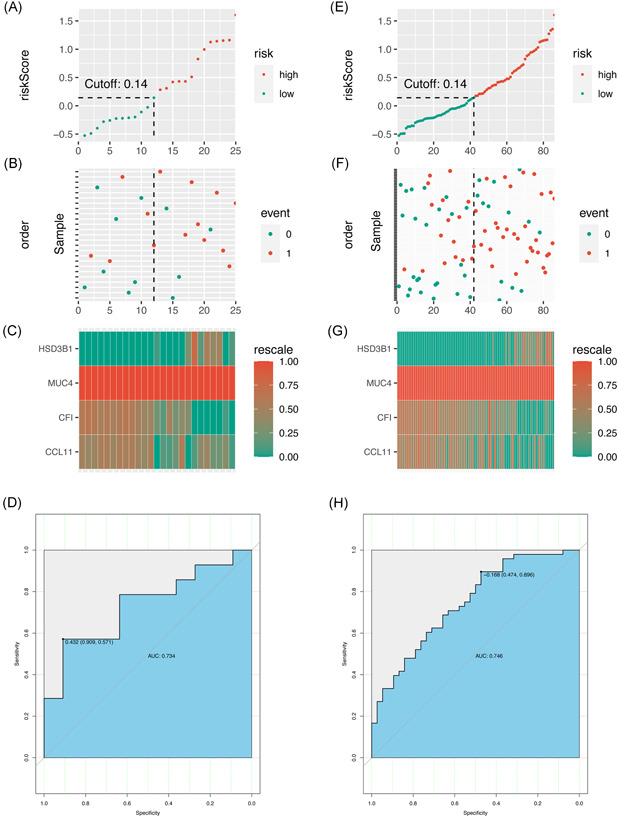
Methods: The GSE112366 dataset, which contains 86 CD and 26 normal samples, was downloaded for analysis. Differentially expressed genes (DEGs) were identified first. Gene Ontology (GO) and Kyoto Encyclopedia of Genes and Genomes (KEGG) pathway analyses were administered. Least absolute shrinkage and selection operator regression analysis was performed to build a model for UST response prediction.

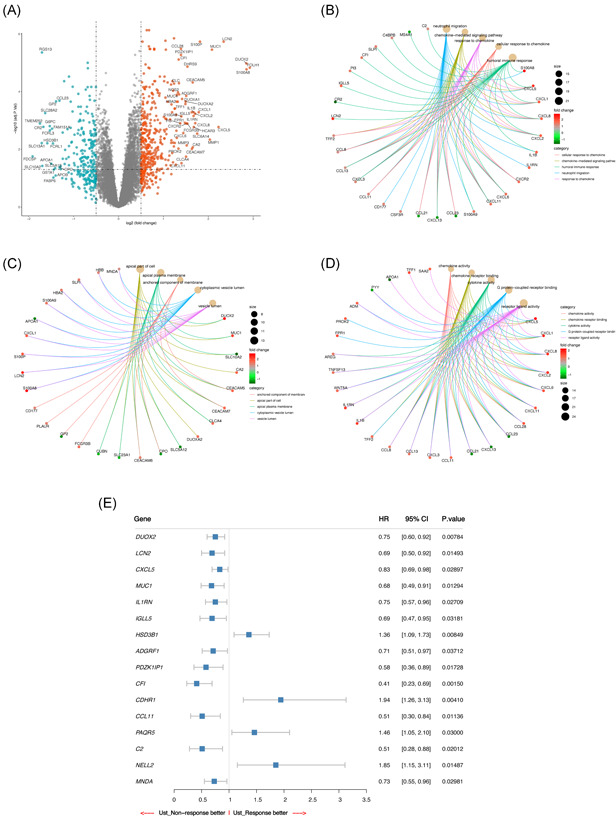
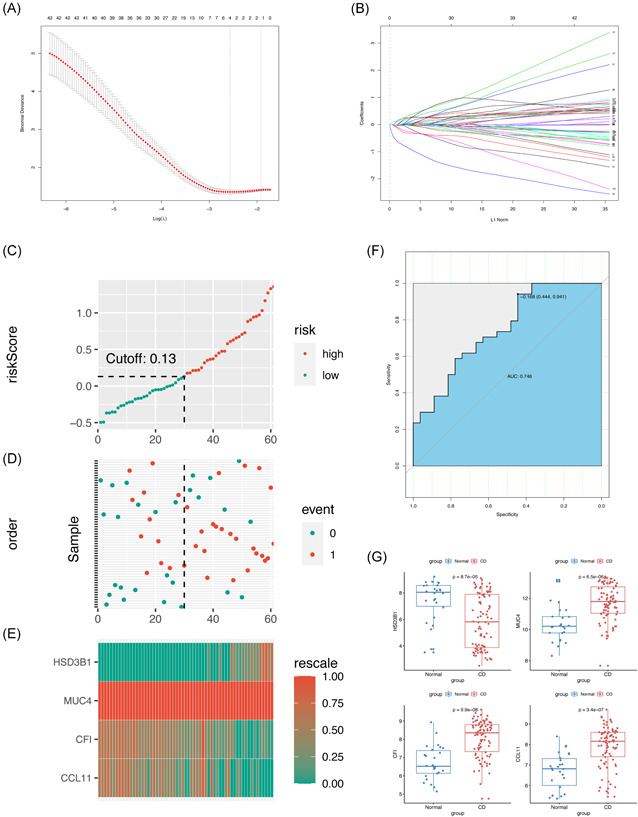
Results: A total of 122 DEGs were identified. GO and KEGG analyses revealed that immune response pathways are significantly enriched in patients with CD. A multivariate logistic regression equation that comprises four genes (HSD3B1, MUC4, CF1, and CCL11) for UST response prediction was built. The area under the receiver operator characteristic curve for patients in training set and testing set were 0.746 and 0.734, respectively.

Conclusions: This study is the first to build a gene expression prediction model for UST response in patients with CD and provides valuable data sources for further studies.

Keywords: Crohn's disease; LASSO regression; machine learning model; ustekinumab.


Conflict of interest statement

The authors declare that there are no conflict of interests.

Figures

Figure 1
Figure 1
Workflow of the study
Figure 2
Figure 2
GSEA‐based KEGG enrichment analysis. (A) Remarkably enriched activated and suppressed KEGG pathways. The vertical items are the names of KEGG terms, and the X‐axis represents the normalized enrichment score (NES). The adjusted p value is shown as the depth of color. Circle size means gene counts in the graph. (B) The plots of GSEA‐based KEGG enrichment analysis of representative gene sets from activated pathway: Chemokine signaling pathway. (C) The plots of GSEA‐based KEGG enrichment analysis of  representative gene sets from activated pathway: Salmonella infection. (D) The plots of GSEA‐based KEGG enrichment analysis of representative gene sets from suppressed pathway: drug metabolism−cytochrome P450. (E) The plots of GSEA‐based KEGG enrichment analysis of representative gene sets from suppressed pathway: primary immunodeficiency. GSEA, gene set enrichment analysis; KEGG, Kyoto Encyclopedia of Genes and Genomes
Figure 3
Figure 3
GO and univariate logistic analyses of significant DEGs in UST response. (A) Volcano plot of DEGs. DEGs in CD samples comparable to those in normal samples. Downregulated, upregulated, and nonsignificant genes are highlighted blue, red, and gray plots, respectively. The horizontal axis denotes the log2 (FC), and the vertical axis denotes—log10 (adjusted p value); The dots above the horizontal line represent the significant DEGs. (B) Top 5 GO terms in BP. Adjusted p < .05 was considered significant. (C) Top 5 GO terms in CC. Adjusted p < .05 was considered significant. (D) Top 5 GO terms in MF. Adjusted p < .05 was considered significant. (E) Random forest plot of genes that may be related to UST response. BP, biological process; CC, cellular component; CD, Crohn's disease; DEGs, differentially expressed genes; GO, Gene Ontology; MF, molecular function; UST, ustekinumab
Figure 4
Figure 4
Training for the multivariate predictive model by LASSO regression and evaluation. (A) The tuning parameter (λ) selection in the LASSO model through tenfold cross‐validation was plotted as a function of log (λ). The y‐axis is for partial likelihood deviance, and the lower x‐axis for log (λ). The average number of predictors is represented along the upper x‐axis. Red dots indicate average deviance values for each model with a given λ, where the model is the best‐fit to data. (B) LASSO coefficient profiles of the 122 DEGs. The gray dotted vertical line is the value selected using tenfold cross‐validation in (A). (C) Distribution of risk score under the training set. (D) UST response of patients under the training set. The black dotted line represents the optimum cutoff point that divides patients into low‐ and high‐risk groups. (E) Heat map of the gene expression values of the final predictors under the training set. (F) ROC curves for patients under the training set. (G) Boxplot of the expression value of each gene in the predictive model. AUC, area under the curve; DEGs, differentially expressed genes; LASSO, least absolute shrinkage and selection operator; UST, ustekinumab
Figure 5
Figure 5
Testing the multivariate predictive model. (A–D). Testing the model under the testing set. (A) Distribution of risk score under the testing set. (B) UST response of patients under the testing set. (C) Heat map of the gene expression values of the final predictors under the testing set. (D) ROC curves for patients under the testing set. (E–H). Testing the model under the total dataset. (E) Distribution of risk score under the total set. (F) UST response of patients under the total set. (G) Heat map of the gene expression values of the final predictors under the total set. (H) ROC curves for patients under the total set. ROC, receiver operator characteristic; UST, ustekinumab

Similar articles

Cited by

References

    1. Kaplan GG. The global burden of IBD: from 2015 to 2025. Nat Rev Gastroenterol Hepatol. 2015;12(12):720‐727. - PubMed
    1. Cohen BL, Ha C, Ananthakrishnan AN, Rieder F, Bewtra M. State of adult trainee inflammatory bowel disease education in the United States: a national survey. Inflamm Bowel Dis. 2016;22(7):1609‐1615. - PMC - PubMed
    1. Feagan BG, Sandborn WJ, Gasink C, et al. Ustekinumab as induction and maintenance therapy for Crohn's disease. N Engl J Med. 2016;375(20):1946‐1960. - PubMed
    1. Geremia A, Satsangi J. The role of genetics in Crohn's disease: how could it influence future therapies? Expert Rev Gastroenterol Hepatol. 2018;12(11):1075‐1077. - PubMed
    1. Kelsen JR, Sullivan KE. Inflammatory bowel disease in primary immunodeficiencies. Curr Allergy Asthma Rep. 2017;17(8):57. - PMC - PubMed

Publication types