Clinical Trial
. 2021 Dec 1;204(11):1259-1273.
doi: 10.1164/rccm.202010-3754OC.

Pulmonary Innate Lymphoid Cell Responses during Rhinovirus-induced Asthma Exacerbations In Vivo: A Clinical Trial

Collaborators, Affiliations
Clinical Trial

Pulmonary Innate Lymphoid Cell Responses during Rhinovirus-induced Asthma Exacerbations In Vivo: A Clinical Trial

Jaideep Dhariwal et al. Am J Respir Crit Care Med. .

Abstract

Rationale: Type 2 innate lymphoid cells (ILC2s) are significant sources of type 2 cytokines, which are implicated in the pathogenesis of asthma and asthma exacerbations. The role of ILC2s in virus-induced asthma exacerbations is not well characterized. Objectives: To characterize pulmonary ILC responses following experimental rhinovirus challenge in patients with moderate asthma and healthy subjects. Methods: Patients with moderate asthma and healthy subjects were inoculated with rhinovirus-16 and underwent bronchoscopy at baseline and at Day 3, and Day 8 after inoculation. Pulmonary ILC1s and ILC2s were quantified in bronchoalveolar lavage using flow cytometry. The ratio of bronchoalveolar lavage ILC2:ILC1 was assessed to determine their relative contributions to the clinical and immune response to rhinovirus challenge. Measurements and Main Results: At baseline, ILC2s were significantly higher in patients with asthma than in healthy subjects. At Day 8, ILC2s significantly increased from baseline in both groups, which was significantly higher in patients with asthma than in healthy subjects (all comparisons P < 0.05). In healthy subjects, ILC1s increased from baseline at Day 3 (P = 0.001), while in patients with asthma, ILC1s increased from baseline at Day 8 (P = 0.042). Patients with asthma had significantly higher ILC2:ILC1 ratios at baseline (P = 0.024) and Day 8 (P = 0.005). Increased ILC2:ILC1 ratio in patients with asthma correlated with clinical exacerbation severity and type 2 cytokines in nasal mucosal lining fluid. Conclusions: An ILC2-predominant inflammatory profile in patients with asthma was associated with increased severity and duration of rhinovirus infection compared with healthy subjects, supporting the potential role of ILC2s in the pathogenesis of virus-induced asthma exacerbations.

Keywords: ILC1; ILC2; asthma; innate lymphoid cells; rhinovirus.


Figures

Figure 1.
Figure 1.
Gating strategy for identification of type 1 innate lymphoid cells (ILC1) and ILC2 populations. Shown is a representative flow cytometric plot identifying the gating strategy used to identify ILC1 and ILC2 populations. ILC populations were isolated and collected using fluorescence-activated cell sorting. ILC2s were identified as lineage (CD2/CD3/CD14/CD16/CD19/CD56/CD235a) negative, CD123−ve, FcεRI−ve, CD127+ve, CD45+ve, CRTH2+ve cells. ILC1s were identified as lineage (CD2/CD3/CD14/CD16/CD19/CD56/CD235a) negative, CD123−ve, FcεRI−ve, CD127+ve, CD45+ve, CRTH2−ve, c-kit−ve, NKp44–ve cells. FSC = forward scatter; SSC = side scatter.
Figure 2.
Figure 2.
Increased virus-induced morbidity and greater virus load in patients with asthma following viral challenge. (A–C) Rhinovirus infection resulted in greater upper (A) and lower (B) respiratory symptoms in patients with asthma accompanied by greater and more prolonged reductions in their morning peak expiratory flow (PEF), expressed as the percentage change from baseline (C). (D) The maximal fall in FEV1 during the 2-week period after inoculation was greater in asthma. (E) Nasal lavage virus load was significantly greater in asthma at Day 4 after inoculation. (F) Peak nasal lavage virus load in asthma correlated with baseline preinfection Asthma Control Questionnaire (ACQ). Between group statistical analyses were performed using Mann-Whitney U tests. Data displayed as (AD) means and (E) box and whisker plots. Boxes display medians and interquartile range, with whiskers representing maximum and minimum values. P values: * < 0.05 and ** < 0.01. Correlations were performed using the nonparametric Spearman rank correlation.
Figure 3.
Figure 3.
Increased type I cytokines/chemokines in upper and lower airways of both patients with asthma and healthy subjects after virus inoculation. (AH) Rhinovirus infection resulted in induction of upper and lower airways type I cytokines and chemokines in both patients with asthma and healthy subjects. Nasal cytokine values are presented as the baseline level, the maximal level during the 2-week infection period, and the Day 42 level for each individual. Bronchial cytokine levels are presented at the baseline and postinfection Day 3 and Day 8 time points. P values: * < 0.05, ** < 0.01, and *** < 0.001; values from 0.05 to 0.1 are given numerically, values >0.1 are not displayed. IP-10 = interferon-γ–inducible protein 10 kD; ITAC = interferon-inducible T-cell alpha chemoattractant.
Figure 4.
Figure 4.
Patients with asthma have greater airway type 2 cytokines/chemokines at baseline and during viral infection. (AJ) Rhinovirus infection in patients with asthma resulted in the induction of IL-33, type 2 cytokines, and chemokines in vivo. Nasal cytokine values are presented as the baseline level, the maximal level during the 2-week infection period, and the Day 42 level for each individual. Bronchial cytokine levels are presented at the baseline and postinfection Day 3 and Day 8 time points. P values: * < 0.05, ** < 0.01, and *** < 0.001; values from 0.05 to 0.1 are given numerically, values >0.1 are not displayed. MDC = macrophage-derived chemokine; ns = not significant; TARC = thymus and activation-regulated chemokine.
Figure 5.
Figure 5.
Changes in type 2 innate lymphoid cell populations following rhinovirus-16 infection. Shown are representative flow cytometric plots identifying the type 2 innate lymphoid cell population at baseline, Day 3, and Day 8 after rhinovirus infection in a healthy subject and in a patient with asthma.
Figure 6.
Figure 6.
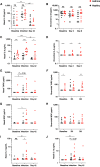
Patients with asthma have greater numbers of lower airway type 2 innate lymphoid cells (ILC2s) at baseline and during rhinovirus infection. (A and B) Numbers of lower airway ILC2s were significantly greater in asthma at baseline, whereas numbers of ILC1s at baseline were not significantly different between groups. Rhinovirus infection resulted in increased numbers of both bronchial ILC1 and ILC2 populations with both ILC1s and ILC2s increased early on Day 3 during rhinovirus infection in healthy subjects, but later on Day 8 in patients with asthma. (C) There was a greater ratio of ILC2s to ILC1s in patients with asthma both at baseline and following rhinovirus infection. ILC2 : ILC1 ratio generated for each subject at each bronchial sampling time point. P values: * < 0.05, ** < 0.01, and *** < 0.001; values from 0.05 to 0.1 are given numerically, values >0.1 are not displayed.
Figure 7.
Figure 7.
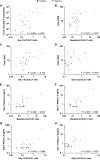
Lower airway innate lymphoid cell (ILC) ratios correlate with clinical markers of infection severity and induction of type 2 soluble mediators. ILC2 : ILC1 ratios at baseline, Day 3, and Day 8 time points correlated with (A) virus load and (BD) total lower respiratory symptom scores (LRSSs). Total lower respiratory symptom scores were calculated by summation of daily scores over the 14 days after virus inoculation. ILC2 : ILC1 ratios at baseline, Day 3, and Day 8 time points correlated with the type 2 cytokine IL-5 in vivo. ILC2 : ILC1 ratios were generated for each subject at each bronchial sampling time point. Correlations were performed using the nonparametric Spearman rank correlation.

Comment in

References

    1. Message SD, Laza-Stanca V, Mallia P, Parker HL, Zhu J, Kebadze T, et al. Rhinovirus-induced lower respiratory illness is increased in asthma and related to virus load and Th1/2 cytokine and IL-10 production. Proc Natl Acad Sci USA . 2008;105:13562–13567. - PMC - PubMed
    1. Jackson DJ, Makrinioti H, Rana BM, Shamji BW, Trujillo-Torralbo MB, Footitt J, et al. IL-33-dependent type 2 inflammation during rhinovirus-induced asthma exacerbations in vivo. Am J Respir Crit Care Med . 2014;190:1373–1382. - PMC - PubMed
    1. Jackson DJ, Trujillo-Torralbo MB, del-Rosario J, Bartlett NW, Edwards MR, Mallia P, et al. The influence of asthma control on the severity of virus-induced asthma exacerbations. J Allergy Clin Immunol . 2015;136:497–500.e3. - PubMed
    1. Beale J, Jayaraman A, Jackson DJ, Macintyre JDR, Edwards MR, Walton RP, et al. Rhinovirus-induced IL-25 in asthma exacerbation drives type 2 immunity and allergic pulmonary inflammation. Sci Transl Med . 2014;6:256ra134. - PMC - PubMed
    1. Nair P, Pizzichini MM, Kjarsgaard M, Inman MD, Efthimiadis A, Pizzichini E, et al. Mepolizumab for prednisone-dependent asthma with sputum eosinophilia. N Engl J Med . 2009;360:985–993. - PubMed

Publication types

Substances