. 2021 Sep 1;16(9):e0256503.
doi: 10.1371/journal.pone.0256503. eCollection 2021.

PyPlutchik: Visualising and comparing emotion-annotated corpora

Affiliations

PyPlutchik: Visualising and comparing emotion-annotated corpora

Alfonso Semeraro et al. PLoS One. .

Abstract

The increasing availability of textual corpora and data fetched from social networks is fuelling a huge production of works based on the model proposed by psychologist Robert Plutchik, often referred simply as the "Plutchik Wheel". Related researches range from annotation tasks description to emotions detection tools. Visualisation of such emotions is traditionally carried out using the most popular layouts, as bar plots or tables, which are however sub-optimal. The classic representation of the Plutchik's wheel follows the principles of proximity and opposition between pairs of emotions: spatial proximity in this model is also a semantic proximity, as adjacent emotions elicit a complex emotion (a primary dyad) when triggered together; spatial opposition is a semantic opposition as well, as positive emotions are opposite to negative emotions. The most common layouts fail to preserve both features, not to mention the need of visually allowing comparisons between different corpora in a blink of an eye, that is hard with basic design solutions. We introduce PyPlutchik the Pyplutchik package is available as a Github repository (http://github.com/alfonsosemeraro/pyplutchik) or through the installation commands pip or conda. For any enquiry about usage or installation feel free to contact the corresponding author, a Python module specifically designed for the visualisation of Plutchik's emotions in texts or in corpora. PyPlutchik draws the Plutchik's flower with each emotion petal sized after how much that emotion is detected or annotated in the corpus, also representing three degrees of intensity for each of them. Notably, PyPlutchik allows users to display also primary, secondary, tertiary and opposite dyads in a compact, intuitive way. We substantiate our claim that PyPlutchik outperforms other classic visualisations when displaying Plutchik emotions and we showcase a few examples that display our module's most compelling features.


Conflict of interest statement

The authors have declared that no competing interests exist.

Figures

Fig 1
Fig 1
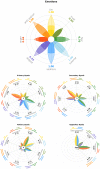
A three fold showcase of our visualisation tool on synthetic data: (i) a text where only Joy, Trust and Sadness have been detected; (ii) a corpus of many texts. Each petal is sized after the amount of items in the corpus that show that emotion in; (iii) same corpus as (ii), but higher and lower degrees of intensity of each emotion are expressed.
Fig 2
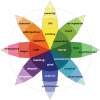
Fig 2. Plutchik’s wheel of emotions.
Each petal is partitioned in three degrees of intensity, from the most intense (the most internal section) to the least intense (the most external section).
Fig 3
Fig 3. Diagram of Plutchik’s dyads.
When two emotions are elicited together, they trigger the corresponding primary dyad if they are just one petal apart, a secondary dyad if they are two petal distant each other, a tertiary dyad if they are three petal distant, an opposite dyad if they are on the opposite side of the flower.
Fig 4
Fig 4. Plutchik’s wheel generated by code on the right.
Each entry in the Python dict is a numeric value ∈ [0, 1].
Fig 5
Fig 5. Plutchik’s wheel generated by code on the right.
Each entry in the Python dict is a three-sized array, whose sum must be ∈ [0, 1].
Fig 6
Fig 6. Small-multiple of a series of Plutchik’s wheel built from synthetic data.
Polar coordinates beneath the flowers and labels around have been hidden to improve the immediate readability of the flowers, resulting in a collection of emotional fingerprints of different corpora.
Fig 7
Fig 7. A side-by-side comparison between the synthetic plot of Fig 1(iii) and an almost identical wheel, but with only two emotions highlighted.
We highlighted and displayed the three intensity scores of Anticipation and Joy.
Fig 8
Fig 8. Primary dyads’ wheel generated by code on the right.
Each entry in the Python dict is a numeric value ∈ [0, 1].
Fig 9
Fig 9. Representation of emotions and primary, secondary, tertiary and opposite dyads.
The data displayed is random.
Fig 10
Fig 10. Average emotion scores in a sample of textual reviews of office products on Amazon.
Rating of products goes from one star (worst) to five (best). On the left, emotions detected in negative reviews (one star), on the right the emotions detected in positive reviews (five star). While positive emotions stay roughly the same, negative emotions such Anger, Disgust and Fear substantially drop as the ratings get higher.
Fig 11
Fig 11. Focus-plus-context: The selective presentation feature of PyPlutchik allows to put emphasis on some particular emotions, without losing sight of the others; we can compare different subgroups of the same Amazon corpus placing our visualisations side-by-side, and highlighting only Anger, Disgust and Fear petals, to easily spot how these negative emotions are under represented in 5-stars reviews than in 1-star reviews.
Fig 12
Fig 12. Emotions in the synopses of the top 1000 movies in the IMDB database, divided by four genres.
The shapes are immediately distinct from each other, and they return an intuitive graphical representation of each genre’s peculiarities.
Fig 13
Fig 13. Emotions in the synopses of the 20 most common movie genres in the IMDB database.
Coordinates, grids and labels are not visible: this is an overall view of the corpus, meant to showcase general trends and to spot outliers that can be analysed at a later stage, in dedicated plot.
Fig 14
Fig 14. Tweets in favour of Donald Trump and Hillary Clinton from the 2016 StanceDetection task in SemEval.
From left to right: basic emotions, primary dyads, secondary dyads, tertiary dyads and opposite dyads for both candidates (Donald Trump on the first row, Hillary Clinton on the second one). Despite the high amounts of Anticipation, Joy and Trust for both the candidates, which result in similar primary dyads, there is a significant spike on the secondary dyad Hope among Trump’s supporters that is not present in Clinton’s supporters.
Fig 15
Fig 15. Similarly to Fig 14, here are shown the emotions captured in the tweets against Donald Trump and Hillary Clinton from the 2016 StanceDetection task in SemEval.
We see a clear prevalence of negative emotions, particularly Anger and Disgust. This combination is often expressed together, as can be seen from the primary emotions plots (ii and vii), where there is a spike in Contempt.

References

    1. Ekman P. An argument for basic emotions. Cognition & emotion, 6(3-4):169–200, 1992. doi: 10.1080/02699939208411068 - DOI
    1. James W. The principles of psychology, vol. 1. Cosimo, Inc., 2007.
    1. Izard C. E., Libero D. Z., Putnam P., and Haynes O. M. Stability of emotion experiences and their relations to traits of personality. Journal of personality and social psychology, 64(5):847, 1993. doi: 10.1037/0022-3514.64.5.847 - DOI - PubMed
    1. Lazarus R. S. and Lazarus B. N. Passion and reason: Making sense of our emotions. Oxford University Press, USA, 1994.
    1. Watson D. and Tellegen A. Toward a consensual structure of mood. Psychological bulletin, 98(2):219, 1985. doi: 10.1037/0033-2909.98.2.219 - DOI - PubMed