. 2021 Dec 9;38(12):5782-5805.
doi: 10.1093/molbev/msab259.

Drosophila Evolution over Space and Time (DEST): A New Population Genomics Resource

Martin Kapun  1   2 Joaquin C B Nunez  3 María Bogaerts-Márquez  4 Jesús Murga-Moreno  5   6 Margot Paris  7 Joseph Outten  3 Marta Coronado-Zamora  4 Courtney Tern  3 Omar Rota-Stabelli  8 Maria P García Guerreiro  5 Sònia Casillas  5   6 Dorcas J Orengo  9   10 Eva Puerma  9   10 Maaria Kankare  11 Lino Ometto  12 Volker Loeschcke  13 Banu S Onder  14 Jessica K Abbott  15 Stephen W Schaeffer  16 Subhash Rajpurohit  17   18 Emily L Behrman  17   19 Mads F Schou  13   15 Thomas J S Merritt  20 Brian P Lazzaro  21 Amanda Glaser-Schmitt  22 Eliza Argyridou  22 Fabian Staubach  23 Yun Wang  23 Eran Tauber  24 Svitlana V Serga  25   26 Daniel K Fabian  27 Kelly A Dyer  28 Christopher W Wheat  29 John Parsch  22 Sonja Grath  22 Marija Savic Veselinovic  30 Marina Stamenkovic-Radak  30 Mihailo Jelic  30 Antonio J Buendía-Ruíz  31 Maria Josefa Gómez-Julián  31 Maria Luisa Espinosa-Jimenez  31 Francisco D Gallardo-Jiménez  32 Aleksandra Patenkovic  33 Katarina Eric  33 Marija Tanaskovic  33 Anna Ullastres  4 Lain Guio  4 Miriam Merenciano  4 Sara Guirao-Rico  4 Vivien Horváth  4 Darren J Obbard  34 Elena Pasyukova  35 Vladimir E Alatortsev  35 Cristina P Vieira  36   37 Jorge Vieira  36   37 Jorge Roberto Torres  38 Iryna Kozeretska  25   26 Oleksandr M Maistrenko  25   39 Catherine Montchamp-Moreau  40 Dmitry V Mukha  41 Heather E Machado  42   43 Keric Lamb  3 Tânia Paulo  44 Leeban Yusuf  45 Antonio Barbadilla  5   6 Dmitri Petrov  42 Paul Schmidt  16 Josefa Gonzalez  4 Thomas Flatt  7 Alan O Bergland  3
Affiliations

Drosophila Evolution over Space and Time (DEST): A New Population Genomics Resource

Martin Kapun et al. Mol Biol Evol. .

Erratum in

Abstract

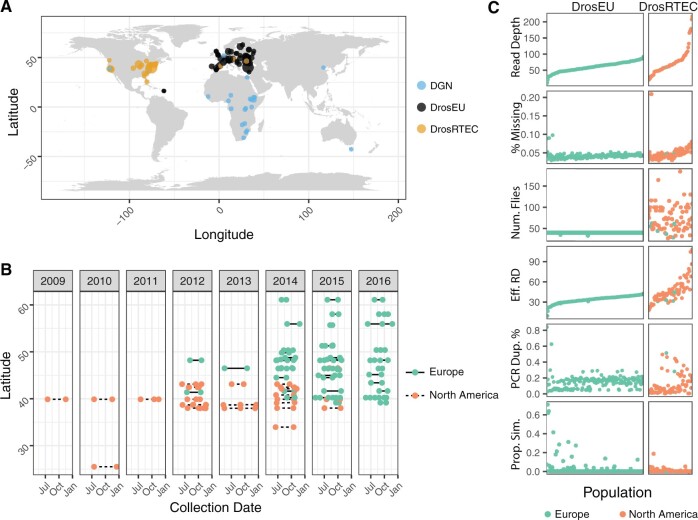
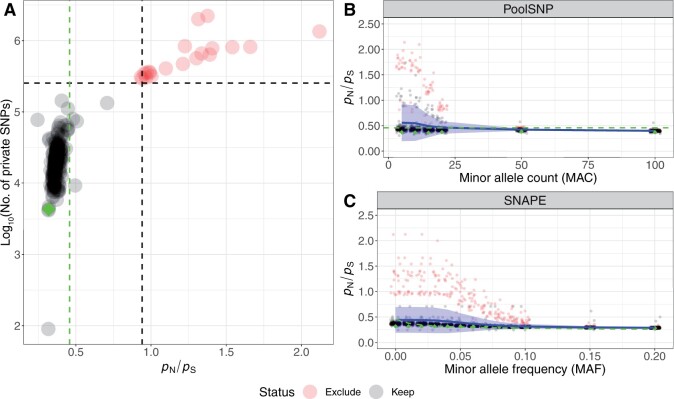
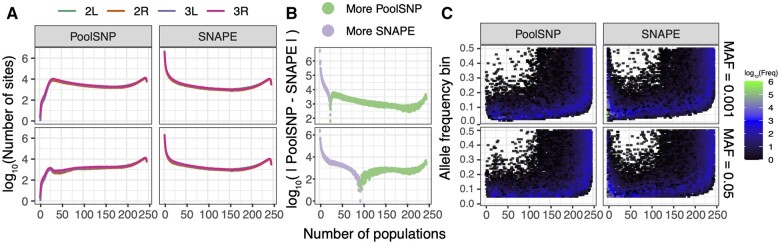
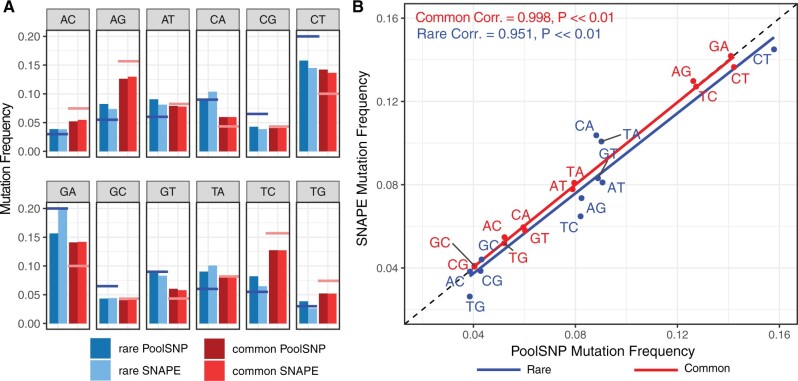
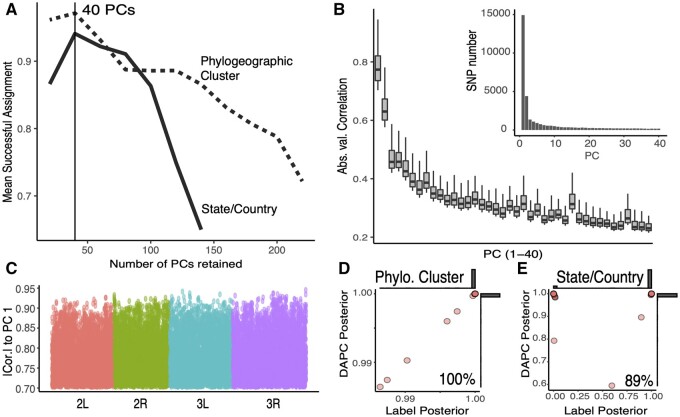
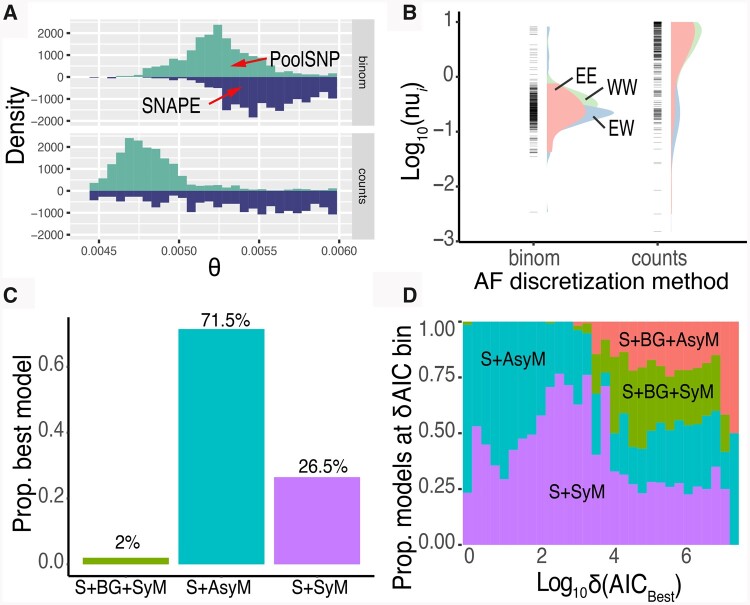
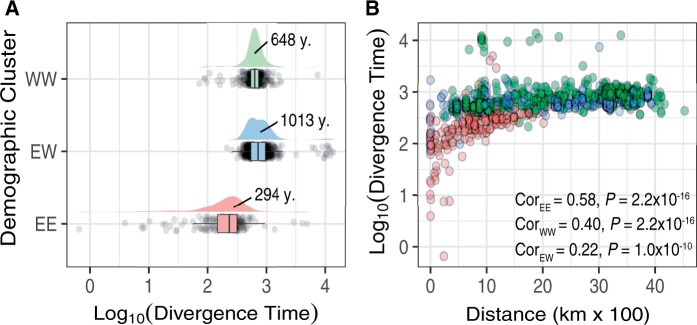
Drosophila melanogaster is a leading model in population genetics and genomics, and a growing number of whole-genome data sets from natural populations of this species have been published over the last years. A major challenge is the integration of disparate data sets, often generated using different sequencing technologies and bioinformatic pipelines, which hampers our ability to address questions about the evolution of this species. Here we address these issues by developing a bioinformatics pipeline that maps pooled sequencing (Pool-Seq) reads from D. melanogaster to a hologenome consisting of fly and symbiont genomes and estimates allele frequencies using either a heuristic (PoolSNP) or a probabilistic variant caller (SNAPE-pooled). We use this pipeline to generate the largest data repository of genomic data available for D. melanogaster to date, encompassing 271 previously published and unpublished population samples from over 100 locations in >20 countries on four continents. Several of these locations have been sampled at different seasons across multiple years. This data set, which we call Drosophila Evolution over Space and Time (DEST), is coupled with sampling and environmental metadata. A web-based genome browser and web portal provide easy access to the SNP data set. We further provide guidelines on how to use Pool-Seq data for model-based demographic inference. Our aim is to provide this scalable platform as a community resource which can be easily extended via future efforts for an even more extensive cosmopolitan data set. Our resource will enable population geneticists to analyze spatiotemporal genetic patterns and evolutionary dynamics of D. melanogaster populations in unprecedented detail.

Keywords: Drosophila melanogaster; SNPs; adaptation; demography; evolution; population genomics.


Figures

Fig. 1.
Fig. 1.
Sampling location, dates, and quality metrics. (A) Map showing the 271 sampling localities forming the DEST data set. Colors denote the data sets of origin (DGN, DrosEU, or DrosRTEC). (B) Collection dates for localities sampled more than once. (C) General sample features of the DEST data set. The x-axis represents the population sample, ordered by the average read depth.
Fig. 2.
Fig. 2.
Quality control of SNPs called with SNAPE-pooled and PoolSNP. Panel (A) shows genome-wide pN/pS ratios and the log10-scaled number of private SNPs for all Pool-Seq samples based on SNP calling with SNAPE-pooled. We highlight 20 outlier samples in red, which are characterized by exceptionally high values of both metrics. The dashed black lines indicate the 95% confidence limits (average + 1.96 SD) for both statistics. The vertical green dashed line highlights the empirical estimate of pN/pS calculated from individual sequencing data of the DGRP freeze2 data set (Mackay et al. 2012). The green diamond shows the corresponding value of the DGRP population, which was pool-sequenced as part of the DrosRTEC data set (NC_ra_03_n; Zhu et al. 2012). Panels (B) and (C) show the effects of heuristic MAC and MAF thresholds on pN/pS ratios in SNP data based on PoolSNP and SNAPE-pooled, respectively. Blue lines in both panels show average genome-wide pN/pS ratios across 271 and 246 populations, respectively. The blue ribbons depict the corresponding standard deviations. The 20 outlier samples, which are characterized in panel (A), are highlighted red. In addition, pN/pS ratios of the DGRP Pool-Seq sample (NC_ra_03_n) are shown at different cut-offs as green diamonds and the empirical values from the DGRP freeze2 data set are indicated as dashed green lines.
Fig. 3.
Fig. 3.
Polymorphism data in the PoolSNP and SNAPE data sets. (A) Number of polymorphic sites discovered across populations. The x-axis shows the number of populations that share a polymorphic site. The y-axis corresponds to the number of polymorphic sites shared by any number of populations, on a log10 scale. The colored lines represent different chromosomes and are stacked on top of each other. (B) The difference of discovered polymorphisms between SNAPE-pooled and PoolSNP. (C) Number of polymorphic sites as a function of allele frequency and the number of populations in which the polymorphisms are present. The color gradient represents the number of variant alleles from low to high (black to green). The x-axis is the same as in (A), and the y-axis is the MAF. The 2 × 2 filtering scheme is shown on the right side of the figure.
Fig. 4.
Fig. 4.
Frequencies of observed nucleotide polymorphism in the DEST data set (226 populations common to PoolSNP and SNAPE-pooled). (A) Each panel represents a mutation type. The red color indicates common mutations (AF >0.05, and common in more than 150 populations) whereas the blue color indicates rare mutations (AF <0.05, and shared in less than 50 populations). The dark colors correspond to the PoolSNP pipeline and the soft colors correspond to the SNAPE-pooled pipeline. The hovering red and blue horizontal lines represent the estimated mutation rates for common and rare mutations, respectively. (B) Correlation between the observed mutation frequencies seen in SNAPE-pooled and PoolSNP. The one-to-one correspondence line is shown as a black-dashed diagonal. Correlation estimates (Pearson’s correlation) and P values for common and rare mutations are shown.
Fig. 5.
Fig. 5.
Correlations between DEST data set and previously published data sets. Correlations between allele frequencies (AF), Nominal Coverage (COV), and Effective Coverage (NEFF) between the DEST data set (using the PoolSNP method) and the three previous Drosophila data sets: Machado et al. (2021), Kapun et al. (2020), and Bergland et al. (2014). For each data set, we show the distribution of two types of correlation coefficients: the nominal (Pearson’s) correlation (CO; dashed lines) and the concordant correlation (CCC; solid lines). In addition to the actual correlations between the data sets (red distributions), we show the distributions of correlations estimated with random population pairs (green distributions).
Fig. 6.
Fig. 6.
Population genetic estimates for African, European, and North American populations. Shown are genome-wide estimates of (A) nucleotide diversity (π), (B) Watterson’s θ and (C) Tajima’s D for African populations using the PoolSNP data set, and for European and North American populations using both the PoolSNP and SNAPE-pooled (SNAPE) data sets. As can be seen from the figure, estimates based on PoolSNP versus SNAPE-pooled (SNAPE) are highly correlated (see main text). Genetic variability is seen to be highest for African populations, followed by North American and then European populations, as previously observed (e.g., see Lack et al. [2016] and Kapun et al. [2020]).
Fig. 7.
Fig. 7.
Demographic signatures of the DrosEU, DrosRTEC, and DGN data (using the PoolSNP pipeline). (A) PCA dimensions 1 and 2. The mean centroid of a country’s assignment is labeled. (B) PCA dimensions 1 and 3. (C) Projections of PC1 onto a World map. PC1 projections define the existence of continental level clusters of population structure (indicated by the shapes circles: Africa; triangles: North America; diamonds and squares: Europe). (D) Projections of PC3 onto Europe. These projections show the existence of a demographic divide within Europe: the diamond shapes indicate a western cluster, whereas the squares represent an eastern cluster. For panels (C) and (D), the intensity of the color is proportional to the PC projection. The black dashed line shows the two-cluster divide.
Fig. 8.
Fig. 8.
Geographic proximity analysis. (A) Average (local regression; LOESS) geographic distance between populations that share a polymorphism at any given site for PoolSNP and SNAPE-pooled. The x-axis represents the number of populations considered; the y-axis is the mean geographic distance among samples. The yellow line represents the random expectation calculated as random pairings of the data. The band around the lines is the standard deviation of the estimator. (B) Correlation graph showing the different mean distance estimate for both callers as a function of the number of populations (the groups from n = 2 to n = 25 are labeled in the graph). A 1-to-1 line is also shown. (C) Probability that all populations containing a polymorphic site come from the same phylogeographic cluster (as defined by PC space, fig. 7 and supplementary fig. S14, Supplementary Material online). The y-axis is the probability of “x” populations belonging to the same phylogeographic cluster. The axis only shows up to 60 populations since, after 40 populations, the probabilities approach 0. The colors are consistent across panels.
Fig. 9.
Fig. 9.
Geographically informative markers. (A) Number of retained PCs which maximize the DAPC model’s capacity to assign group membership. Model trained on the phylogeographic clusters (dashed lines) or the country/state labels (solid line). (B) Absolute correlation for the 33,000 individual SNPs with highest weights onto the first 40 components of the PCA. Inset: Number of SNPs per PC. (C) Location of the 33,000 most informative demographic SNPs across the chromosomes. (D) LOOCV of the DAPC model trained on the phylogeographic clusters. (E) LOOCV of the DAPC model trained on the phylogeographic state/country labels. For panels (D) and (E), the y-axis shows the highest posterior produced by the prediction model and the x-axis is the posterior assigned to the actual label classification of the sample. Also, for (D) and (E), marginal histograms are shown.
Fig. 10.
Fig. 10.
Optimizing demographic models. (A) Estimates of θ from moments as a function of input data: PoolSNP (positive distribution) or SNAPE (negative distribution). We also show the AF discretization method (binomial, “binom,” top; counts, bottom). (B) Distribution of the parameter nui produced by moments as a function of AF discretization strategy. The three colors represent pairwise comparisons done within and across demographic clusters identified via PCA above. Specifically, pink: within eastern clusters (EE), blue: between clusters (EW), and green: within western clusters (WW). (C) Proportion of times a given model was determined to be the best according to AIC. (D) Distribution of δ(AICbest), the difference between the best model’s AIC, and all other evaluated models. The y-axis shows the proportion of time a given model appeared in a given δ(AICbest) bin. Because the models were Log10transformed, all values were shifted by +1 (to avoid Log10(0)=Undefined). Colors correspond to model type as labeled in the plot.
Fig. 11.
Fig. 11.
Demographic inference of European clusters. (A) Estimates of divergence time between and within the European clusters, pink: within eastern clusters (EE), blue: between clusters (EW), and green: within western clusters (WW). (B) Divergence time as a function of the geographic distance between population pairs. Color palette is consistent with panel (A). Correlation values are shown in the figure.

References

    1. Adams MD. 2000. The genome sequence of Drosophila melanogaster. Science 287:2185–2195. - PubMed
    1. Arguello JR, Laurent S, Clark AG.. 2019. Demographic history of the human commensal Drosophila melanogaster. Genome Biol Evol. 11(3):844–854. - PMC - PubMed
    1. Assaf ZJ, Tilk S, Park J, Siegal ML, Petrov DA.. 2017. Deep sequencing of natural and experimental populations of Drosophila melanogaster reveals biases in the spectrum of new mutations. Genome Res. 27(12):1988–2000. - PMC - PubMed
    1. Bastide H, Betancourt A, Nolte V, Tobler R, Stöbe P, Futschik A, Schlötterer C.. 2013. A genome-wide, fine-scale map of natural pigmentation variation in Drosophila melanogaster. PLoS Genet. 9(6):e1003534. - PMC - PubMed
    1. Battey CJ, Ralph PL, Kern AD.. 2020. Space is the place: effects of continuous spatial structure on analysis of population genetic data. Genetics 215(1):193–214. - PMC - PubMed

Publication types

LinkOut - more resources