Case Reports
. 2021 Sep 2;385(10):921-929.
doi: 10.1056/NEJMoa2102715.

Treatment of Relapsing HPV Diseases by Restored Function of Natural Killer Cells

Affiliations
Case Reports

Treatment of Relapsing HPV Diseases by Restored Function of Natural Killer Cells

Andrea Lisco et al. N Engl J Med. .

Abstract

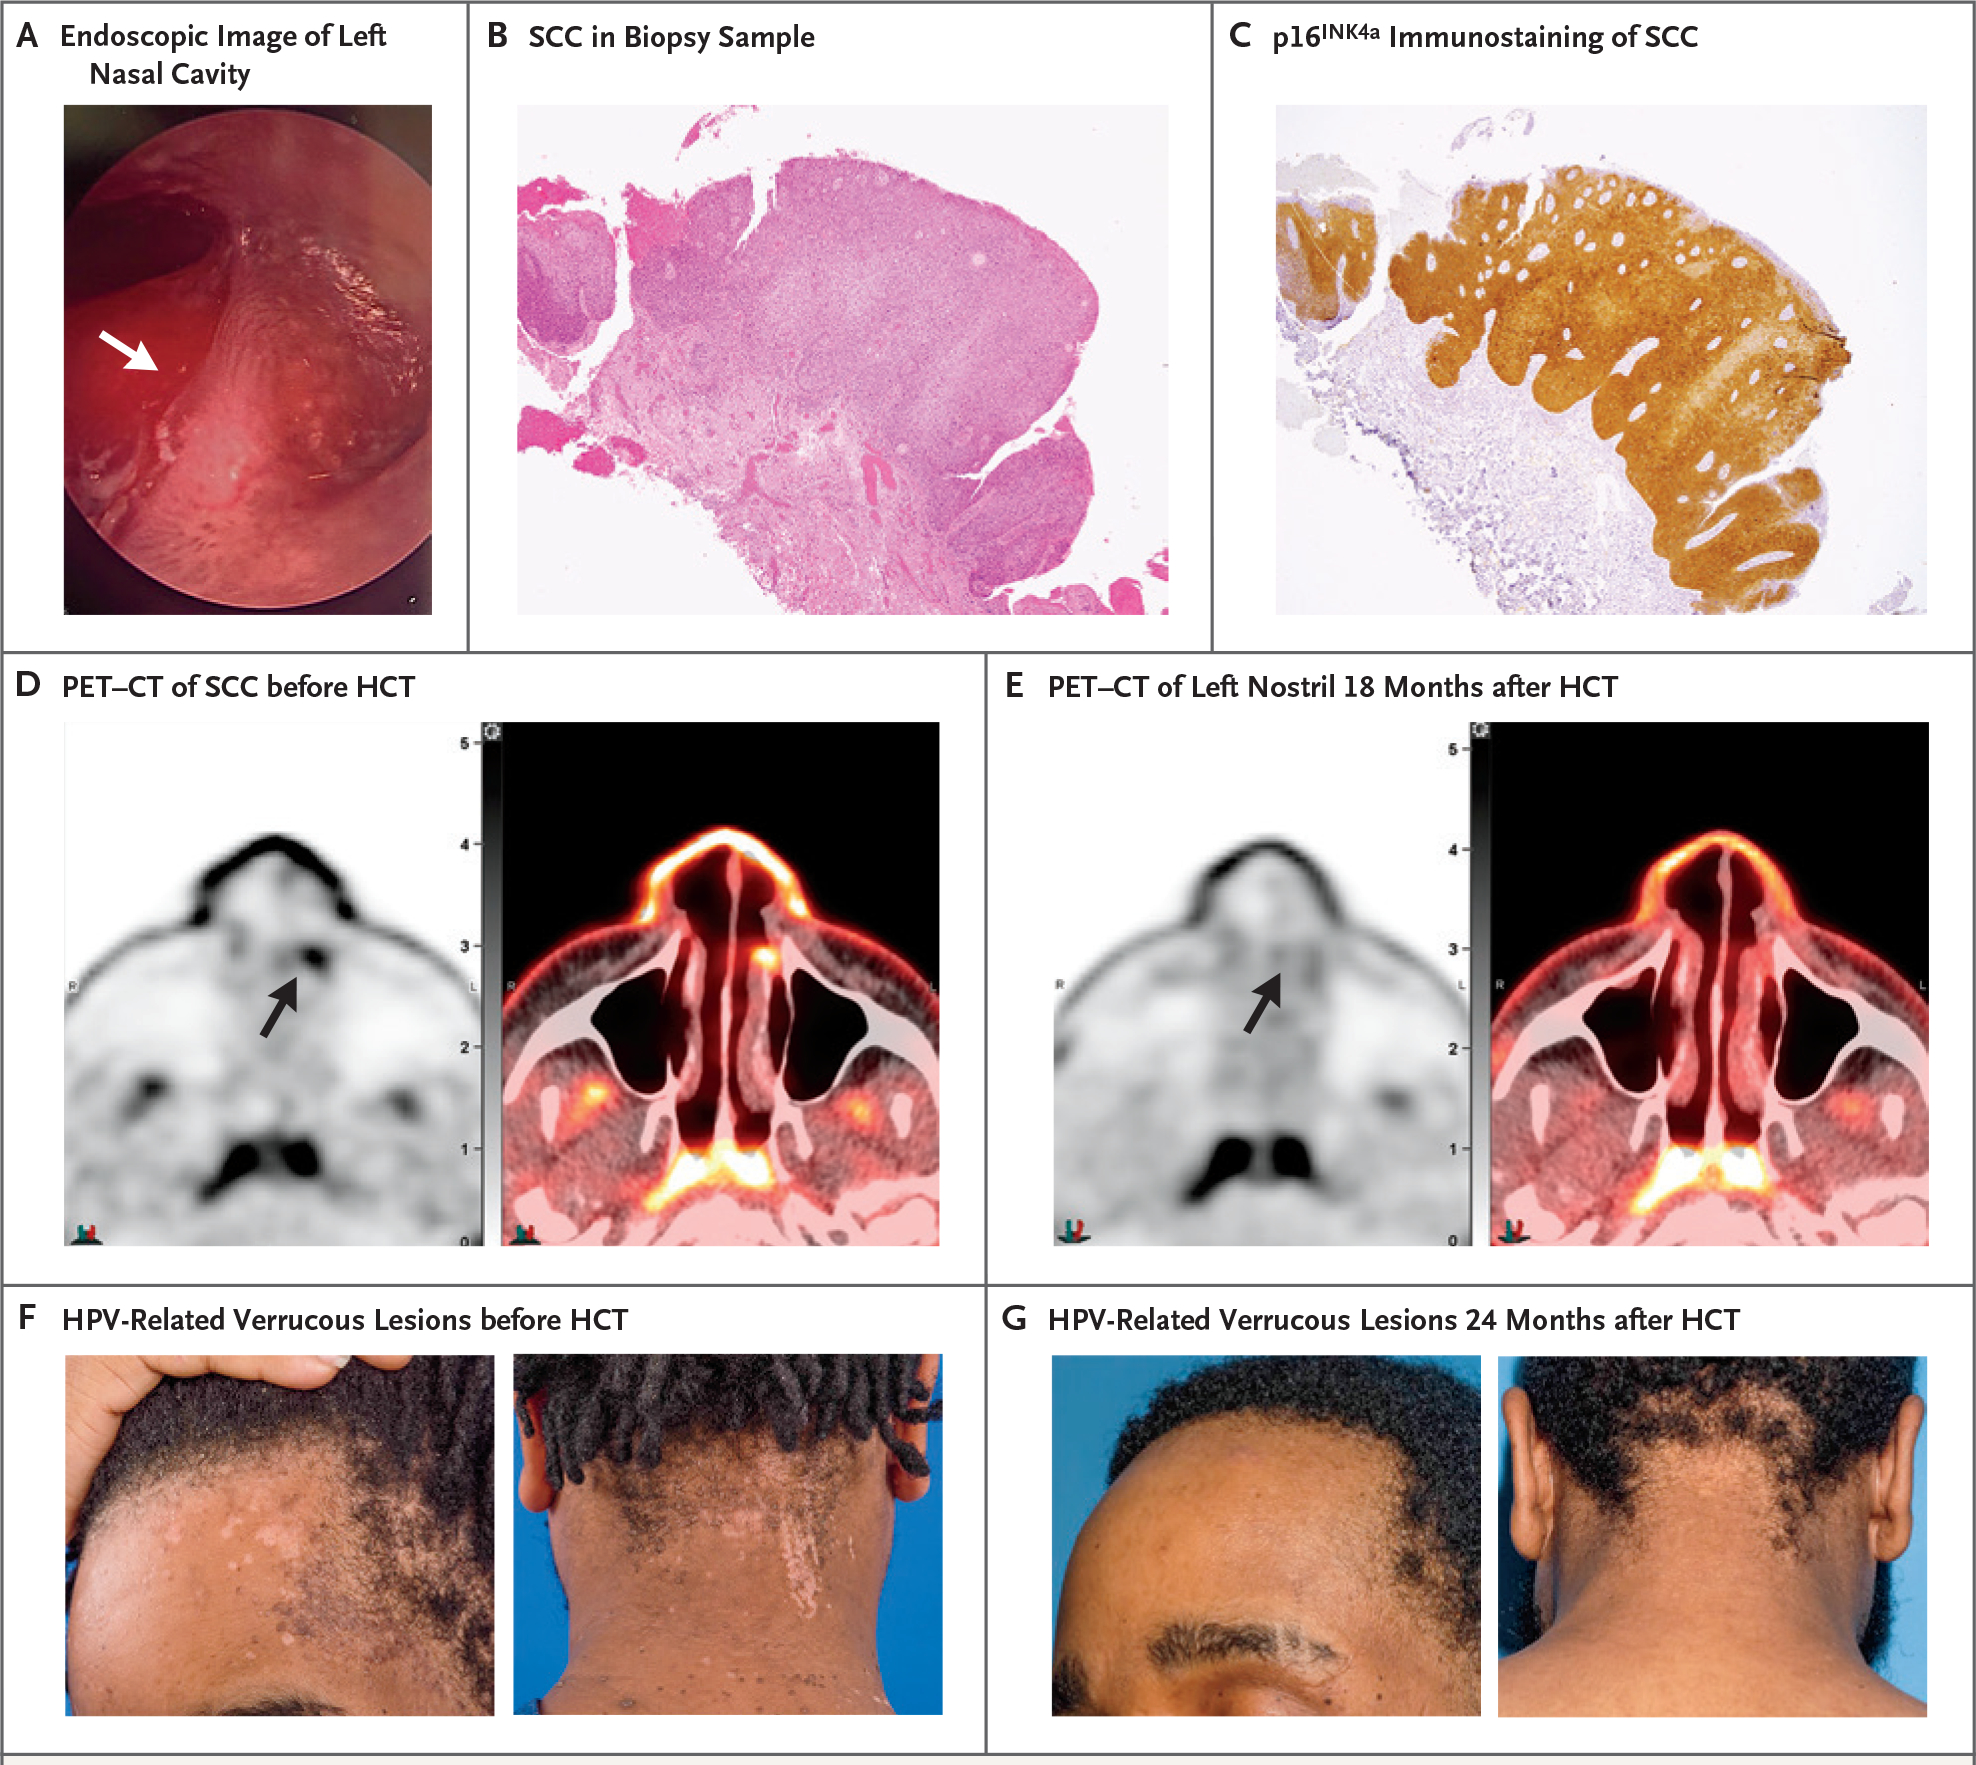
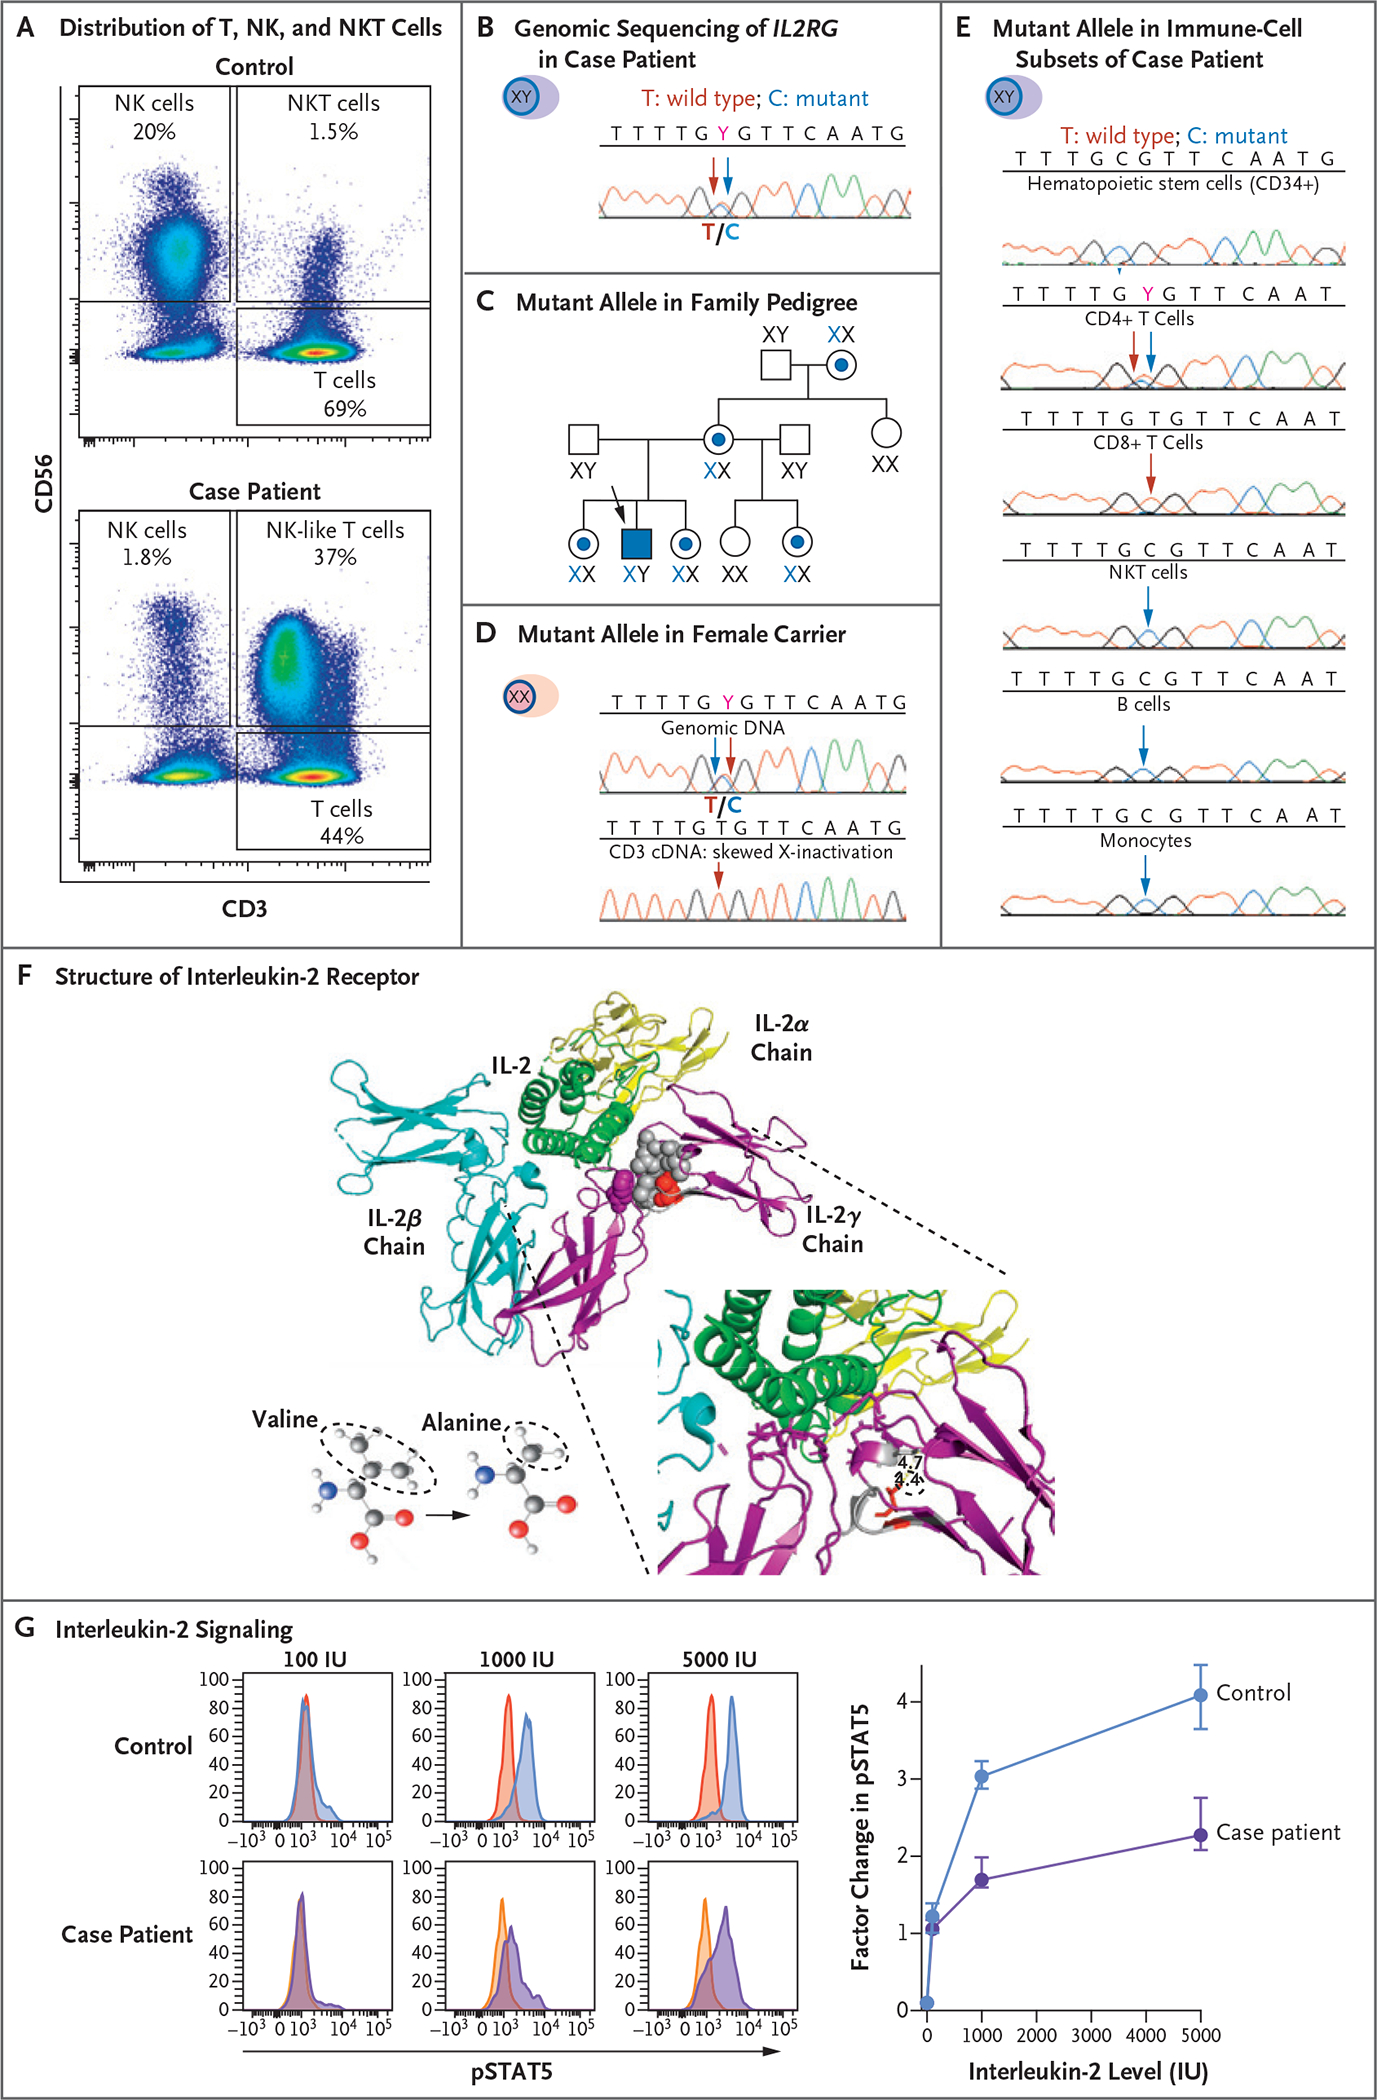
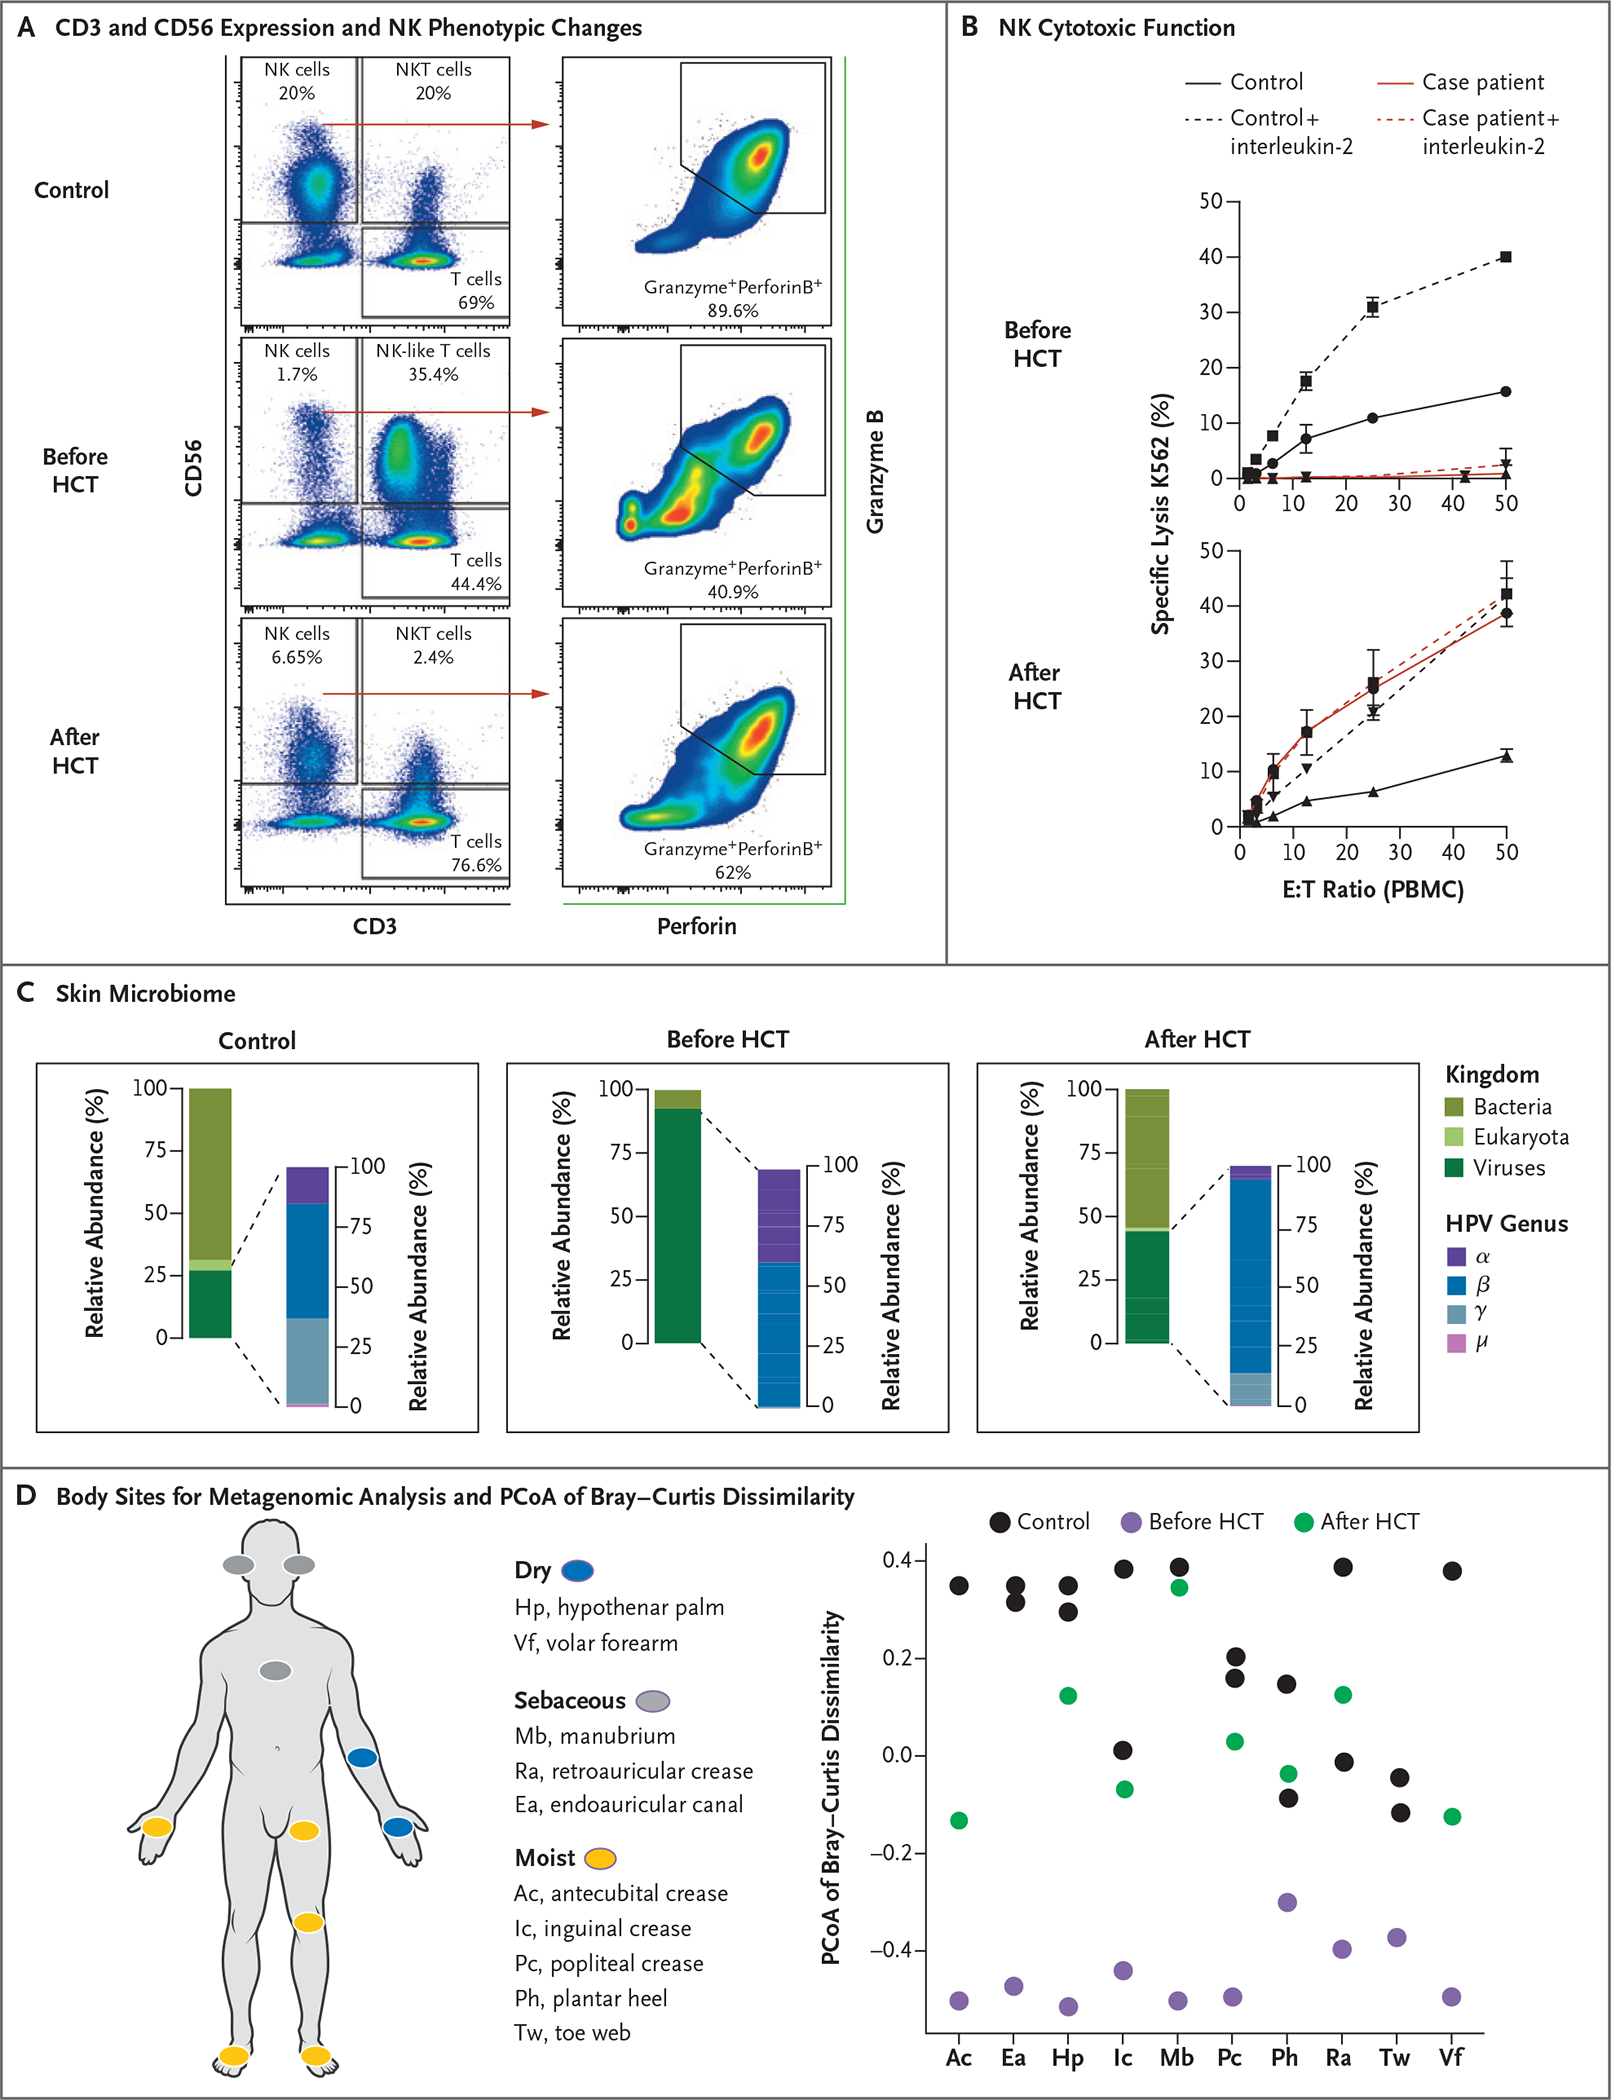
Human papillomavirus (HPV) infections underlie a wide spectrum of both benign and malignant epithelial diseases. In this report, we describe the case of a young man who had encephalitis caused by herpes simplex virus during adolescence and currently presented with multiple recurrent skin and mucosal lesions caused by HPV. The patient was found to have a pathogenic germline mutation in the X-linked interleukin-2 receptor subunit gamma gene (IL2RG), which was somatically reverted in T cells but not in natural killer (NK) cells. Allogeneic hematopoietic-cell transplantation led to restoration of NK cytotoxicity, with normalization of the skin microbiome and persistent remission of all HPV-related diseases. NK cytotoxicity appears to play a role in containing HPV colonization and the ensuing HPV-related hyperplastic or dysplastic lesions. (Funded by the National Institutes of Health and the Herbert Irving Comprehensive Cancer Center Flow Cytometry Shared Resources.).


Figures

Figure 1.
Figure 1.. Clinical and Imaging Findings in the Case Patient with Recurrent Human Papillomavirus (HPV)–Related Diseases.
Panel A shows the results of fiberoptic endoscopic examination of the patient’s left nasal cavity, where a sessile hyperkeratotic lesion was identified in the left nasal vestibule (white arrow). Panel B shows a thick epithelial layer with loss of stratification consistent with squamous-cell carcinoma (SCC) in situ in a biopsy sample of the hyperkeratotic lesion at the left inferior turbinate (hematoxylin and eosin staining). Panel C shows that the SCC in situ was strongly and diffusely positive for staining (indicated in brown) with antibody against p16INK4a, a tumor-suppressor protein that is overexpressed in HPV-related cancers. Panel D shows the results of combined positron-emission tomography and computed tomography (PET–CT) with 18F-fluorodeoxyglucose (18-FDG) indicating increased glucose metabolic activity in the left nasal vestibule (black arrow) before the patient underwent allogeneic hematopoietic-cell transplantation (HCT). Panel E shows the results of PET–CT 18 months after the patient underwent HCT, indicating resolution of abnormal metabolic activity in the left nasal cavity. Physiologic 18-FDG uptake is noted in the nasopharynx (adenoids) and in the visualized portions of the temporalis muscles within the infratemporal fossae. Panel F shows flat warts (verruca plana) and scattered verruca vulgaris extending beyond the hairline on the patient’s forehead and neck before HCT. Panel G shows resolution of these manifestations 24 months after HCT.
Figure 2
Figure 2. Genetic and Functional Analysis of the Common Cytokine Receptor γ-Chain.
Panel A shows flow cytometric analysis of the expression of CD56 and CD3 cells in peripheral-blood mononuclear cells (PBMCs) obtained from a healthy control (upper graph) and the case patient (lower graph). The analysis identifies subsets of natural killer (NK) cells and NK T (NKT) cells. The sample from the case patient shows an expansion of NK-like (CD3+CD56+) T cells and a reduced proportion of functional mature NK cells (CD3− CD56dim). Panel B shows genomic sequencing of the X-linked gene interleukin-2 receptor subunit gamma (IL2RG) in DNA extracted from PBMCs obtained from the case patient, which documents the equal distribution of the wild-type T allele (red arrow) and mutant C allele (blue arrow) at codon 191. Panel C shows the distribution of the IL2RG C allele with the c.191 mutation in the patient’s family pedigree. A blue dot and X identify female carriers of the mutant allele, and the case patient is identified by a blue square. Panel D shows the distribution of the mutant IL2RG C allele in the genomic DNA (upper graph) and in the complementary DNA (cDNA) from sorted T cells (lower graph) obtained from a female carrier in the patient’s family. Although both wild-type T alleles and mutant C alleles are present in genomic DNA from PBMCs, only the wild-type T allele appears in cDNA extracted from T cells. Panel E shows the distribution of the mutant IL2RG C allele in genomic DNA extracted from different cell subsets of the case patient. Somatic reversion of the mutated C allele appears only in CD4+ and CD8+ T cells. Panel F shows the heterotrimeric structure of the interleukin-2 receptor (IL-2R) in complex with interleukin-2 (IL-2, green ribbon). The three distinct and noncovalently linked IL-2Rα chain (yellow ribbon), IL-2Rβ chain (blue ribbon), and IL-2Rγ chain (purple ribbon) contribute to define the high-affinity IL-2 binding site. The side chain of p.64V (red spheres) in a compact hydrophobic core (gray spheres) interacting with p.227F (purple spheres) contributes to defining the IL-2 binding site. The missense variant p.V64A has a smaller side chain than the wild type. Panel G shows histograms (at left) that represent the distribution of fluorescence intensity of phosphorylated signal transducer and activator of transcription 5 (pSTAT5) after incubation of PBMCs obtained from a healthy control and from the case patient with different levels of IL-2. After gating in the subset of CD3-CD56dim functionally mature NK cells, the red and yellow histograms (which overlap and appear orange in spots) on the left side of each graph display the pSTAT5 fluorescence intensity in unstimulated condition, whereas the blue and purple histograms on the right side display the increase in pSTAT5 fluorescence after stimulation with 100, 1000, and 5000 IU of IL-2 in a representative experiment. The graph (at right) presents the cumulative data of five independent experiments presented as the median and interquartile range of the factor change in the median fluorescence intensity of pSTAT5 between unstimulated and IL-2–stimulated conditions in the case patient and in healthy controls. The reduction in the pSTAT5 factor change is consistent with reduced IL-2 signaling in the case patient as compared with two healthy controls.
Figure 3
Figure 3. Changes in NK Cytotoxic Function and Skin Microbiome after Hematopoietic-Cell Transplantation.
Panel A shows flow cytometric analysis of the expression of CD56 and CD3 in PBMCs obtained from a healthy control (upper graph) and the case patient (middle and lower graphs), along with the distribution of NK and NK-like T cells before and 24 months after the case patient underwent HCT. In the graphs at right, the expression of granzyme B and perforin in CD3+CD56+ NK cells is presented in a healthy control and in the case patient before and after HCT. After HCT, the distribution of functional mature NK cells (CD3−CD56dim) and NK-like T cells is normalized, along with the proportion of NK cells coexpressing both granzyme B and perforin. Panel B shows the evaluation of NK cytotoxicity by a 4-hour chromium-51 release assay in the presence of 1000 U per milliliter of interleukin-2 (dashed line) or the absence of interleukin-2 (solid line). PBMCs from the case patient before and 24 months after HCT (red) or a healthy control (black) were used as effectors (E) against K562 target (T) cells at indicated ratios in three replicates per experimental condition. Panel C shows skin shotgun metagenomics data presented as the mean relative abundance of total mapped microbial reads (normalized to genome length) averaged across at most 10 body sites per person per time point. Two healthy controls were compared with the case patient for whom samples had been collected before and 24 months after HCT. The graphs at left present the mean relative abundance of the skin microbiome classified at the kingdom level (Eukaryota, Bacteria, and Virus), with viruses broken down into members of the Papillomaviridae genera as compared with all other viruses, including other eukaryotic viruses and viruses in bacteria. In the graphs at right, the mean relative abundance of four HPV genera (α, β, γ, and μ) on the skin is presented. Panel D shows the distribution of the 10 body sites sampled for the skin shotgun metagenomic analysis and principal coordinates analysis (PCoA) of Bray–Curtis dissimilarity. The first PCoA axis, which explained 28% of the variation in the data, is plotted as a function of body site. Each point represents a sample. Shapes and colors indicate whether samples were collected from healthy controls or from the case patient before or 24 months after HCT.

References

    1. Schiller JT, Castellsagué X, Villa LL, Hildesheim A. An update of prophylactic human papillomavirus L1 virus-like particle vaccine clinical trial results. Vaccine 2008;26:Suppl 10:K53–K61. - PMC - PubMed
    1. Lei J, Ploner A, Elfström KM, et al. HPV vaccination and the risk of invasive cervical cancer. N Engl J Med 2020;383: 1340–8. - PubMed
    1. Stevanović S, Helman SR, Wunderlich JR, et al. A phase II study of tumor-infiltrating lymphocyte therapy for human papillomavirus-associated epithelial cancers. Clin Cancer Res 2019;25:1486–93. - PMC - PubMed
    1. Tirosh O, Conlan S, Deming C, et al. Expanded skin virome in DOCK8-deficient patients. Nat Med 2018;24:1815–21. - PMC - PubMed
    1. Leiding JW, Holland SM. Warts and all: human papillomavirus in primary immunodeficiencies. J Allergy Clin Immunol 2012;130:1030–48. - PMC - PubMed

Publication types

MeSH terms