. 2021 Sep 14;54(9):2089-2100.e8.
doi: 10.1016/j.immuni.2021.05.005. Epub 2021 Aug 31.

Identification of a Kupffer cell subset capable of reverting the T cell dysfunction induced by hepatocellular priming

Affiliations

Identification of a Kupffer cell subset capable of reverting the T cell dysfunction induced by hepatocellular priming

Giorgia De Simone et al. Immunity. .

Abstract

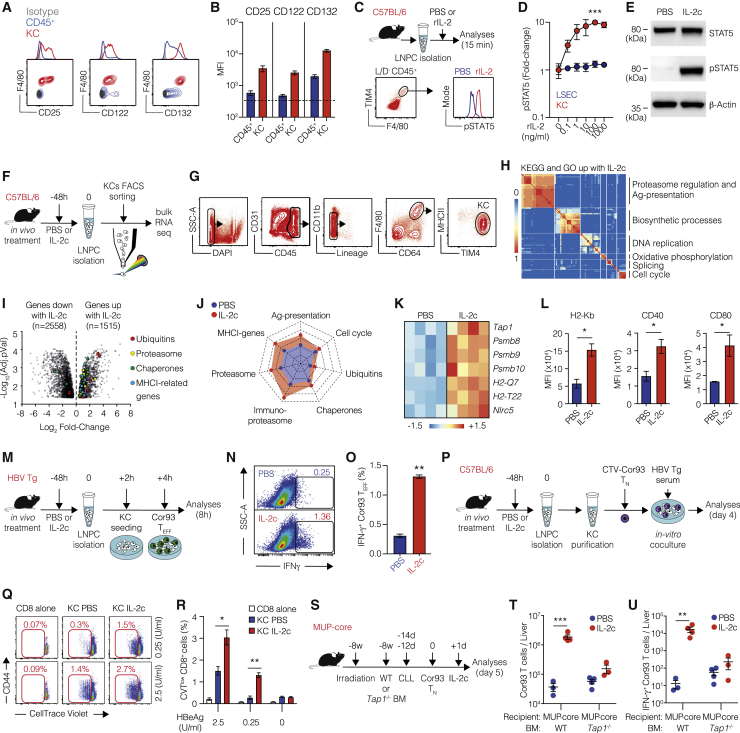
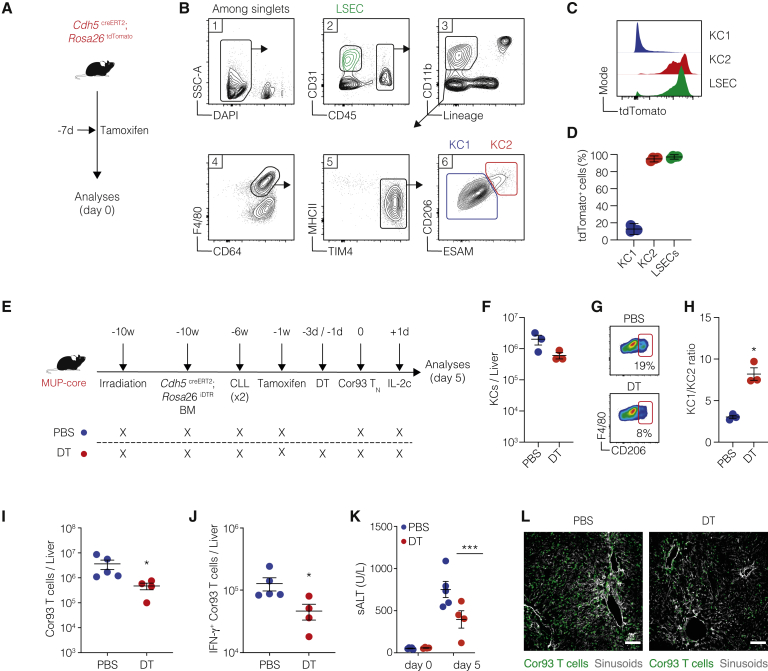
Kupffer cells (KCs) are highly abundant, intravascular, liver-resident macrophages known for their scavenger and phagocytic functions. KCs can also present antigens to CD8+ T cells and promote either tolerance or effector differentiation, but the mechanisms underlying these discrepant outcomes are poorly understood. Here, we used a mouse model of hepatitis B virus (HBV) infection, in which HBV-specific naive CD8+ T cells recognizing hepatocellular antigens are driven into a state of immune dysfunction, to identify a subset of KCs (referred to as KC2) that cross-presents hepatocellular antigens upon interleukin-2 (IL-2) administration, thus improving the antiviral function of T cells. Removing MHC-I from all KCs, including KC2, or selectively depleting KC2 impaired the capacity of IL-2 to revert the T cell dysfunction induced by intrahepatic priming. In summary, by sensing IL-2 and cross-presenting hepatocellular antigens, KC2 overcome the tolerogenic potential of the hepatic microenvironment, suggesting new strategies for boosting hepatic T cell immunity.

Keywords: CD8(+) T cells; Kupffer cells; T cell dysfunction; hepatitis B virus; imaging; interleukin-2; liver; scRNA-seq; single cell; tolerance.


Conflict of interest statement

Declaration of interests M.I. participates in advisory boards and consultancies for Gilead Sciences, Roche, Third Rock Ventures, Amgen, and Allovir. L.G.G is a member of the board of directors at Genenta Science and Epsilon Bio and participates in advisory boards and consultancies for Gilead Sciences, Roche, and Arbutus Biopharma. M.I. and L.G.G. are inventors on patents filed, owned, and managed by San Raffaele Scientific Institute, Vita-Salute San Raffaele University, and the Telethon Foundation on technology related to work discussed in this manuscript (WO2020/016434, WO2020/016427, WO2020/030781, WO2020/234483, European Union [EU] patent applications 19211249.8 and 20156716.1, and U.K. patent application 1907493.9). F.G. is a member of the Immunity advisory board.

Figures

None
Graphical abstract
Figure 1
Figure 1
KCs are required for optimal in vivo reinvigoration of intrahepatically primed T cells by IL-2 (A) Schematic representation of the experimental setup. Cor93 and Env28 TN (5 × 106) were transferred into C57BL/6 × BALB/c F1 (WT) or MUP-core × BALB/c F1 (MUP-core) recipients. When indicated, mice were injected with 2.5 × 105 infectious units of non-replicating rLCMV-core/env 4 h prior to TN transfer. Selected MUP-core mice received clodronate liposomes (CLLs) and/or IL-2/anti-IL-2 complexes (IL-2c) at the indicated time points. Livers were collected and analyzed 5 days after TN transfer. (B) Representative confocal immunofluorescence micrographs of liver sections from the indicated mice 48 h after CLL treatment. KCs were identified as F4/80+ cells and are depicted in red. Sinusoids were identified as Lyve-1+ cells and are depicted in gray. Scale bars represent 100 μm. (C and D) Representative flow cytometry plot (C) and absolute numbers (D) of KCs from the indicated mice 48 h after CLL treatment. KCs were identified as live, CD45+, TIM4+, F4/80+ cells. n = 3; p < 0.05, one-tailed Mann-Whitney U test. (E and F) Representative flow cytometry plot (E) and absolute numbers (F) of dendritic cells (DCs; identified as live, MHC-IIhi, CD11c+ cells) from the indicated mice 48 h after CLL treatment. n = 3. (G and H) Total numbers (G) and numbers of IFN-γ-producing (H) Cor93 and Env28 T cells in the livers of indicated mice. n = 4; p < 0.05, ∗∗p < 0.01, ∗∗∗p < 0.001, one-way Brown-Forsythe and Welch ANOVA test with Dunnett correction for multiple comparisons. Each group was compared with control. Normal distribution was verified using the Shapiro-Wilk test. (I) Representative confocal immunofluorescence micrographs of liver sections from the indicated mice 5 days after TN transfer. Cor93 T cells were identified as GFP+ cells and are depicted in green. Env28 T cells were identified as DsRed+ cells and are depicted in red. Sinusoids were identified as Lyve-1+ cells and are depicted in gray. Scale bars represent 100 μm. (J) Schematic representation of the experimental setup. MUP-core mice were lethally irradiated and reconstituted with CD11cDTR bone marrow (BM). Eight weeks after BM reconstitution, 1 × 106 Cor93 TN were transferred. Indicated mice were treated with diphtheria toxin (DT) every 48 h starting from 3 days before T cell injection. Indicated mice received IL-2c 1 day after Cor93 T cell transfer. Livers were collected and analyzed 5 days after TN transfer. (K and L) Representative flow cytometry plot (K) and absolute numbers (L) of DCs (identified as live, MHC-IIhi, CD11c+ cells) from the indicated mice at the time of Cor93 T cell transfer (PBS, n = 3; DT, n = 4). p < 0.05, one-tailed Mann-Whitney U test. (M) Representative confocal immunofluorescence micrographs of liver sections from the indicated mice 48 h after DT treatment. KCs were identified as F4/80+ cells and are depicted in red. Sinusoids were identified as Lyve-1+ cells and are depicted in gray. Scale bars represent 50 μm. (N and O) Representative flow cytometry plot (N) and absolute numbers (O) of KCs (identified as live, CD45+, TIM4+, F4/80+ cells) from the indicated mice at the time of Cor93 T cell transfer (PBS, n = 3; DT, n = 4). (P and Q) Total numbers (P) and numbers of IFN-γ-producing (Q) Cor93 T cells in the livers of the indicated mice. n = 5. (R) Representative confocal immunofluorescence micrographs of liver sections from the indicated mice 5 days after TN transfer. Cor93 T cells were identified as CD45.1+ cells and are depicted in green. Sinusoids were identified as Lyve-1+ cells and are depicted in gray. Scale bars represent 100 μm. Data are representative of at least three independent experiments. See also Figure S1.
Figure 2
Figure 2
KCs respond to IL-2 and cross-present hepatocellular Ags (A) Representative flow cytometry plots of CD25 (left panel), CD122 (middle panel), and CD132 (right panel) expression on CD45+ (blue) and F4/80+ (red) cell populations in the livers of C57BL/6 mice. Isotype control is depicted in gray. (B) Mean fluorescent intensity (MFI) of CD25 (left), CD122 (middle), and CD132 (right) expression on live CD45+ (blue) and KCs (red; identified as live, CD45+, TIM4+, F4/80+ cells) cells in the livers of C57BL/6 mice. n = 3. (C) Schematic representation of the experimental setup. Liver non-parenchymal cells (LNPCs) were isolated from C57BL/6 mice and incubated in vitro for 15 min with increasing doses of rIL-2. pSTAT5 signal was analyzed on CD45+ F4/80+ TIM4+ cells (KCs) or CD31+ CD45 cells (LSECs) using flow cytometry (representative plot of KCs at the bottom). (D) Fold change of STAT5 phosphorylation upon treatment with the indicated concentrations of rIL-2 in KCs (red dots) or LSECs (blue dots). n = 3; ∗∗∗p < 0.001, two-way ANOVA with Geisser-Greenhouse correction. Significance indicates time × column factor. (E) Immunoblot analysis of STAT5 and pSTAT5 in adherent KCs isolated from C57BL/6 mice and incubated in vitro with IL-2c or PBS. (F) Schematic representation of the experimental setup. C57BL/6 mice were treated in vivo with PBS or IL-2c. Forty-eight hours after treatment, liver non-parenchymal cells (LNPCs) were isolated, and RNA-seq was performed on flow cytometry-sorted KCs. (G) KC sorting strategy. KCs were identified as live, CD45+, Lineage (CD3, CD19, Ly6G, CD49b), F4/80+, CD64+, MHCIIint, TIM4+ cells (n = 4 per group). (H) Clustering of top significant (EnrichR combined score > 100, false discovery rate [FDR] < 0.05) Gene Ontology biological processes and Kyoto Encyclopedia of Genes and Genomes (KEGG) pathways of processes upregulated in KCs upon in vivo IL-2c treatment. The thermal scale represents the Jaccard similarity coefficient between every gene set pair (blue representing a similarity coefficient of 0 and red a similarity coefficient of 1). (I) Volcano plot of RNA-seq results. The x axis represents the log2 fold change of differentially expressed genes (DEGs) upon IL-2c treatment, the y axis the −log10(FDR). Only DEGs with FDRs < 0.05 were considered. Genes belonging to specific biological process are highlighted in different colors (see also Figures S3A–S3E). (J) Radar plot of different biological processes. Each dimension of the radar plot is represented as the mean of the transcripts per kilobase million (TPM) of selected genes (see also Figures S3A–S3E), in PBS-treated (blue) and IL-2c-treated (red) samples. Values range from 0 to 350 TPM. (K) Heatmap of selected genes linked to Ag presentation that were upregulated in KCs upon IL-2c treatment. Values are Z scores, calculated from scaling by row the log2(TPM) values. (L) MFI of H2-Kb, CD40, and CD80 expression on KCs (defined as live, CD45+, TIM4+, F4/80+ cells) 48 h after PBS or IL-2c treatment in vivo. n = 3; p < 0.05, one-tailed Mann-Whitney U test. (M) Schematic representation of the experimental setup. HBV replication-competent transgenic mice (HBV Tg) were treated in vivo with PBS or IL-2c. After 48 h, liver non-parenchymal cells (LNPCs) were isolated, and KCs were seeded for 2 h and co-cultured with in vitro-differentiated Cor93 effector T cells (Cor93 TE). After 4 h, T cells were harvested and analyzed using flow cytometry. (N and O) Representative flow cytometry plot (N) and percentage (O) of IFN-γ producing Cor93 TEFF cells in the indicated conditions. n = 3; ∗∗p < 0.01, one-tailed Mann-Whitney U test. (P) Schematic representation of the experimental setup. C57BL/6 mice were treated in vivo with PBS or IL-2c. After 48 h, LNPCs were isolated, and KCs were purified by immunomagnetic separation. Purified KCs were co-cultured with CellTrace violet (CTV)-labeled Cor93 TN. Serum from HBV replication-competent transgenic mice (containing the indicated concentrations of HBeAg) was added to the wells (note that HBeAg contains the Cor93 determinant). After 4 days, Cor93 T cells were harvested and analyzed using flow cytometry. (Q and R) Representative flow cytometry plots (Q) and percentages (R) of proliferating Cor93 T cells at the indicated conditions. p < 0.05 and ∗∗p < 0.01, one-way Brown-Forsythe and Welch ANOVA test with Dunnett correction for multiple comparisons. Each group was compared with every other group within the same Ag dose. n = 3. Normal distribution was verified using the Shapiro-Wilk test. (S) Schematic representation of the experimental setup. MUP-core mice were lethally irradiated and reconstituted with WT or Tap1−/− bone marrow (BM). Eight weeks after BM reconstitution, mice received two injection of clodronate liposomes (CLLs) to remove residual radio-resistant KCs. Two weeks after the last dose of CLL, 5 × 106 Cor93 TN were transferred. Indicated mice received IL-2c 1 day after Cor93 T cell transfer. Livers were collected and analyzed 5 days after Cor93 TN transfer. (T and U) Total numbers (T) and numbers of IFN-γ-producing (U) Cor93 T cells in the livers of the indicated mice (MUP-core WT-PBS, n = 3; MUP-core WT-IL-2c, n = 4; MUP-core Tap1−/−-PBS, n = 4; MUP-core Tap1−/−-IL-2c, n = 4). ∗∗p < 0.01 and ∗∗∗p < 0.001, two-way ANOVA with Sidak’s multiple-comparison test. Data are representative of at least three independent experiments. See Figures S2 and S3 and Table S1.
Figure 3
Figure 3
Single-cell RNA-seq identifies two distinct populations of KCs among liver-resident macrophages (A) Sorting strategy for liver macrophages. Liver macrophages are defined as live, CD45+, Lineage (CD3, CD19, Ly6G, CD49b), CD64+, F4/80+ cells. (B) UMAP projection of sorted cells. Each dot corresponds to a single cell, colored according to the unbiased clusters identified: cluster 0 (red, 68 cells), cluster 1 (green, 59 cells), cluster 2 (blue, 30 cells), and cluster 3 (purple, 12 cells). (C) Heatmap of normalized and scaled expression values of the 2,811 marker genes identifying the four clusters. Genes highlighted on the right are representative of each cluster. Color coding of the bar on the top of the heatmap as in (B). (D) Violin plots showing the normalized expression profile of selected genes differentially expressed in the four clusters. (E) Cell type annotation of the four clusters on the basis of the identified markers. (F) Pathway analysis of each cluster. Enriched pathways (Huang et al., 2019) are ordered by p value, and the most biologically informative among the top ten are shown. See also Figure S4, Table S2, and Table S3.
Figure 4
Figure 4
Identification of a KC subset with enriched IL-2 sensing machinery (A) Representative flow cytometry plot of KC1 and KC2 gating strategy. KCs are identified as live, CD45+, CD11bint, F4/80+, MHCII+, TIM4+ liver non-parenchymal cells. KC1 are defined as ESAM CD206 KCs. KC2 are defined as ESAM+ CD206+ KCs. (B) Relative representation of KC1 and KC2 percentages in the liver of C57BL/6 mice (n = 15). (C) Representative confocal immunofluorescence micrographs of liver sections from C57BL/6 mice. Sinusoids were identified as CD38+ cells and are depicted in white. CD206+ cells are depicted in red and F4/80+ cells in green. Scale bars represent 50 or 10 μm (see also Video S1). (D) GSEA relative to the IL-2 pathway enrichment in KC2 (red) and KC1 (blue) samples. Genes were pre-ranked on the basis of the log2 fold change between KC2 and KC1. (E) Heatmap representing the relative expression of the IL-2 receptor signaling components in KC1 and KC2 isolated from C57BL/6 mice (n = 3 per group). Values in log2(TPM) were scaled by row across samples (Z score). (F and G) Representative flow cytometry plots (F) and MFI (G) of CD25, CD122, and CD132 expression in KC1, KC2, and LSEC (defined as live, CD45, CD31+ cells) in C57BL/6 mice (n = 3 per group). p < 0.05 and ∗∗p < 0.01, two-way ANOVA with Sidak’s multiple-comparison test. (H–J) MFI of H2-Kb (H), CD40 (I), and CD80 (J) expression on KC1 (blue) and KC2 (red) 48 h after PBS or IL-2c treatment in vivo (n = 3 per group). p < 0.05 and ∗∗p < 0.01, two-way ANOVA with Sidak’s multiple-comparison test. Test is performed comparing PBS versus IL-2c treatment and KC1 versus KC2. (K) Schematic representation of the experimental setup. HBV Tg mice were injected with 1 × 106 Cor93 TN cells. Mice were treated with PBS or IL-2c 1 day after Cor93 TN transfer. Livers were collected and analyzed 5 days after TN transfer. Representative flow cytometry plots (bottom) of KC1 and KC2 in the livers upon PBS (left) or IL-2c (right) treatment. (L–N) Ratio between KC1 and KC2 (L) and absolute numbers of KC1 (M) and KC2 (N) in the liver of PBS-treated (blue) or IL-2c-treated (red) mice. n = 4; p < 0.05, one-tailed Mann-Whitney U test. Data are representative of at least three independent experiments. See also Figure S5, Table S4, and Video S1.
Figure 5
Figure 5
KC2 are required for the optimal restoration of intrahepatically primed, dysfunctional CD8+ T cells by IL-2 (A) Schematic representation of the experimental setup. Cdh5 CreERT2; Rosa26 tdTomato mice were treated with tamoxifen, and livers were collected and analyzed 7 days after treatment. (B) Gating strategy for KC1, KC2, and LSECs. (C and D) Representative histograms (C) and percentage (D) of tdTomato expression on of KC1 (blue) and KC2 (red) and LSECs (green) (n = 3). (E) Schematic representation of the experimental setup. MUP-core mice were lethally irradiated and reconstituted with Cdh5creERT2; Rosa26iDTR bone marrow (BM). Four weeks later, mice received two injections of clodronate liposomes (CLLs) to remove residual radio-resistant KCs. Nine weeks after BM reconstitution, mice were treated once with 5 mg of tamoxifen by oral gavage. Mice were treated with diphtheria toxin (DT) every 48 h starting 3 days before Cor93 TN injection (1 × 106 cells/mouse). Indicated mice received IL-2c 1 day after Cor93 TN transfer. Livers were collected and analyzed 5 days after Cor93 TN transfer. (F) Absolute numbers of total KCs (defined as live, CD45+, TIM4+, F4/80+ cells) in the liver of PBS (blue) or DT (red) treated mice. (G) Representative flow cytometry plots of KC1 (CD206 KCs) and KC2 (CD206+ KCs) populations gated on total KCs (live, CD45+, TIM4+, F4/80+ cells) in the liver of the indicated mice at the time of TN injection. (H) Ratio between KC1 and KC2 in the liver of PBS-treated (blue) or DT-treated (red) mice. n = 3; p < 0.05, one-tailed Mann-Whitney U test. (I and J) Total numbers (I) and numbers (J) of IFN-γ-producing Cor93 T cells in the livers of the indicated mice. PBS, n = 5; DT, n = 4. p < 0.05, two-tailed Mann-Whitney U test. (K) Amount of ALT in the serum of the indicated mice at the indicated time points. PBS, n = 5; DT, n = 4. ∗∗∗p < 0.001, two-way ANOVA with Sidak’s multiple-comparison test. (L) Representative confocal immunofluorescence micrographs of liver sections from the indicated mice 5 days after Cor93 TN transfer. Cor93 T cells were identified as CD45.1+ cells and are depicted in green. Sinusoids were identified as CD38+ cells and are depicted in gray. Scale bars represent 100 μm. Data are representative of two independent experiments.

Comment in

References

    1. Aizarani N., Saviano A., Sagar, Mailly L., Durand S., Herman J.S., Pessaux P., Baumert T.F., Grün D. A human liver cell atlas reveals heterogeneity and epithelial progenitors. Nature. 2019;572:199–204. - PMC - PubMed
    1. Asabe S., Wieland S.F., Chattopadhyay P.K., Roederer M., Engle R.E., Purcell R.H., Chisari F.V. The size of the viral inoculum contributes to the outcome of hepatitis B virus infection. J. Virol. 2009;83:9652–9662. - PMC - PubMed
    1. Becht E., McInnes L., Healy J., Dutertre C.-A., Kwok I.W.H., Ng L.G., Ginhoux F., Newell E.W. Dimensionality reduction for visualizing single-cell data using UMAP. Nat. Biotechnol. 2018;37:38–44. - PubMed
    1. Bénéchet A.P., De Simone G., Di Lucia P., Cilenti F., Barbiera G., Le Bert N., Fumagalli V., Lusito E., Moalli F., Bianchessi V. Dynamics and genomic landscape of CD8+ T cells undergoing hepatic priming. Nature. 2019;574:200–205. - PMC - PubMed
    1. Blattman J.N., Grayson J.M., Wherry E.J., Kaech S.M., Smith K.A., Ahmed R. Therapeutic use of IL-2 to enhance antiviral T-cell responses in vivo. Nat. Med. 2003;9:540–547. - PubMed

Publication types