. 2021 Nov:369:104426.
doi: 10.1016/j.cellimm.2021.104426. Epub 2021 Aug 24.

Evaluation of autophagy mediators in myeloid-derived suppressor cells during human tuberculosis

Affiliations

Evaluation of autophagy mediators in myeloid-derived suppressor cells during human tuberculosis

Leigh A Kotze et al. Cell Immunol. 2021 Nov.

Abstract

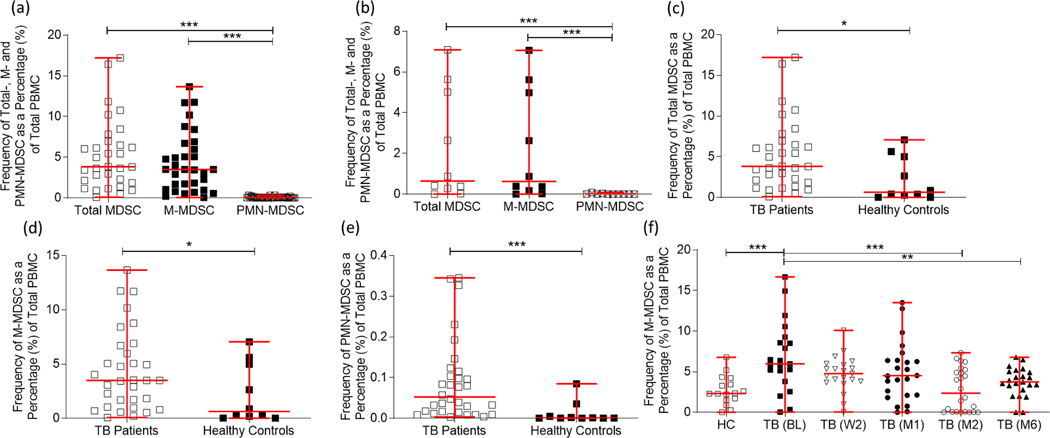
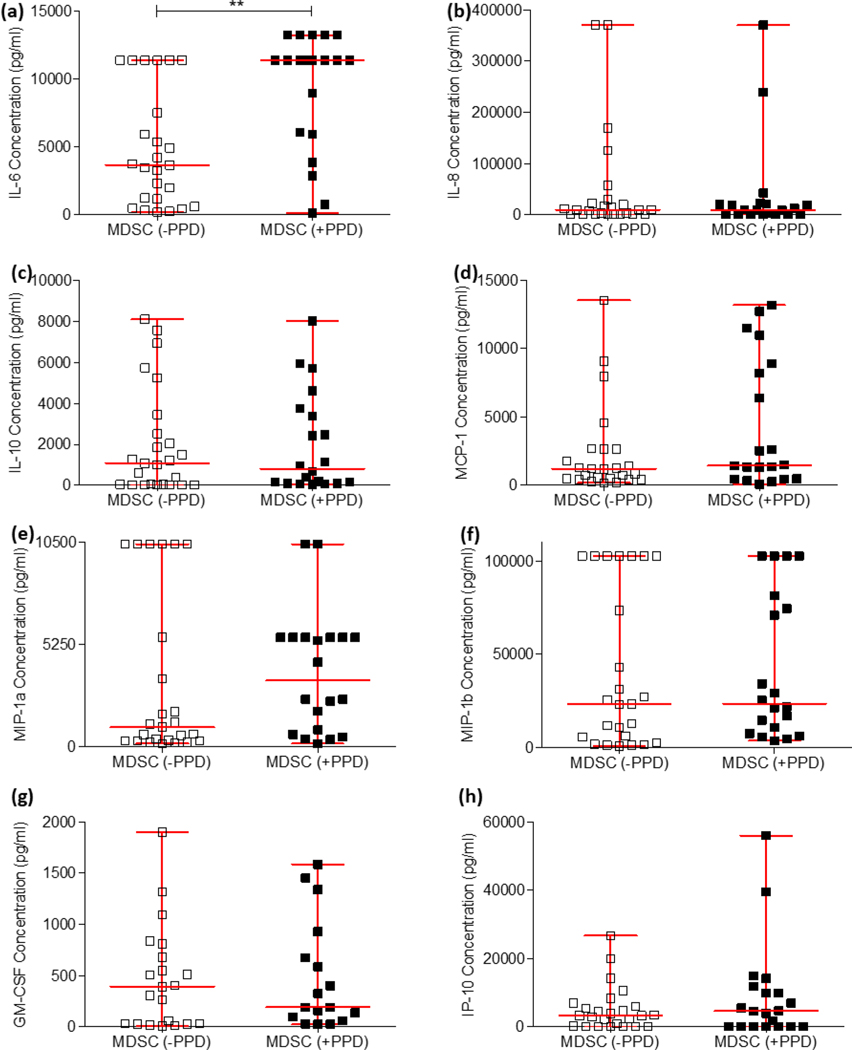
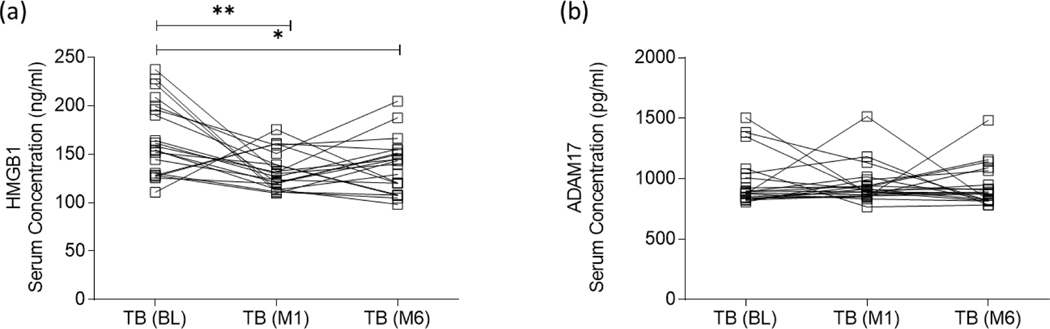
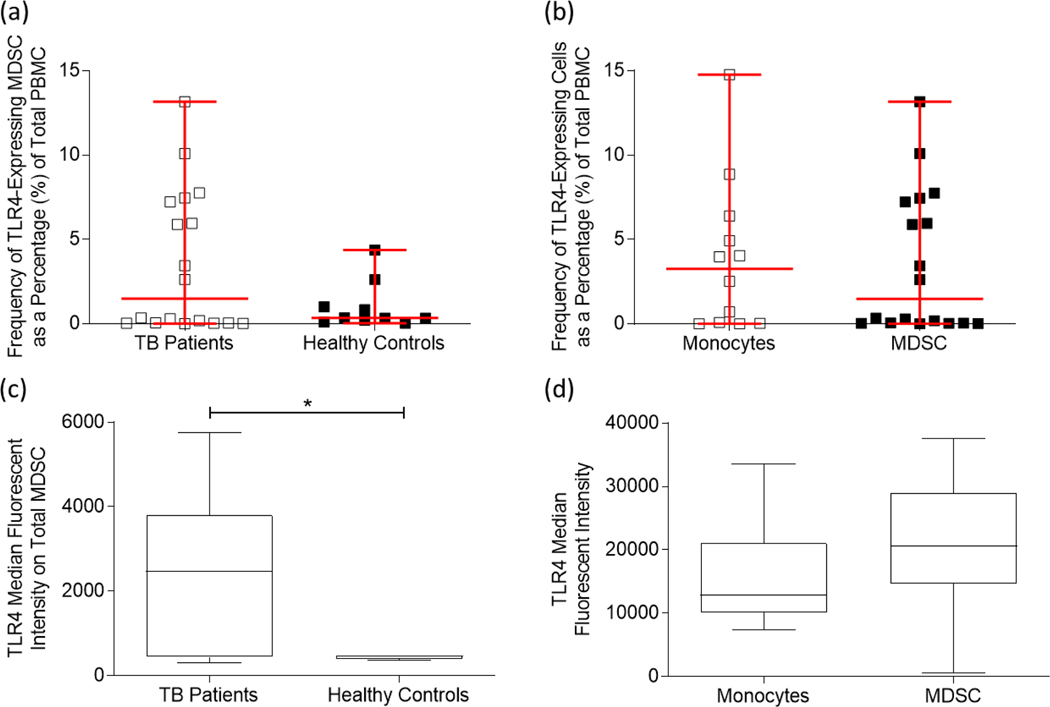
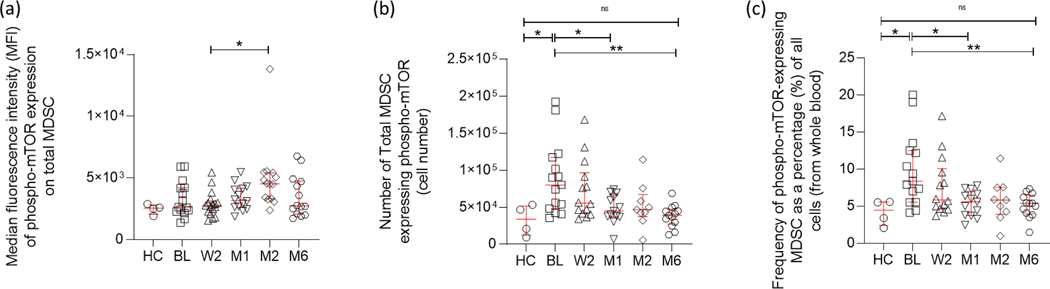
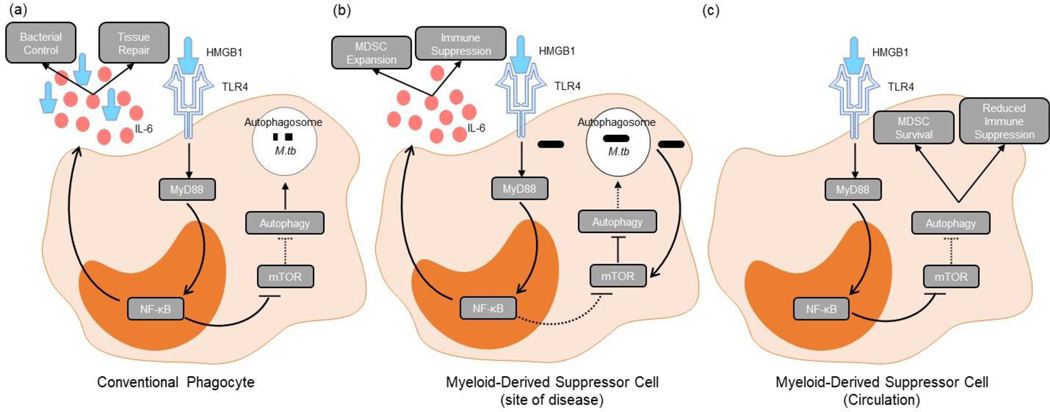
Myeloid-derived suppressor cells (MDSC) are induced during active TB disease to restore immune homeostasis but instead exacerbate disease outcome due to chronic inflammation. Autophagy, in conventional phagocytes, ensures successful clearance of M.tb. However, autophagy has been demonstrated to induce prolonged MDSC survival. Here we investigate the relationship between autophagy mediators and MDSC in the context of active TB disease and during anti-TB therapy. We demonstrate a significant increase in MDSC frequencies in untreated active TB cases with these MDSC expressing TLR4 and significantly more mTOR and IL-6 than healthy controls, with mTOR levels decreasing during anti-TB therapy. Finally, we show that HMGB1 serum concentrations decrease in parallel with mTOR. These findings suggest a complex interplay between MDSC and autophagic mediators, potentially dependent on cellular localisation and M.tb infection state.

Keywords: Autophagy; High mobility group box protein 1; Mycobacterium tuberculosis; Myeloid-derived suppressor cells; Tuberculosis.


Conflict of interest statement

Declaration of Competing Interest

The authors declare no financial conflicts of interest.

Figures

Figure 1:
Figure 1:
Myeloid-derived suppressor cells (MDSC) are enriched in peripheral blood mononuclear cells (PBMC) of participants with active TB disease compared to healthy controls, with the monocyte-like subset (M-MDSC) being the dominant subset compared to the granulocytic-type subset (PMN-MDSC). (a) The percentage of total PBMC for total MDSC, M-MDSC and PMN-MDSC subsets were compared in participants with active TB disease (n = 38) at the time of diagnosis and (b) in Healthy Controls (n = 10). (c) Total MDSC frequencies (p = 0.0161), (d) M-MDSC frequencies (p = 0.0496), and (e) PMN-MDSC frequencies (p = 0.0003) in PBMC were observed to be upregulated in participants with active TB disease (n = 38) at the time of diagnosis compared to frequencies observed in healthy control participants (n = 10). (f) Longitudinal M-MDSC frequencies in adult active TB disease cases. M-MDSC frequencies were investigated at the time of diagnosis/baseline (BL; n = 21), week two following treatment initiation (W2; n = 21), one month (M1; n = 24), two months (M2; n = 24), and six months (M6; n = 23) after treatment initiation and compared to healthy control participants (n= 16). Frequencies were determined using the FACS Canto II flow cytometer, and the third-party software FlowJo. D’Agostino & Pearson Omnibus test for normality was used to determine the distribution of the datasets: Kruskal-Wallis tests (a & b), Mann-Whitney tests (c-e), and a one-way ANOVA with Tukeys post-hoc test (f) were used where appropriate. Error bars represent the median and range. ***P < 0.001; **P < 0.01; *P < 0.05; ns: not significant.
Figure 2:
Figure 2:
The production of twelve extracellular cytokines were assessed using the Luminex immunoassay platform to compare differences in production between PPD-stimulated (n = 20) and unstimulated MDSC (n = 25). D’Agostino & Pearson Omnibus test for normality was used to determine the distribution of the datasets, after which the statistics used for the cytokines IL-6 and MIP-1a were parametric (unpaired t-test), and the statistics used for the remaining cytokines were non-parametric (MannWhitney test). Error bars represent the median and range. ***P < 0.001; **P < 0.01; *P < 0.05; ns: not significant.
Figure 3:
Figure 3:
Expression levels of (a) HMGB1 and (b) ADAM17 were evaluated using the ELISA platform in serum of participants with active TB disease (n = 20) at the time of diagnosis/baseline (BL), one month (M1) and six months (M6) after the initiation of treatment. D’Agostino & Pearson Omnibus test for normality was used to determine the distribution of the protein data, after which the statistics used for HMGB1 were parametric (repeated measures one-way ANOVA and Tukey’s test for multiple comparisons), while the statistics used for ADAM17 were non-parametric (Friedman test and Dunn’s test for multiple comparisons). Error bars represent the median and range. ***P < 0.001; **P < 0.01; *P < 0.05; ns: not significant.
Figure 4:
Figure 4:
Myeloid-derived suppressor cells derived from the peripheral blood mononuclear cells of adult participants with active TB disease express Toll-like Receptor 4 (TLR4). (a) The frequency of TLR4-expression on MDSC from active TB disease participants (n = 18) and healthy control participants (n = 10). (b) TLR4 expression on total MDSC (n = 18) and control monocyte populations (n = 12). (c) The median fluorescent intensity (MFI) of TLR4 expression on MDSC from participants with active TB disease compared to healthy control participants; as well as (d) the MFI of TLR4 expression on control monocytes and total MDSC. Frequencies were determined using the FACS Canto II flow cytometer, and the third-party software FlowJo. Error bars represent the median and range, while the whiskers represent the 5th-95th percentiles. ***P < 0.001; **P < 0.01; *P < 0.05; ns: not significant.
Figure 5:
Figure 5:
Longitudinal phospho-mTOR+ MDSC cell numbers measured in the peripheral blood (whole blood) of adult, active TB disease cases. mTOR+ total MDSC cell numbers were investigated at the time of diagnosis/baseline (BL; n = 15), week two following treatment initiation (W2; n = 14), one month (M1; n = 13), two months (M2; n = 9), and six months (M6; n = 13) after treatment initiation and compared to healthy control participants (n= 4). (a) The median fluorescent intensity of phosphor-mTOR, (b) absolute cell numbers, and (c) frequency of phosphor-mTOR-expressing MDSC as a percentage of all cells (from whole blood) were assessed and determined using the FACS Canto II flow cytometer, and the third-party software FlowJo. D’Agostino & Pearson Omnibus test for normality was used to determine the distribution of the flow cytometry data, after which the statistics used were parametric (one-way ANOVA and Tukey’s multiple comparison test). Error bars represent the median and range. ***P < 0.001; **P < 0.01; *P < 0.05; ns: not significant.
Figure 6:
Figure 6:
Proposed mechanism for how MDSC utilise the regulatory factor, HMGB1, to control their effector functions depending on the environmental need after binding to the receptor TLR4. (a) Conventional phagocytes inhibit mTOR through the binding of HMGB1 to TLR4 (and other receptors like TLR2 and RAGE), allowing for the fusion of the lysosome to the autophagosome and subsequent killing of the bacteria. (b) M.tb-infected MDSC (likely found predominantly at the site of disease) on the other hand, increase the production of mTOR, thereby inhibiting the autophagy process and prohibiting the lysosome fusion to the autophagosome, harbouring the bacteria from killing mechanisms. Pro-inflammatory cytokines, like IL-6, produced during this process induce expansion of MDSC. (c) Uninfected MDSC (likely found predominantly in circulation) make use of HMGB1 in an alternate manner to induce autophagy within the cells. The induction of autophagy prolongs the survival of these cells while limiting their suppressive potential.

References

    1. O’Garra A, Redford PS, McNab FW, Bloom CI, Wilkinson RJ, and Berry MPR, “The Immune Response in Tuberculosis,” Annu. Rev. Immunol, vol. 31, no. 1, pp. 475–527, Mar. 2013, doi:10.1146/annurev-immunol-032712-095939. - DOI - PubMed
    1. Van Crevel R, Ottenhoff THM, and van der Meer JWM, “Innate Immunity to Mycobacterium tuberculosis,” Clin. Microbiol. Rev, vol. 15, no. 2, pp. 294–309, Apr. 2002, doi:10.1128/CMR.15.2.294-309.2002. - DOI - PMC - PubMed
    1. Flynn JL and Chan J, “Immunology of tuberculosis,” Annu. Rev. Immunol, vol. 19, pp. 93–129, 2001, doi: 10.1146/annurev.immunol.19.1.93. - DOI - PubMed
    1. Gabrilovich DI and Nagaraj S, “Myeloid-derived suppressor cells as regulators of the immune system,” Nat. Rev. Immunol, vol. 9, no. 3, pp. 162–174, Mar. 2009, doi:10.1038/nri2506. - DOI - PMC - PubMed
    1. Talmadge JE, Cole K, Britton H, Dafferner A, and Warkentin P, “Human myeloid derived suppressor cell (MDSC) subset phenotypes,” J. Immunol, vol. 198, no. 1 Supplement, p. 211.2–211.2, May 2017.

Publication types

MeSH terms