

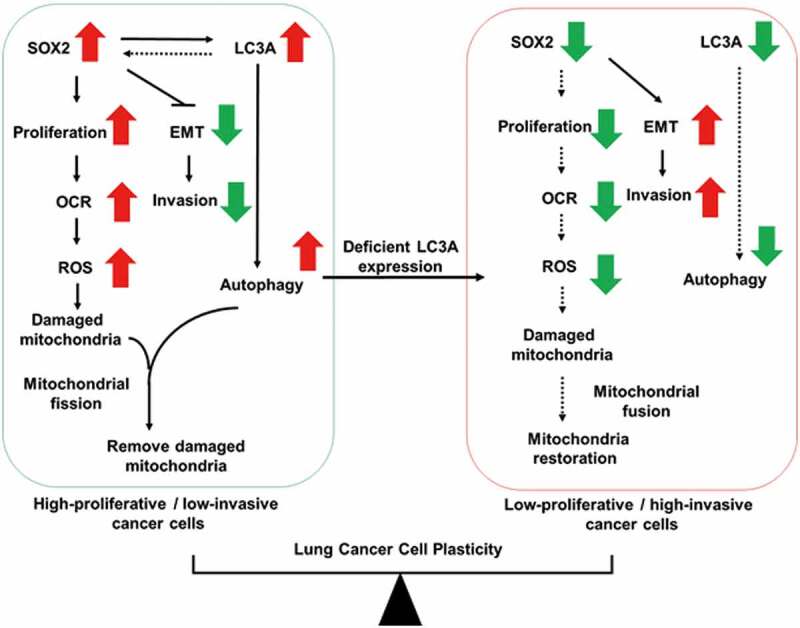
LC3A-mediated autophagy regulates lung cancer cell plasticity
- PMID: 34470575
- PMCID: PMC9037431
- DOI: 10.1080/15548627.2021.1964224
LC3A-mediated autophagy regulates lung cancer cell plasticity
Abstract
ATG14: autophagy related 14; CDH2: cadherin 2; ChIP-qPCR: chromatin immunoprecipitation quantitative polymerase chain reaction; CQ: chloroquine; ECAR: extracellular acidification rate; EMT: epithelial-mesenchymal transition; EPCAM: epithelial cell adhesion molecule; MAP1LC3A/LC3A: microtubule associated protein 1 light chain 3 alpha; MAP1LC3B/LC3B: microtubule associated protein 1 light chain 3 beta; MAP1LC3C/LC3C: microtubule associated protein 1 light chain 3 gamma; NDUFV2: NADH:ubiquinone oxidoreductase core subunit V2; OCR: oxygen consumption rate; ROS: reactive oxygen species; RT-qPCR: reverse-transcriptase quantitative polymerase chain reaction; SC: scrambled control; shRNA: short hairpin RNA; SNAI2: snail family transcriptional repressor 2; SOX2: SRY-box transcription factor 2; SQSTM1/p62: sequestosome 1; TGFB/TGF-β: transforming growth factor beta; TOMM20: translocase of outer mitochondrial membrane 20; ZEB1: zinc finger E-box binding homeobox 1.
Keywords: Autophagy; LC3A; SOX2; cancer cell plasticity; lung cancer; mitochondria dynamics.
Conflict of interest statement
No potential conflict of interest was reported by the author(s).
Figures
References
Publication types
MeSH terms
Substances
LinkOut - more resources
Full Text Sources
Other Literature Sources
Medical
Research Materials
Miscellaneous