. 2021 Oct 1;207(7):1763-1775.
doi: 10.4049/jimmunol.2000970. Epub 2021 Sep 1.

Layilin Anchors Regulatory T Cells in Skin

Affiliations

Layilin Anchors Regulatory T Cells in Skin

Pooja Mehta et al. J Immunol. .

Abstract

Regulatory T cells (Tregs) reside in nonlymphoid tissues where they carry out unique functions. The molecular mechanisms responsible for Treg accumulation and maintenance in these tissues are relatively unknown. Using an unbiased discovery approach, we identified LAYN (layilin), a C-type lectin-like receptor, to be preferentially and highly expressed on a subset of activated Tregs in healthy and diseased human skin. Expression of layilin on Tregs was induced by TCR-mediated activation in the presence of IL-2 or TGF-β. Mice with a conditional deletion of layilin in Tregs had reduced accumulation of these cells in tumors. However, these animals somewhat paradoxically had enhanced immune regulation in the tumor microenvironment, resulting in increased tumor growth. Mechanistically, layilin expression on Tregs had a minimal effect on their activation and suppressive capacity in vitro. However, expression of this molecule resulted in a cumulative anchoring effect on Treg dynamic motility in vivo. Taken together, our results suggest a model whereby layilin facilitates Treg adhesion in skin and, in doing so, limits their suppressive capacity. These findings uncover a unique mechanism whereby reduced Treg motility acts to limit immune regulation in nonlymphoid organs and may help guide strategies to exploit this phenomenon for therapeutic benefit.


Figures

Figure 1.
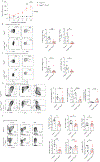
Figure 1.. Layilin is preferentially and highly expressed on a subset of activated Tregs in healthy and diseased human skin.
(a-c) RNA-Seq of Tregs and Teff cells FACS-purified from normal human skin. (a) Tregs and Teffs were sorted purifed based on CD25 and CD27 expression. A representative flow plot is shown. Cells were pre-gated on live CD45+CD3+CD4+CD8 cells. Volcano plot comparing expression profile of Tregs versus Teffs is shown. (b) Expression of specific genes identified by RNA-Seq, including layilin, Foxp3, CD27, CTLA-4, CD25 and CD3ε, by skin Tregs relative to skin Teffs. (c) Gene counts of layilin transcipts on Teff and Tregs. n = 5 healthy donors. (d) Layilin expression on Tregs, CD4+ Teffs, CD8+ T cells, dendritic cells (DC) and keratinocytes (KC), sort-purified from normal human skin, as determined by RNA-Seq. n = 7 normal healthy donors. ANOVA used for analysis. (e) Flow cytometric analysis of percentage of layilin+ cells within CD4+Foxp3+ Tregs and CD4+Foxp3 Teff populations in human skin versus peripheral blood. n = 5–12 healthy donors/group. (f) Flow cytometric analysis of median fluorescence intensity (MFI) of CD25, Foxp3, CTLA4, ICOS and CD27 expression on Laynhigh Tregs, Laynlow Tregs, and CD4+ Teff in human skin. n = 4 healthy donors. Representative flow plots and their quantification for Tregs is shown. (g-i) RNA-Seq analysis of Tregs and Teffs FACS-purified from metastatic tumors of melanoma patients. n = 12 melanoma patients. (j-l) RNA-Seq analysis of Tregs and Teffs FACS-purified from lesional skin of psoriasis patients. n = 4–5 psoriasis patients. (m) Uniform Manifold Approximation and Projection (UMAP) embeddings of mass cytometric data with indicated scaled marker intensities. Gated CD4+ T cells (n = 11,465 cells) were proportionally sampled from 4 lesional psoriasis skin punch biopsies (top). Paired median signal intensities (MSI) of CD25, FOXP3, CTLA4, and CD27 on LAYN+ and LAYN- Tregs (bottom).
Figure 2.
Figure 2.. Layilin attenuates Treg suppressive capacity in vivo.
(a) Foxp3CreLaynfl/fl or control Foxp3Cre mice both treated with tamoxifen were injected s.c. with the MC38 tumor cell line and tumor growth quantified by caliper measurements over time. n = 7–8 mice/group. Data representative of 2 independent experiments. Two-way ANOVA with Bonferroni’s test for multiple comparisons. (b-e) Flow cytometric analysis of specific leukocyte populations in specified tissues of Foxp3CreLaynfl/fl or control Foxp3Cre mice, 24 days after MC38 tumor engraftment. (b) IFNγ+ and Ki67+ CD8+ T cells, (c) IFNγ+ and Ki67+ CD4+ Teff cells, and (d) total, Ly6C+, and CD206+CD11c macrophages, infiltrating tumors. (e) Live CD4+CD25+Foxp3+ Tregs in tumor, tumor draining lymph nodes (DLN) and skin. Representative flow plots and their quantification is shown. Data representative of 3 independent experiments. n = 5–8 mice/group. Unpaired Student’s t-test.
Figure 3.
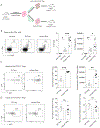
Figure 3.. Layilin plays a minor role in Treg-mediated suppression in vitro.
(a) Experimental scheme. CTV-stained Teffs were cocultured with varying proportions of sorted Tregs retrovirally transduced with either Layn-eGFP-pMIG vector (mLayn-Treg) or empty pMIG vector (EV-Treg), in the presence of mitomycin C-treated APCs and 0.5ug/ml α-CD3 on a fibroblast-coated plate for 72 hours. (b) Representative histograms and quantification of Teff proliferation, as measured by percentage of undivided Teffs and proliferating Teffs (% of Ki67+ Teffs). (c) Treg activation status. Flow cytometric analysis of MFI of FOXP3, CD25, 41BB and LAG3 expression on mLayn-Tregs compared to EV-Tregs, during suppression assay. n = 3 replicates/condition. Data representative of 4 independent experiments. Two-way ANOVA with Bonferroni’s test for multiple comparisons.
Figure 4.
Figure 4.. Layilin crosslinking on human Tregs has no significant impact on Treg activation in vitro.
(a) Experimental scheme for c. Tregs were sort purified from peripheral blood of healthy human donors and expanded for 9 or 14 days with α-CD3/CD28 beads and IL-2. Cells were then rested overnight and re-stimulated for 3 days with or without layilin cross-linking antibody, in the presence or absence of α-CD3/CD28 beads. (b) Flow cytometric quantification of expression of layilin over time on Tregs sort purified from peripheral blood and expanded ex vivo with α-CD3/CD28 coated beads and high dose IL-2. Data presented as % of LAYN+ Tregs over time. (c) Flow cytometric quantification of % of Ki67+ Tregs and MFI of FOXP3, CD25, ICOS, 4–1BB and LAG3 expression on ex vivo expanded Tregs after 3 days of coculture as outlined in a. Results are combined data from 4 donors for b and 3 donors for c with 1–2 donors repeated twice or thrice. Donors are color-coded. One-way ANOVA with Bonferroni’s test for multiple comparisons.
Figure 5.
Figure 5.. Layilin expression on Tregs promotes their accumulation in tissues.
(a-d) Adoptive transfer of Layn-overexpressing Tregs into Foxp3DTR mice. (a) Experimental scheme. Tregs sorted from CD45.1 mice were expanded ex vivo and retrovirally transduced with either Layn-eGFP-pMIG vector or empty-eGFP pMIG vector. These cells were i.v. injected into 6–10 weeks old CD45.2 Foxp3DTR mice and host Tregs depleted through administration of DT. (b-d) Flow cytometric quantification of total CD4+CD25+Foxp3+ Tregs in CD45.2 Foxp3DTR mice and host Tregs depleted through administration of DT non-injected with Tregs or i.v. injected with mLayn- or EV-Tregs (b), and GFP+CD45.1+ Tregs (c) in skin of CD45.2 Foxp3DTR mice, represented as percentages and absolute number of cells, normalized to transfection efficiency. (d) Expression of Ki67 on CD45.1+ Tregs in skin of CD45.2 Foxp3DTR mice. Data representative of 3 independent experiments. n = 3–5 mice/group. Unpaired Student’s t-test.
Figure 6.
Figure 6.. Layilin functions to ‘anchor’ Tregs in skin.
(a-d) Intravital two-photon imaging of Tregs in skin of Layn−/− Foxp3GFP mice compared to WT Foxp3GFP mice at steady state, over a period of 60 minutes. (a) xy plots of cell tracks, (b) track displacement length, (c) track speed means of the tracks, (d) sphericity of cells over time and (e) mean sphericity of each cell. (f-i) Intravital two-photon imaging of Tregs in skin of RAG2−/− mice 6 weeks after being adoptively transferred with Tregs from either Layn−/− Foxp3GFP mice or WT Foxp3GFP mice, over a period of 60 minutes. (f) Experimental scheme of adoptive transfer of cells. (g) xy plots of cell tracks, (h) track displacement length, and (i) track speed means of the tracks. n = at least 100 cells/group. Data representative of 2–3 independent experiments. Unpaired Student’s t-test.

References

    1. Panduro M, Benoist C, and Mathis D. 2016. Tissue Tregs. Annu.Rev.Immunol 34: 609–633. - PMC - PubMed
    1. Cipolletta D, Feuerer M, Li A, Kamei N, Lee J, Shoelson SE, Benoist C, and Mathis D. 2012. PPAR-gamma is a major driver of the accumulation and phenotype of adipose tissue Treg cells. Nature 486: 549–553. - PMC - PubMed
    1. Arpaia N, Green JA, Moltedo B, Arvey A, Hemmers S, Yuan S, Treuting PM, and Rudensky AY. 2015. A Distinct Function of Regulatory T Cells in Tissue Protection. Cell 162: 1078–1089. - PMC - PubMed
    1. Burzyn D, Kuswanto W, Kolodin D, Shadrach JL, Cerletti M, Jang Y, Sefik E, Tan TG, Wagers AJ, Benoist C, and Mathis D. 2013. A special population of regulatory T cells potentiates muscle repair. Cell 155: 1282–1295. - PMC - PubMed
    1. Villalta SA, Rosenthal W, Martinez L, Kaur A, Sparwasser T, Tidball JG, Margeta M, Spencer MJ, and Bluestone JA. 2014. Regulatory T cells suppress muscle inflammation and injury in muscular dystrophy. Sci.Transl.Med 6: 258ra142. - PMC - PubMed

Publication types

MeSH terms