. 2021 Sep 1;12(1):5220.
doi: 10.1038/s41467-021-25344-6.

Improved modeling of human AD with an automated culturing platform for iPSC neurons, astrocytes and microglia

Affiliations

Improved modeling of human AD with an automated culturing platform for iPSC neurons, astrocytes and microglia

Reina Bassil et al. Nat Commun. .

Abstract

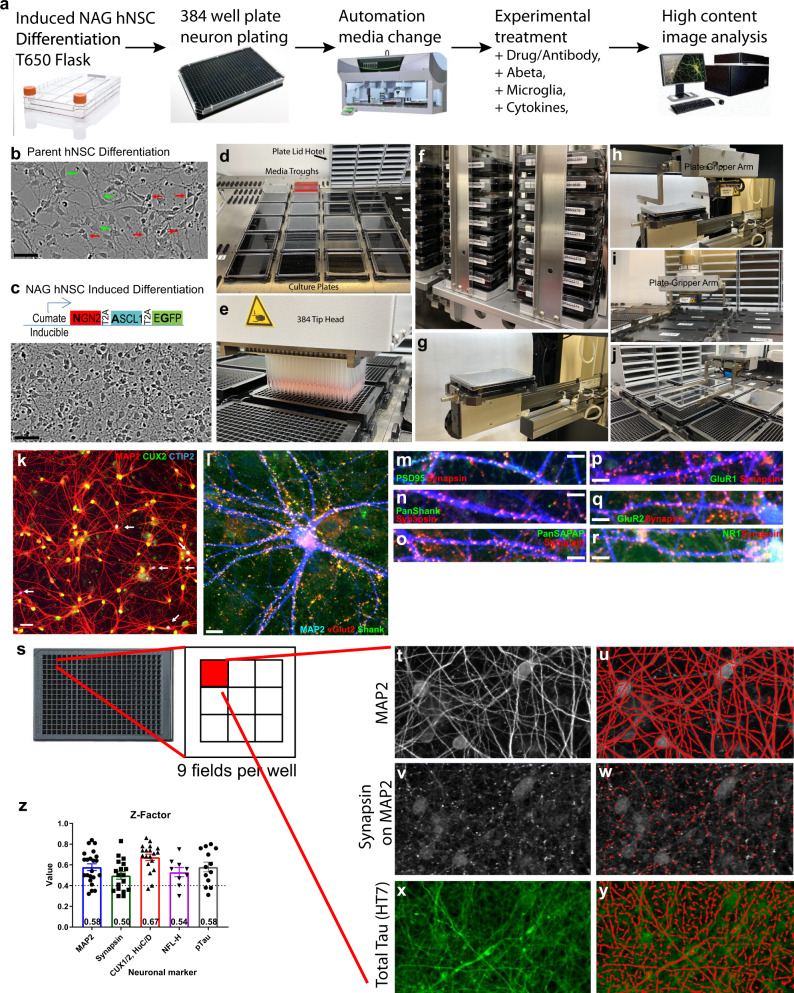
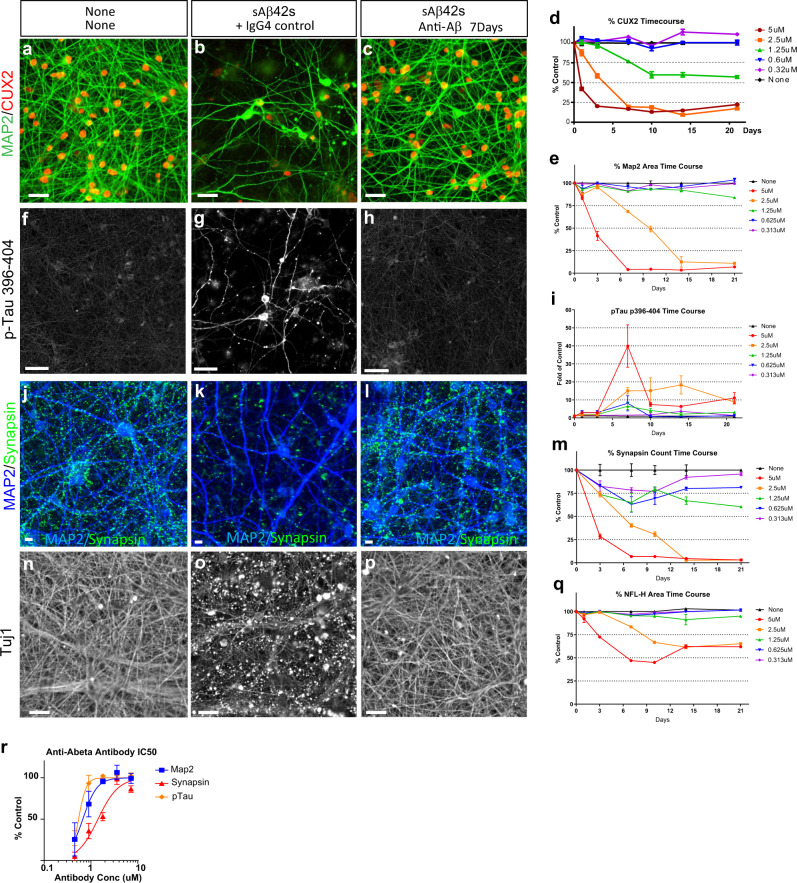
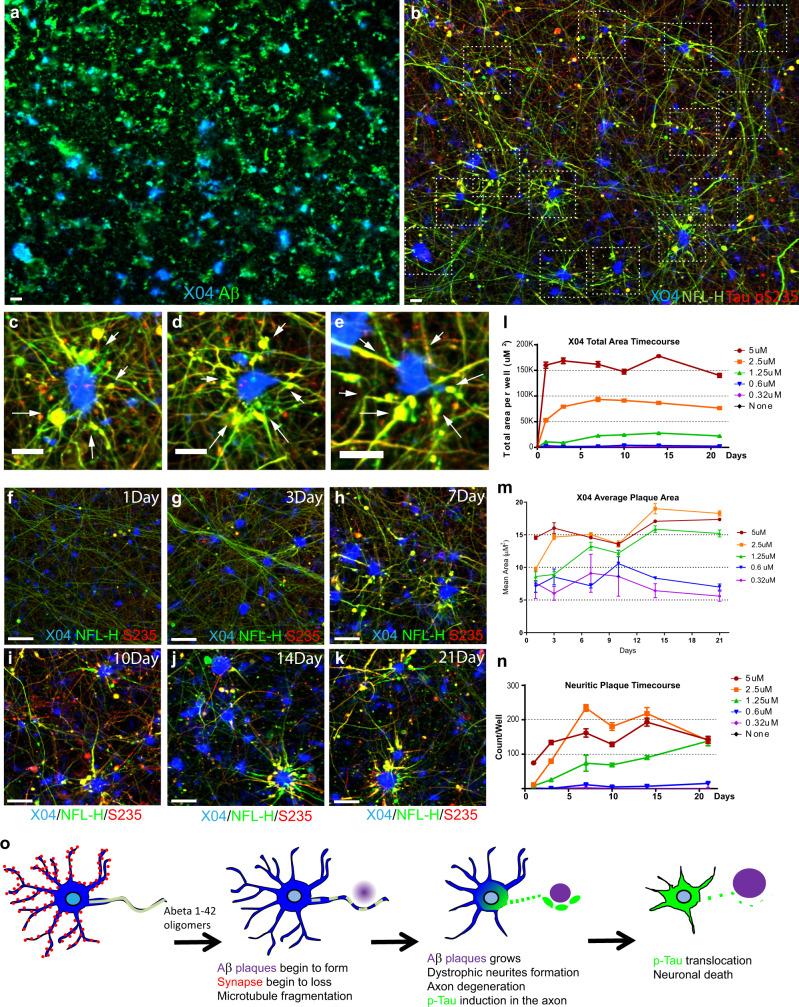
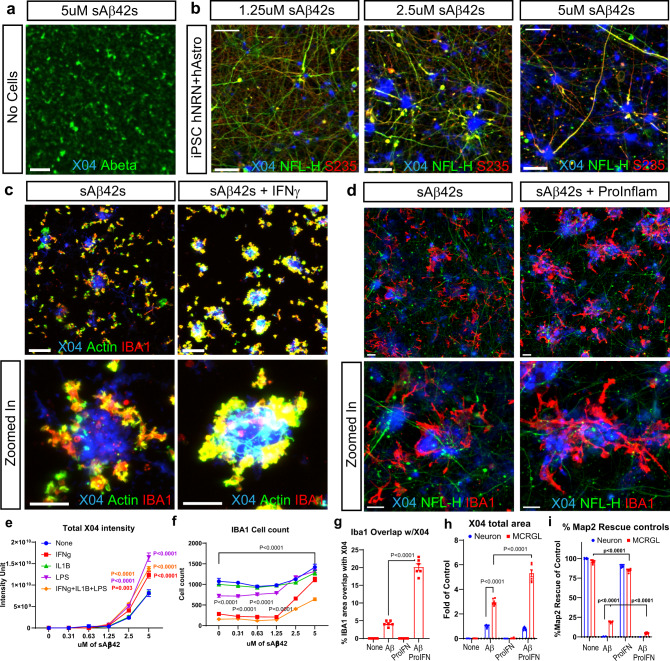
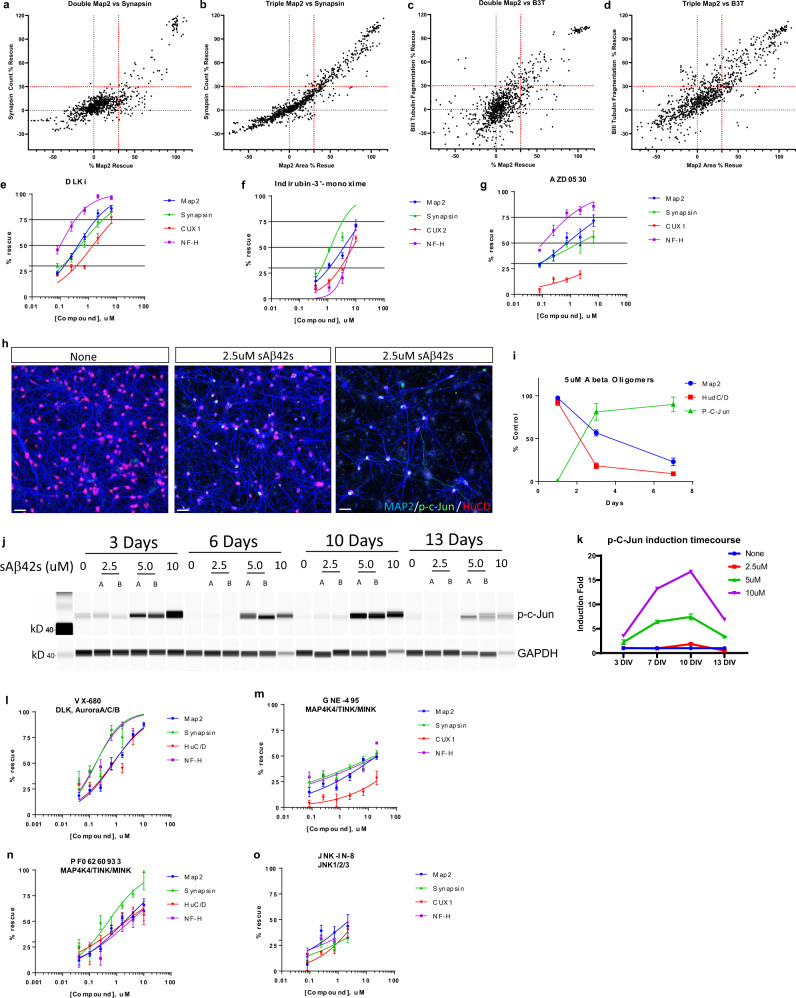
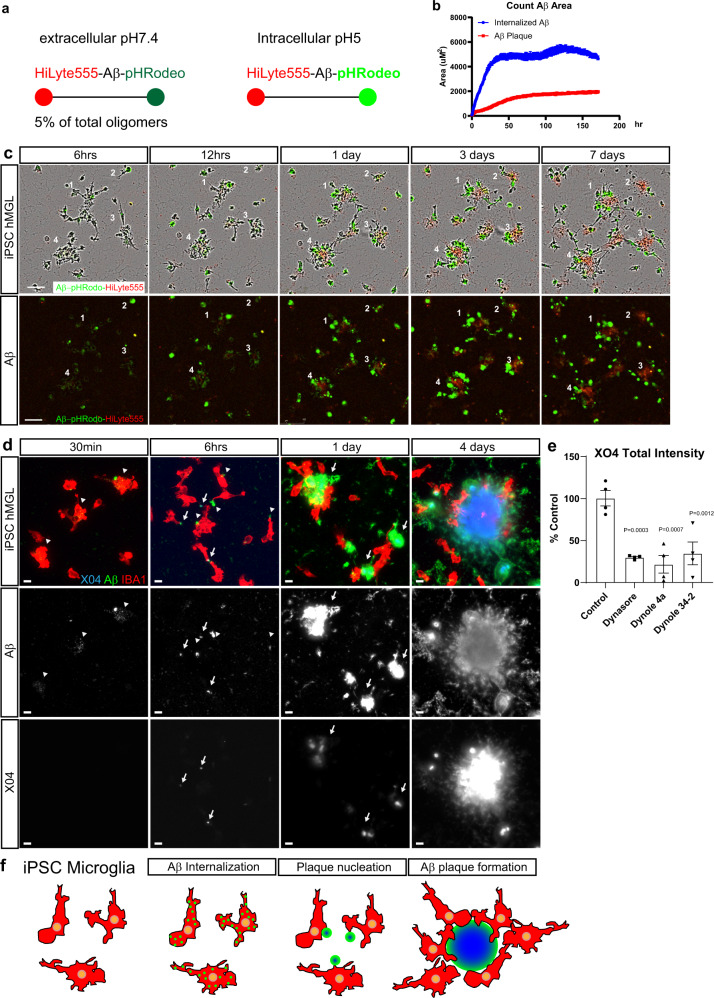
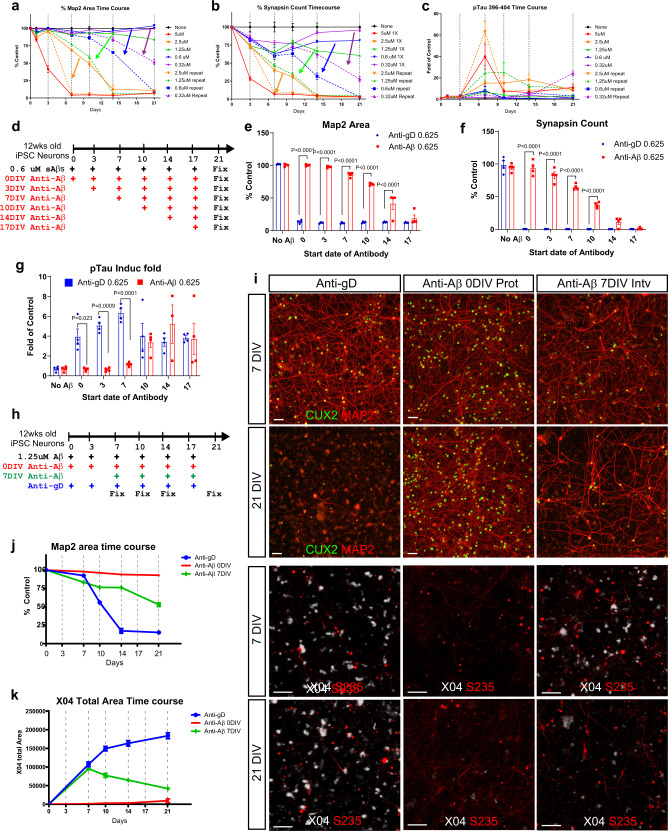
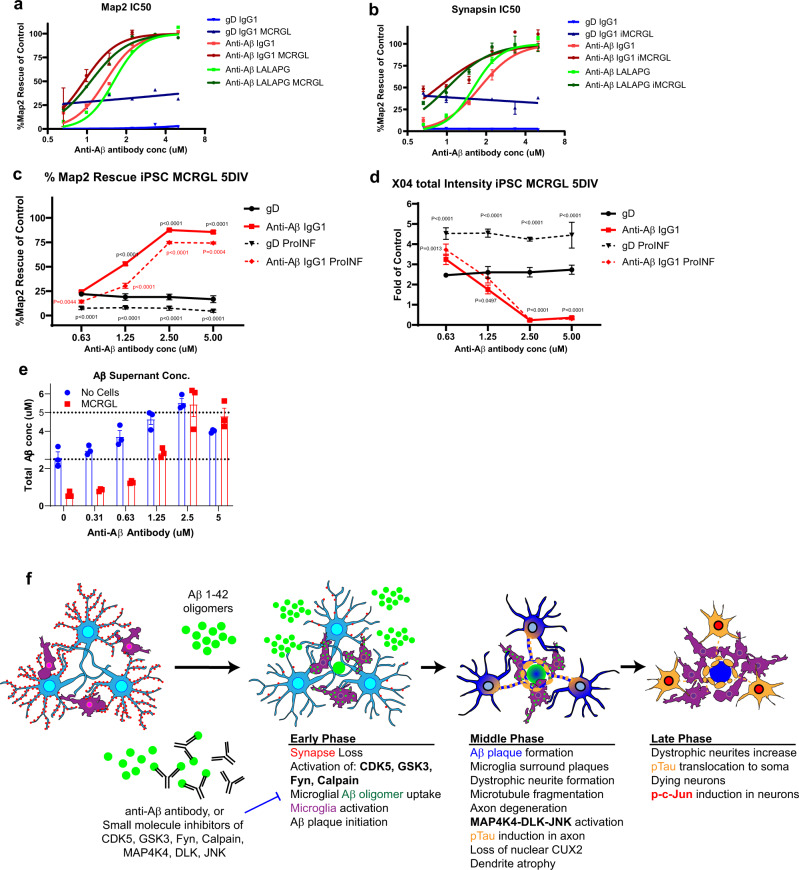
Advancement in human induced pluripotent stem cell (iPSC) neuron and microglial differentiation protocols allow for disease modeling using physiologically relevant cells. However, iPSC differentiation and culturing protocols have posed challenges to maintaining consistency. Here, we generated an automated, consistent, and long-term culturing platform of human iPSC neurons, astrocytes, and microglia. Using this platform we generated a iPSC AD model using human derived cells, which showed signs of Aβ plaques, dystrophic neurites around plaques, synapse loss, dendrite retraction, axon fragmentation, phospho-Tau induction, and neuronal cell death in one model. We showed that the human iPSC microglia internalized and compacted Aβ to generate and surround the plaques, thereby conferring some neuroprotection. We investigated the mechanism of action of anti-Aβ antibodies protection and found that they protected neurons from these pathologies and were most effective before pTau induction. Taken together, these results suggest that this model can facilitate target discovery and drug development efforts.


Conflict of interest statement

All authors were employees of Genentech during the course of these studies.

Figures

Fig. 1
Fig. 1. A high-throughput, automated human iPSC-derived neuron differentiation and culturing platform.
a Schematic workflow of human iPSC neuron differentiation, plating, maintenance, and maturation with automated media change using Fluent liquid handler (Tecan). Mature culture (12 weeks+) is ready for various experimental treatments and conditions. At the end of the experiments, fixed cells are processed for immunostaining using automated plate washers and then quantified with high content image analysis via IN Cell Analyzer 6000 (GE). b Representative images of unsynchronized, heterogeneous WT iPSC-derived NSC differentiation (red arrows indicate differentiated neurons; green arrows indicate undifferentiated NSCs). Scale bar 50 μm. c Stable expression of cumate-inducible NAG construct and treatment with cell cycle inhibitors synchronizes and homogenizes human iPSC neuron differentiation. Scale bar 50 μm. d Representative image of 20 culture plate media change using Fluent workstation (Tecan). e Fluent 384 tip liquid handler head consistently and systematically removes old media and adds new media across all wells per plate. f Integrated incubator and barcoded plates enable automated plate tracking and care. g Automated plate ejection from incubator and h gripper arm retrieves plate then i places it on plate deck for subsequent media change. j Gripper arm removes the lid and places it on plate-lid hotel during media change. k Differentiated NAG neurons express dendritic marker MAP2 (red), layer II/III cortical marker CUX2 (green), with a small subpopulation expressing layer V/VI marker CTIP2 (blue) indicated by white arrows. Scale bar = 50 μm. lr Mature NAG neurons express dendritic marker MAP2 (blue), synaptic markers VGLUT2 (red), Shank (green), scale bar = 20 μm. l Synapsin (red), PSD95 (green), scale bar = 10 μm (m), Pan SHANK (green) (n), PanSAPAP (green) (o), GluR1 (green) (p), GluR2 (green) (q), and NR1 (green) (r). s High content image analysis are made from 9 fields/well in a 384-well plate covering 70% well area. ty Examples of image analysis using IN Cell Developer toolbox companion software to quantitate phenotypes such as dendrites (t, u), synapses (v, w), and axons (x, y) in an automated, systematic, and unbiased way. Careful scripts were developed to isolate exact regions of interest are shown in red on the right panels. Multiple measurements such as total area, total intensity, and count are made for each marker. z Z-factors are calculated from results using a neuron culturing platform and high content image analysis software. Z-factors are in the range from 0.5 to 0.75 and averaged from 10 to 20 different experiments using different batches of neurons. Each experiment with four wells, 1000+ neurons/well quantified. Data are presented as mean values +/− SEM and n = 4 wells.
Fig. 2
Fig. 2. Human iPSC-derived neuronal model of Alzheimer’s disease recapitulates key hallmark AD pathologies.
a, b Differentiated NAG neurons (12 weeks+) show loss of dendrites (MAP2, green) and cell bodies (CUX2, red) when treated with soluble Aβ species for 7 days (b) in comparison to no treatment condition (a). c Anti-Aβ antibody co-treatment with soluble Aβ species blocks Aβ-induced cell death. Scale bar 50 μm. d Dose-dependent, progressive cell death as quantified by the percentage of cell body (CUX2) numbers in Aβ-treated normalized to untreated control. e Dose-dependent, progressive dendritic (MAP2) loss as quantified by the percentage of MAP2 area in Aβ-treated normalized to untreated control. f, g Aβ42 treatment induces phosphorylation of Tau (p-Tau 396–404, white) and mislocalization to the cell body. h Anti-Aβ antibody co-treatment with sAβ42s blocks Aβ-induced Tau hyperphosphorylation. Scale bar 50 μm. i Dose-dependent and time course of phosphorylation of Tau at S396/404. Phospho-Tau induced increase at 5 µM Aβ treatment before decrease associated with cell death occurred as quantified by fold p-Tau 396/404 staining in Aβ-treated normalized to untreated control. j, k Aβ42 treatment causes synapse loss in neurons (synapsin, green). l Anti-Aβ antibody co-treatment with sAβ42s blocks synapse loss phenotype. Scale bar = 5 μm. m Dose–response and time course of synapse (synapsin 1/2) loss in Aβ-treated culture normalized to untreated control. n, o sAβ42s treatment induces axon fragmentation (beta-3 tubulin Tuj1, white). p Anti-Aβ antibody co-treatment blocks axon fragmentation. Scale bar = 50 μm. q Dose–response and time course of axon fragmentation as quantified by percentage of the axon (NFL-H) area in Aβ-treated normalized to untreated control. r Anti-Aβ antibody rescues all three markers in a dose-dependent manner and IC50 curves can be drawn and calculated (IC50 curve fitted by Prism software). Data are presented as mean values +/− SEM and n = 4 wells. All scale bars = 50 μm.
Fig. 3
Fig. 3. Human iPSC neurons form Aβ plaques that are surrounded by dystrophic neurites.
a, b iPSC-derived neurons and primary astrocytes were treated with 2.5 μM sAβ42s for 7 days and stained for Aβ-plaque structures (a) (Methoxy-X04; blue), 6E10 (Aβ; green) (b) axons (NFL-H; green), and p-Tau (S235; red). b Neuritic plaques are indicated by dotted white boxes. ce Zoomed-in images of B showing axonal swelling (NFL-H; green) and p-Tau induction (S235; red) in axons around Aβ-plaque structures (Methoxy-X04; blue). fk Neurons were treated with 2.5 μM sAβ42s and analyzed over a 21-day time course for axonal fragmentation (NFL-H; green), p-Tau induction (S235; red), and plaque formation (Methoxy-X04; blue). Dystrophic neurites composed of NFL-H and p-Tau swellings surrounding X04-positive Aβ-plaques were observed. l, m sAβ42s were added to neuronal cultures at concentrations of 5 μM (red), 2.5 μM (orange), 1.25 μM (green), 0.6 μM (blue), and 0.32 μM (purple) on day 0, and neurons were subsequently fixed at day 1, 3, 7, 10, 14, and 21 and stained for various markers. Plaque formation (methoxy-X04-dye-positive regions) begins early after Aβ oligomer treatment and total plaque area (l) increases with high Aβ oligomer concentrations over time and reached maximum area at 7 days. m Average plaque area follows a similar trend, where average plaque size increased to around 15–20 μm and stabilized. n Neurons exhibit dystrophic neurite formation (measured by S235 p-Tau and NFL-H positive axon area) and these neuritic plaques increases in number with high Aβ oligomer concentrations and over time. o Schematic showing a summary of the observed sequential events of neurodegeneration, plaque, and dystrophic neurite formation. Data are presented as mean values +/− SEM and n = 4 wells. All scale bars = 50 μm.
Fig. 4
Fig. 4. Microglia activation increases Aβ plaque formation but reduces neuroprotection.
a sAβ42s were added to empty wells (scale bar = 20 μm) or b 12-week-old iPSC neurons at the indicated concentrations. All wells were stained with X04 (blue), Aβ (green), NFL-H (green), and p-Tau S235 (red). Empty wells have Aβ precipitates but no XO4 positive structure. In iPSC neuron wells, there is a dose-dependent increase of X04 staining. A Subset of XO4 is also surrounded by dystrophic neurites (NFL-H and S235 positive axonal swellings). Scale bar = 50 μm. c Microglia treated with sAβ42s ranging from 0 to 5 μM and also treated in combination with IFNγ. The panel below shows a zoomed-in section. Aβ plaques are stained with X04 (blue), microglia are labeled with Actin (green), and IBA1 (red). Scale bar = 50 μm. IFNγ increases plaque formation and plaque interaction. e Quantification of X04 intensity. f Quantification of IBA1 number. d Neuron and astrocytes coculture and triculture of neurons, astrocytes, and microglia were treated with sAβ42s with or without pro-inflammatory cytokine combination (IFNy + IL1b + LPS). Representative images from indicated conditions are shown. The lower panel of zoomed images is shown. Aβ plaque was stained with X04 (blue), dystrophic neurites swellings were stained with NFL-H (green), and microglia were labeled with IBA1 (red). In triple culture, sAβ42s addition led to Aβ plaque formations surrounded by dystrophic neurites and encircled by microglia similar to plaque presentation in vivo. Scale bar = 20 μm. g The area of IBA1 overlap with X04 is quantified. Pro-inflammatory cytokines increased microglia association with plaque. h Microglia increased the X04 plaque area, as measured by the total area of X04 staining. Pro-inflammatory cytokine addition increased the plaque area furthermore. MAP2 areas were also quantified in (i). sAβ42s addition caused a severe reduction to neuron culture. Microglia culture provided 25% MAP2 protection from sAβ42s. This protection is lost when pro-inflammatory cytokine is added. Data are presented as mean values +/− SEM and n = 4 wells. Two-way ANOVA with (e, f, h, i) Tukey’s or (g) Dunnett’s multiple comparisons test.
Fig. 5
Fig. 5. Focused small-molecule screen identifies DLK-JNK-cJun pathway inhibition protects human neurons from Aβ oligomer toxicity.
ad Neurons and astrocytes (a, c) or neurons, astrocytes, and microglia (b, d) were treated with 5 μM sAβ42s and small molecules from a focused screen of known neuroprotective agents at multiple concentrations (50, 25, 12.5, and 6.25 μM (double culture), 50, 12.5, 3.1, and 0.78 μM (triple culture). Results were graphed as Synapse % rescue versus MAP2 % rescue (a, b) and Beta III tubulin % rescue versus MAP2 % rescue (c, d). Small molecules that prevented toxicity in dendrites (MAP2), synapses (Synapsin 1/2), cell count (CUX2), or axons (NFL-H) at or above 30% were considered hits (red dotted line); anti-Aβ antibody used as a positive control that prevented all types of toxicity. eg Further validation of top hits DLKi (e), Indirubin-3′-monoxime (f), and AZD0530 (g) from the focused screen by IC50 curves against MAP2 (blue), Synapsin 1/2 (green), CUX2 (red), and NFL-H (purple). h sAβ42s treatment induced expression of p-cJun (green) in the nucleus (HuCD, red). i Quantification of MAP2 (blue), HuC/D (red), p-cJun (green) staining indicated an increase in cJun phosphorylation with prolonged sAβ42s treatment. j 22-week-old iPSC neuron culture treated with sAβ42s showed dose-dependent, sustained phosphorylation of cJun as shown by western blot. GAPDH served as the loading control. k Western blot quantification of p-cJun induction normalized to GAPDH. lo Inhibition of known components of DLK-JNK-cJun pathway using small molecules VX-680 (l), GNE-495 (m), PF06260933 (n), JNK-IN-8 (o) prevents sAβ42s-induced neural toxicity in all measured markers in a dose-dependent manner. Data are presented as mean values +/− SEM and n = 4 wells (eg, I, ko). IC50 curves fitted by Prism software (eg, mo).
Fig. 6
Fig. 6. Human iPSC microglia internalizes soluble Aβ species to form extracellular plaques.
a Schematic showing sAβ42s labeled by HiLyte-555 and pHrodo Green continuously fluoresce red, but only fluoresce green under intracellular pH 5 conditions. b Quantitative analysis of red Aβ plaque area and green internalized Aβ. Internalized green Aβ outpace the red extracellular Aβ plaque formation, indicating active Aβuptake throughout the 7 days and proceed before the appearance of red Aβ plaques. c Example images of the plaque formation time-lapse movie. Four different plaque formations are retrospectively labeled. sAβ42s are first internalized by microglia (green) before plaque formation (red) in the center of the cultured microglia. Scale bar = 100 μm. d iPSC-derived microglia were treated with 5 μM sAβ42s, then fixed and stained after 30 min, 6 h, 1 day, and 4 days. Microglia (IBA1, red) internalize small Aβ puncta (green; white—the second row) indicated by white arrowheads (green) after 30 min, then externalize these puncta as large aggregates that are faintly X04 positive (blue; white—bottom row) indicated by white arrows, then form large, extracellular X04-positive plaque structures surrounded by microglia from 1 to 6 days. e Human iPSC-derived microglia were treated with 5 μM soluble Aβ species and various dynamin inhibitors (Dynasore, Dynole 4a, Dynole 34-2) at 0.6 μM for 24 h and plaque-like structures (Methoxy-X04-positive) were quantified as a percentage of control. Treating with dynamin inhibitors decreased plaque formation approximately fourfold in all conditions. f A summary of steps of microglia plaque formation observed. Data are presented as mean values +/− SEM and n = 4 wells. One-way ANOVA with Dunnett’s multiple comparisons test.
Fig. 7
Fig. 7. An early window of efficacy for anti-Aβ antibody revealed by disease progression modeling.
ac Time-course comparison of 12-week-old iPSC neurons treated with a single dose of sAβ42s (solid lines) versus repeated dose of sAβ42s at the same concentration (dotted lines) at the indicated concentration. MAP2 area (a), Synapse count (b), and p-Tau 396–404 induction fold (c) were quantified. d Repeated dosing schedule of 12-week-old neuron with 0.6 μM of Aβ. Anti-Aβ antibodies dosing regimen was started at indicated time point. All cells were treated in the same plate and fixed at 21 days post first dose. MAP2 area (e), synapsin count (f), and p-Tau induction fold (g) were quantified. Anti-gD antibodies were dosed similarly as control (blue bars) along with anti-Aβ antibody (red bar). h Time-course study design of Anti-Aβ antibodies repeated dosing. sAβ42s are added at every indicated timepoints. Anti-Aβ antibodies were added at day 0 (red) as a protection model or at day 7 (green) as an intervention model. Anti-gD antibodies were used as control (blue). i Representative images from the indicated experimental treatments. Neurons were stained for dendrite marker MAP2 (red) and nuclear marker CUX2 (green) at 7DIV and 21DIV. The lower panel shows Aβ plaque staining (X04, white) and p-Tau S235 (red) staining. Quantification of MAP2 area over time (j) and plaque area (k) illustrated that the anti-Aβ intervention model is capable of slowing down neuron degeneration and plaque formation. Scale bars = 50 μm. Data are presented as mean values +/− SEM and n = 4 wells. Two-way ANOVA with Tukey’s multiple comparisons test.
Fig. 8
Fig. 8. Anti-Aβ protects neurons by keeping Aβ soluble in supernatant and antibody effector function is not required.
a, b iPSC neurons and astrocytes treated with 5 μM sAβ42s followed by serial dilutions of anti-gD and anti-Aβ antibodies with IgG1 and LALAPG backbones with and without iPSC microglia. Results for dendrite protection (MAP2 area) (a) and synapse protection (synapsin count) (b) were analyzed via IC50 curve fitting using Prism software. Microglia provide baseline protection as shown by an upward shift in the anti-gD graph when microglia are added (gD IgG1 alone, blue; gD IgG1 + microglia, dark blue). Anti-Aβ antibody backbones protect dendrites and synapses similarly without microglia (Anti-Aβ IgG1, red; Anti-Aβ LALAPG, green) and with microglia (Anti-Aβ IgG1, dark red; Anti-Aβ LALAPG, dark green). c, d Neuron, astrocyte, microglia triculture treated with 5 μM sAβ42s (solid lines) and pro-inflammatory cytokines (dashed lines), then serial dilutions of gD antibody (black lines) and anti-Aβ antibody (red lines) were added. c Basal dendrite protection (MAP2 area) is lost in a neuroinflammatory environment, and anti-Aβ shows dose-dependent efficacy. d Plaque formation (Methoxy-X04 total intensity) increases in pro-inflammatory conditions, however, anti-Aβ shows similar plaque reduction. e iPSC microglia (red) were treated with 5 sAβ42s and serial dilutions of anti-Aβ antibody; no cells wells were used as control (blue). The supernatant was collected and anti-Aβ ELISA was performed to measure total Aβ concentration. Anti-Aβ antibody treatment increases soluble Aβ species present in the culture supernatant. f Summary of sequential events in the iPSC AD model. Data are presented as mean values +/− SEM and n = 4 wells. Two-way ANOVA with Tukey’s multiple comparisons test.

References

    1. Shi Y, Kirwan P, Smith J, Robinson HP, Livesey FJ. Human cerebral cortex development from pluripotent stem cells to functional excitatory synapses. Nat. Neurosci. 2012;15:S471. doi: 10.1038/nn.3041. - DOI - PMC - PubMed
    1. Boissart C, et al. Differentiation from human pluripotent stem cells of cortical neurons of the superficial layers amenable to psychiatric disease modeling and high-throughput drug screening. Transl. Psychiatry. 2013;3:e294. doi: 10.1038/tp.2013.71. - DOI - PMC - PubMed
    1. Tian R, et al. CRISPR interference-based platform for multimodal genetic screens in human iPSC-derived neurons. Neuron. 2019;104:e212. doi: 10.1016/j.neuron.2019.07.014. - DOI - PMC - PubMed
    1. Wang C, et al. Scalable production of iPSC-derived human neurons to identify Tau-lowering compounds by high-content screening. Stem Cell Rep. 2017;9:1221–1233. doi: 10.1016/j.stemcr.2017.08.019. - DOI - PMC - PubMed
    1. Braak H, Braak E. Neuropathological stageing of Alzheimer-related changes. Acta Neuropathol. 1991;82:239–259. doi: 10.1007/BF00308809. - DOI - PubMed