. 2021 Sep 1;12(1):5228.
doi: 10.1038/s41467-021-25131-3.

EpiScanpy: integrated single-cell epigenomic analysis

Affiliations

EpiScanpy: integrated single-cell epigenomic analysis

Anna Danese et al. Nat Commun. .

Abstract

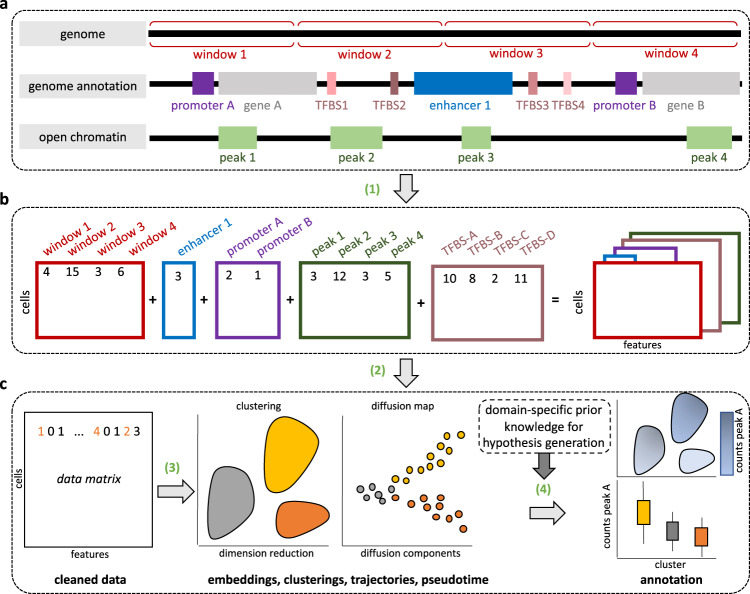
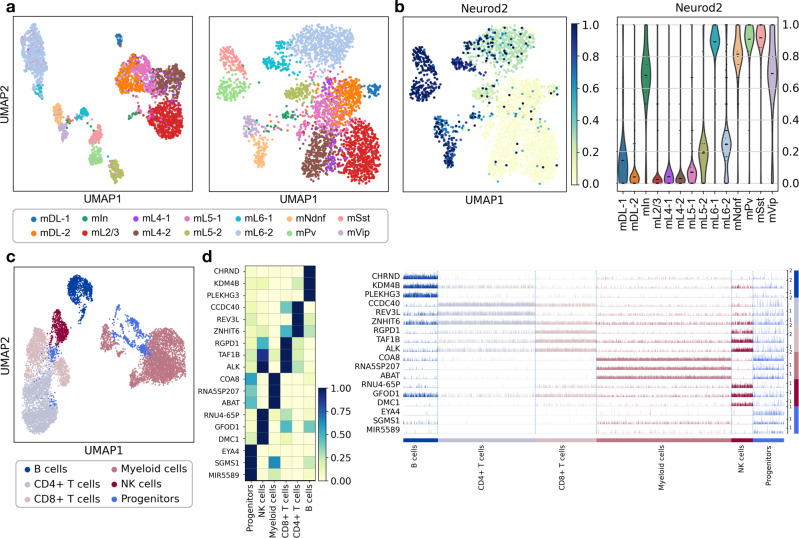
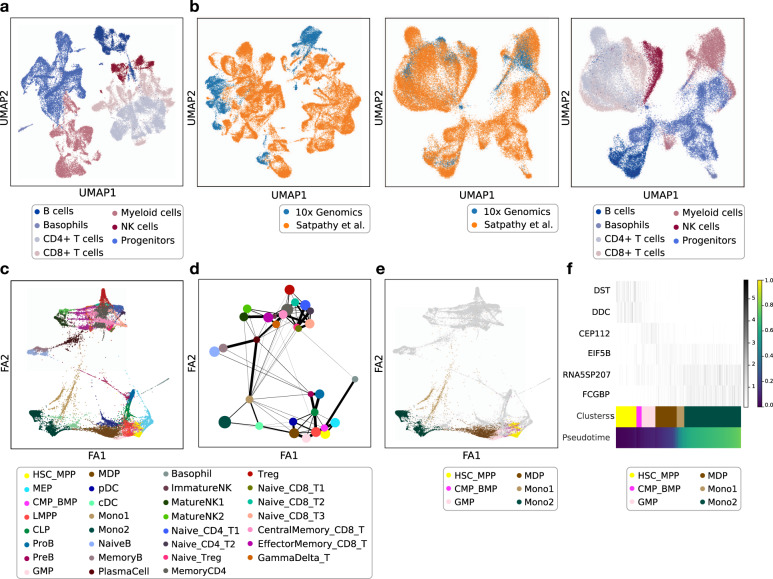
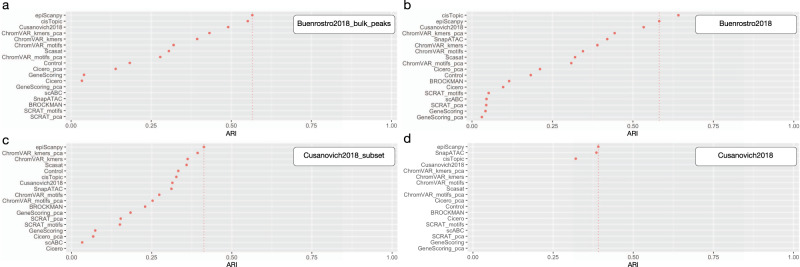
EpiScanpy is a toolkit for the analysis of single-cell epigenomic data, namely single-cell DNA methylation and single-cell ATAC-seq data. To address the modality specific challenges from epigenomics data, epiScanpy quantifies the epigenome using multiple feature space constructions and builds a nearest neighbour graph using epigenomic distance between cells. EpiScanpy makes the many existing scRNA-seq workflows from scanpy available to large-scale single-cell data from other -omics modalities, including methods for common clustering, dimension reduction, cell type identification and trajectory learning techniques, as well as an atlas integration tool for scATAC-seq datasets. The toolkit also features numerous useful downstream functions, such as differential methylation and differential openness calling, mapping epigenomic features of interest to their nearest gene, or constructing gene activity matrices using chromatin openness. We successfully benchmark epiScanpy against other scATAC-seq analysis tools and show its outperformance at discriminating cell types.


Conflict of interest statement

F.J.T. reports receiving consulting fees from Roche Diagnostics GmbH and Cellarity Inc., and ownership interest in Cellarity, Inc.. The other authors declare no competing interests.

Figures

Fig. 1
Fig. 1. EpiScanpy analysis workflow.
a epiScanpy quantifies chromatin openness and DNA methylation at different sets of genomic regions to b construct count matrices (1) with read counts (for scATAC-seq) or DNA methylation levels (for single-cell DNA methylation). c After data pre-processing (2), unsupervised learning algorithms (clusters, trajectories, lineage trees) are applied (3). Differential openness and methylation callings allow for identification of marker loci, which can be used for cell type and lineage tree identification (4).
Fig. 2
Fig. 2. Clustering, visualisation and cell-type annotation for single-cell DNA methylation data and scATAC-seq data.
a UMAP with annotated cell types for neurons from single-cell DNA methylation data from Luo et al., performed on the enhancer feature space (left, 3,288 cells x 54,932 enhancers) and promoter feature space (right, 3,224 cells x 32,610 promoters). Annotation: m mouse, DL deep layer, L layer, Ndnf neuron-derived neurotrophic factor, Pv parvalbumin, Sst somatostatin, Vip vasoactive intestinal peptide, In interneurons. b UMAP with methylation level at the Neurod2 promoter (a marker of inhibitory neurons) per cell (left) and violin plot with the distribution of Neurod2 promoter methylation per cluster (same colour code as in a). Excitatory neurons (mDL-1, mDL-2, mL2/3, mL4-1, mL4-2, mL5-1, mL5-2, mL6-1, mL6-2) have lower methylation at the Neurod2 promoter than inhibitory neurons (mNdnf, mPv, mSst, mVip, mIn). c UMAP with annotated cell types for PBMCs from scATAC-seq data from the 10x platform, performed on the open chromatin peak feature space (9,891 cells x 75,226 peaks). d Heatmap and track plot indicating openness of the top differential open peaks and their associated genes, which are markers of B cells (CHRND, KDM4B and PLEKHG3, marked in dark blue), T cells (CCDC40, REV3L, ZNHIT6 for CD4+, marked in light grey and RGPD1, TAF1B and ALK for CD8+, marked in light pink), myeloid cells (COA8, RNA5SP207 and ABAT, marked in dark pink), NK cells (RNU4-65P, GFOD1 and DMC1, marked in burgundy) and hematopoietic progenitors (EYA4, SGMS1, and MIR5589, marked in blue). On the heatmap plot, the mean openness per cluster is indicated with a colour scale from 0 (closed) to 1 (open). On the track plot, the openness per cell inside of every cluster is plotted from 0 (closed) to 1 (open). These different cell type identification plots are shown here for DNA methylation (b) and ATAC-seq (d), but all plots are available for all modalities (Supplementary Figs. 7–9).
Fig. 3
Fig. 3. Data integration, partition-based graph abstraction (PAGA) and diffusion pseudotime in scATAC-seq.
a UMAP with annotated cell types from scATAC-seq for blood cells from Satpathy et al., performed on the peak feature space (57,177 cells x 83,823 peaks). Only the broad cell type annotation is shown. b Joint UMAP for two scATAC-seq datasets with experiment label (10x Genomics and Satpathy et al.) for concatenated count matrices (left) and mixed using BBKNN with experiment label (middle) and cell type label (right) (62,284 cells x 123,280 peaks). c Force-directed graph drawing of the Satpathy et al. dataset. d PAGA plot for the same cells using the same Force-directed graph embedding. e Monocyte differentiation path depicted on top of the force-directed graph drawing, and f openness of peaks at marker genes during pseudotime progression (distance) in the monocyte differentiation path (16,004 cells x 83,823 peaks).
Fig. 4
Fig. 4. Benchmarking of cell clustering performance.
Adjusted rand index (ARI) for Louvain clustering in a Buenrostro et al. dataset for bulk peaks with 2,034 cells, b Buenrostro et al. dataset with 150,429 open features and 2,034 cells, c Cusanovich et al. mouse atlas downsampled to 12,178 cells, d full Cusanovich et al. mouse atlas with 81,173 cells. EpiScanpy performance results are compared to the results of 11 other scATAC-seq methods benchmarked in Chen et al.. The dotted lines indicate epiScanpy’s ARI value.

References

    1. Smallwood SA, et al. Single-cell genome-wide bisulfite sequencing for assessing epigenetic heterogeneity. Nat. Methods. 2014;11:817–820. doi: 10.1038/nmeth.3035. - DOI - PMC - PubMed
    1. Buenrostro JD, et al. Single-cell chromatin accessibility reveals principles of regulatory variation. Nature. 2015;523:486–490. doi: 10.1038/nature14590. - DOI - PMC - PubMed
    1. Luo C, et al. Single-cell methylomes identify neuronal subtypes and regulatory elements in mammalian cortex. Science. 2017;357:600–604. doi: 10.1126/science.aan3351. - DOI - PMC - PubMed
    1. Cusanovich DA, et al. A single-cell atlas of in vivo mammalian chromatin accessibility. Cell. 2018;174:1309–1324.e18. doi: 10.1016/j.cell.2018.06.052. - DOI - PMC - PubMed
    1. Satpathy AT, et al. Massively parallel single-cell chromatin landscapes of human immune cell development and intratumoral T cell exhaustion. Nat. Biotechnol. 2019;37:925–936. doi: 10.1038/s41587-019-0206-z. - DOI - PMC - PubMed

Publication types