. 2021 Sep 1;12(1):5217.
doi: 10.1038/s41467-021-25282-3.

Cytotoxic T cells are able to efficiently eliminate cancer cells by additive cytotoxicity

Affiliations

Cytotoxic T cells are able to efficiently eliminate cancer cells by additive cytotoxicity

Bettina Weigelin et al. Nat Commun. .

Abstract

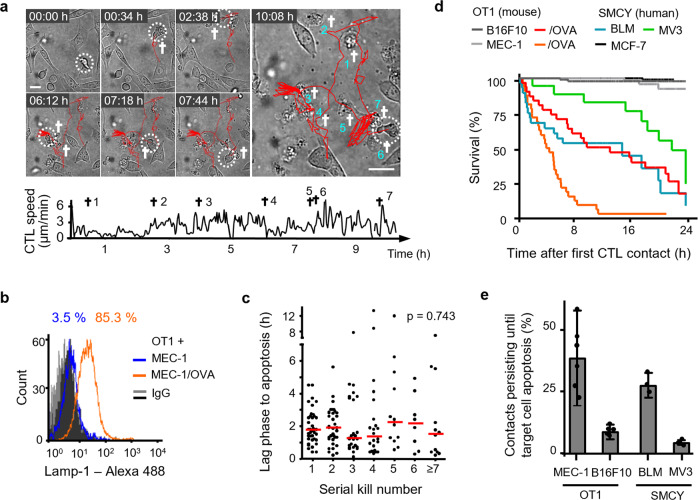
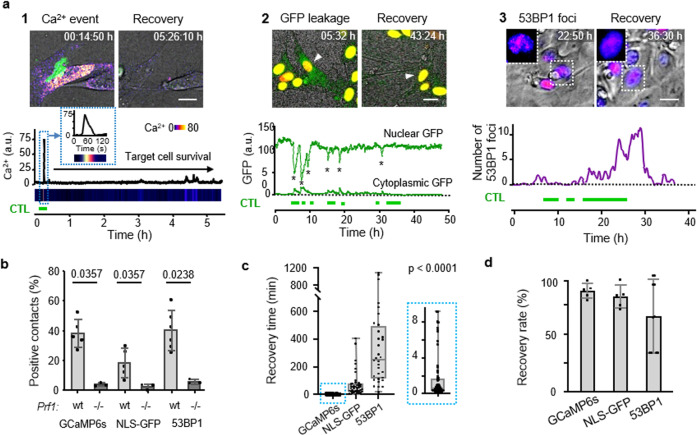
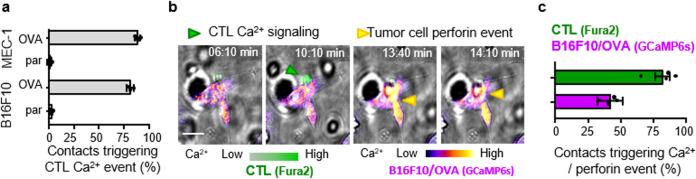
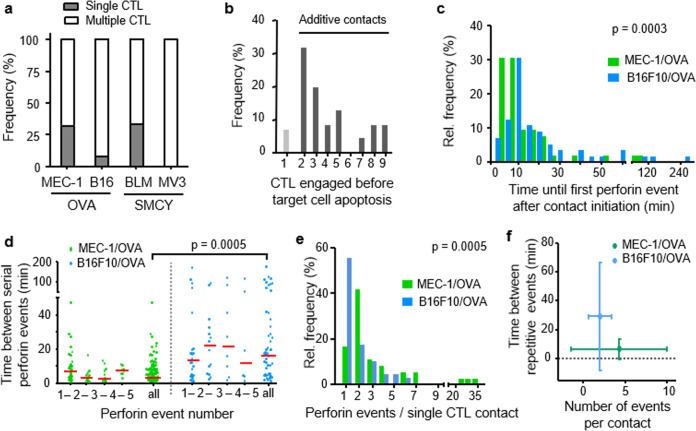
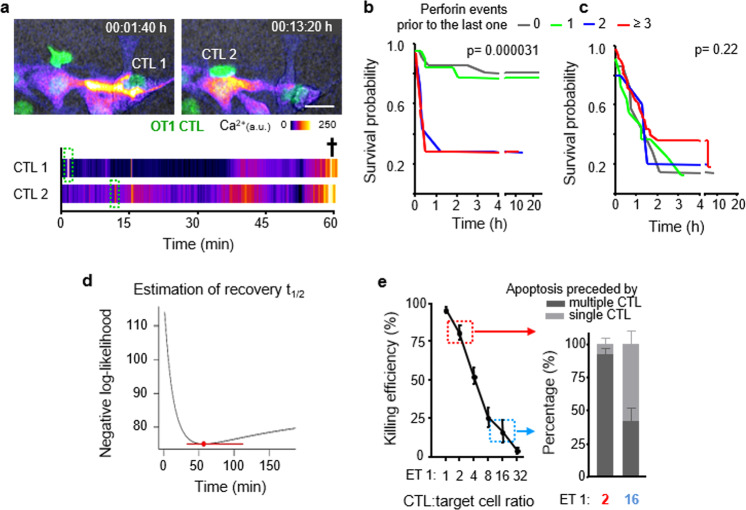
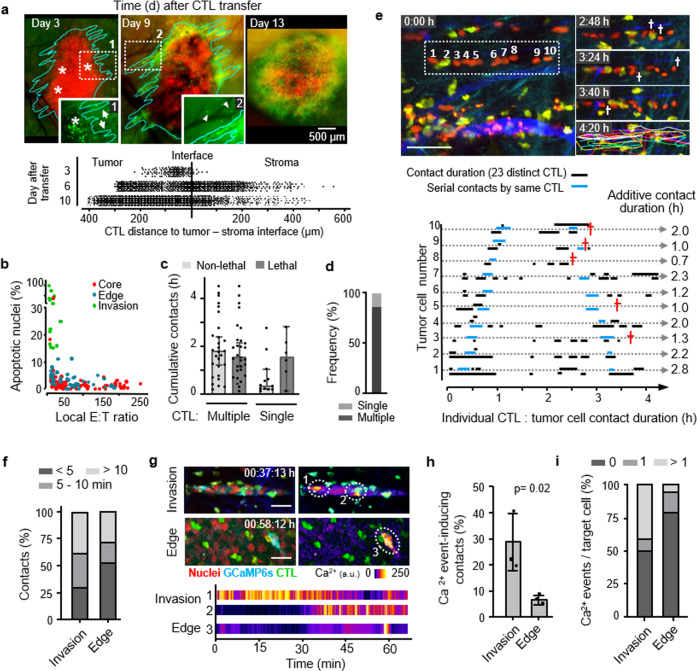
Lethal hit delivery by cytotoxic T lymphocytes (CTL) towards B lymphoma cells occurs as a binary, "yes/no" process. In non-hematologic solid tumors, however, CTL often fail to kill target cells during 1:1 conjugation. Here we describe a mechanism of "additive cytotoxicity" by which time-dependent integration of sublethal damage events, delivered by multiple CTL transiting between individual tumor cells, mediates effective elimination. Reversible sublethal damage includes perforin-dependent membrane pore formation, nuclear envelope rupture and DNA damage. Statistical modeling reveals that 3 serial hits delivered with decay intervals below 50 min discriminate between tumor cell death or survival after recovery. In live melanoma lesions in vivo, sublethal multi-hit delivery is most effective in interstitial tissue where high CTL densities and swarming support frequent serial CTL-tumor cell encounters. This identifies CTL-mediated cytotoxicity by multi-hit delivery as an incremental and tunable process, whereby accelerating damage magnitude and frequency may improve immune efficacy.


Conflict of interest statement

The authors declare no competing interests.

Figures

Fig. 1
Fig. 1. CTL serial conjugation and effector function in different tumor models.
a Time-lapse sequence and migration track of one OT1 CTL killing seven MEC-1/OVA target cells sequentially within 11 h. Circles, CTL; cross, apoptotic target cell; scale bar, 20 µm. Representative example of a serial killer CTL derived from analysis of 43 CTL pooled from 8 independent experiments). b Lamp-1 expression at the surface of OT1 CTL after 24 h of 3D co-culture with MEC-1/OVA cells. Representative example from three independent experiments. c Lag phase until apoptosis of consecutive single interaction kills by the same CTL (43 CTL from 8 independent experiments). Red bars, median. p-Value, Kruskal–Wallis test. d Population survival of four antigen-dependent mouse and human target, and three control cell lines. Quantifications from three independent experiments for each cell line. B16F10, 98 cells; B16F10/OVA, 31 cells; MEC-1, 57 cells; MEC-1/OVA, 32 cells; BLM, 28 cells; MV3, 18 cells; MCF-7, 102 cells. e Inefficiency of inducing apoptosis by individual CTL contacts in OT1 and SMCY.A2 CTL models. Error bars, mean ± SD obtained from 104 MEC-1/OVA, 183 B16F10/OVA, 53 BLM, and 50 MV3 contacts from N = 5 (MEC-1/OVA, B16F10/OVA) or 3 (BLM, MV3) independent experiments per cell model. Source data are provided as a Source Data file.
Fig. 2
Fig. 2. Type and kinetics of sublethal damage induced by CTL.
a Reporter strategies. Green horizontal bars, duration of CTL contacts. Panel 1: CTL-mediated perforin pores visualized as Ca2+ influx into B16F10/OVA target cells using the GCaMP6s reporter. Time-resolved intensity plot of GCaMP6s event in the target cell cytosol followed by survival. Green, OT1 CTL (GFP); Fire LUT, Ca2+ level (GCaMP6s). Panel 2: CTL-mediated structural damage of the nuclear lamina monitored as NLS-GFP leakage into the cytosol. Nuclear and cytosolic GFP intensity plotted over time. Green, NLS-GFP; red: Histone-2B-mCherry; arrowhead: monitored cell. Asterisks, nuclear leakage events. Panel 3: CTL-mediated DNA damage response plotted as 53BP1trunc-Apple focalization in the nucleus over time. Fire LUT, 53BP1trunc-Apple. Insets, zooms of reversibility of 53BP1 foci. Scale bars, 10 µm. Image sequences in panels 1 and 2 show representative examples from experimental datasets shown in bd. b Percentage of contacts of wt and perforin-deficient CTL with B16F10/OVA cells inducing Ca2+ events, NLS-GFP cytosolic leakage, and 53BP1trunc-Apple foci in target cells. Data show the mean ± SD from N = 3 (GCaMP6s/wt, NLS-GFP/wt/prf1−/−), 5 (53BP1trunc-Apple/wt), and triplicate movies from 1 (GCaMP6s/prf1−/−, NLS-GFP/prf1−/−) independent experiments. p-Values, two-tailed Mann–Whitney test comparing wt and prf1−/− datasets. c Recovery times from initiation to termination of GCaMP6s, NLS-GFP, and 53BP1trunc-Apple reporter activity. Data show the medians with whiskers from minimum to maximum values derived from N = 32 (53BP1trunc-Apple), 40 (NLS-GFP), and 71 (GCaMP6s) individual events pooled from 3 (NLS-GFP, GCaMP6s) and 5 (53BP1trunc-Apple) independent experiments. p-Value, Kruskal–Wallis test comparing all groups corrected by Dunn’s multiple comparisons test. d Percentage of cells with sublethal damage event, which fully resolved. Data show the mean ± SD (five independent experiments per reporter) for an 1:2 ET ratio. Source data are provided as a Source Data file.
Fig. 3
Fig. 3. Correlation between CTL Ca2+ signaling and perforin pore formation in different target cells.
a Percentage of CTL contacts associated with Ca2+ events in OVA-expressing target cells (OVA) compared to OVA-negative parental (par) cells. Data show the means ± SD from three independent experiments. b Image sequence of Fura2-labeled OT1 CTL during contact with GCaMP6s-expressing B16F10/OVA cell. Arrowheads: green, Fura2-positive event; yellow, GCaMP6s-positive event. Scale bar, 10 μm. c Percentage of contacts triggering Ca2+ events in OT1 CTL or B16F10/OVA target cells, respectively. Quantification (means and SD) was performed by manual analysis from 78 contacts pooled from N = 4 independent experiments. Source data are provided as a Source Data file.
Fig. 4
Fig. 4. Kinetics and frequency of CTL-induced sublethal events.
a Percentage of apoptosis events preceded by multiple or single CTL contacts in mouse and human melanoma models. Pooled data representing ≥100 contacts from ≥3 independent experiments per cell line. b Percentage of CTL engaged before target cell death in B16F10/OVA co-culture with OT1 CTL. c Lag phase until first Ca2+ event after contact initiation in MEC-1/OVA and B16F10/OVA target cells. Data from 55 (B16F10) and 52 (MEC-1) Ca2+ events. p-Value, two-tailed Mann–Whitney test. d Intervals between sequential Ca2+ events in the target cell induced by the same CTL in one single contact. Medians were 4 min (MEC-1/OVA) and 18 min (B16F10/OVA). Red line, median. Data show 53 (B16F10) and 119 (MEC-1) Ca2+ events. p-Value, two-tailed Mann–Whitney test. e Number of Ca2+ events associated with the same CTL. Data show 55 (B16F10) and 36 (MEC-1) CTL. Data from b to d pooled from three (B16F10) and two (MEC-1) independent experiments. p-Values, two-tailed Mann–Whitney test. f Number of Ca2+ events per CTL contact plotted against frequency of sequential Ca2+ events in MEC-1/OVA cells compared to the B16F10/OVA cells. Data from 53 (B16F10) and 119 (MEC-1) Ca2+ events pooled from 3 (B16F10/OVA) and 2 (MEC-1/OVA) independent experiments. Source data are provided as a Source Data file.
Fig. 5
Fig. 5. Additive cytotoxicity and estimation of damage recovery half-life.
a Time-lapse sequence and intensity plot of multiple Ca2+ events followed by target cell apoptosis. Green fluorescence, OT1 CTL (dsRed); Fire LUT, Ca2+ intensity (GCaMP6s). Cross, target cell death; Scale bar, 20 µm. Image sequence shows a representative example from 124 perforin events preceding N = 63 B16F10/OVA apoptosis events, pooled from 5 independent experiments. b Survival probability of B16F10/OVA cells having received increasing numbers of Ca2+ events. c Simulation of stochastic apoptosis induction by permutation of waiting times between Ca2+ events, survival, and lag times until apoptosis. p-Values in c, d, two-sided log rank test comparing all groups. d Estimation of damage recovery half-life in B16F10/OVA after one single Ca2+ event by a statistical model that assumes additive killing (see “Methods”). Point and error bar: damage half-life that is most consistent with the data and at 95% confidence interval. Data in bd represent 124 perforin events related to N = 63 B16F10/OVA apoptosis events, pooled from 5 independent experiments. e Killing efficacy of B16F10/OVA cells and percentage of preceding single or multiple interacting CTL in dependence of ET ratio. Left panel, means and SD from N = 2 independent experiments; right panel, 110 contacts from N = 4 independent experiments per ET ratio. Source data are provided as a Source Data file.
Fig. 6
Fig. 6. Additive cytotoxicity in live tumors detected by intravital multiphoton microscopy.
a Time-dependent CTL accumulation along the tumor–stroma interface. Red, nuclei B16F10/OVA cells; green: OT1 CTL. Lower panel, position of individual CTL. Representative example of one tumor. b Correlation of CTL density and apoptotic frequency in tumor subregions. Data show 135 apoptosis events pooled from 8 independent mice. c Cumulative contact duration and outcome of single or multiple CTL contacting B16F10/OVA cells. Data represent the median with whiskers from 25 to 75 percentile values. d Frequency of apoptosis induction associated with single or multiple interacting CTL. Data in c, d represent N = 40 nonlethal and 37 apoptotic events from 150 h of movies pooled from 20 independent tumors. Error bars, mean ± SD. e Representative micrographs and quantification of serial engagements of multiple CTL with B16F10/OVA cells and outcome. Red cross, target cell apoptosis. Ten target cells from one tumor. f Percentage of contacts between CTL with B16F10/OVA cells and duration category in the invasion zone vs. tumor edge. g Images from time-lapse recordings of GCaMP6s activity in B16F10/OVA target cells in distinct tumor subregions. Dotted circles indicate the example areas plotted for GCaMP6s intensity in the graph below. Image sequence shows a representative example from the dataset analyzed in h, i. h Percentage of CTL contacts that induced one or more Ca2+ events in invasion zones vs. CTL-rich subregions at the tumor edge. i Percentage of tumor cells receiving none, one, or more than one Ca2+ event within a cumulative observation time of 3 h per tumor subregion. Data in f, h, i represent 228 contacts from N = 4 independent mice. Data in h, mean ± SD (3 positions per subregion from N = 3 independent mice). p-Value, two-tailed Mann–Whitney test. Scale bars e, g, 50 µm. Source data are provided as a Source Data file.

References

    1. Golstein P, Griffiths GM. An early history of T cell-mediated cytotoxicity. Nat. Rev. Immunol. 2018;18:527–535. doi: 10.1038/s41577-018-0009-3. - DOI - PubMed
    1. Zhang N, Bevan MJ. CD8(+) T cells: foot soldiers of the immune system. Immunity. 2011;35:161–168. doi: 10.1016/j.immuni.2011.07.010. - DOI - PMC - PubMed
    1. Choi PJ, Mitchison TJ. Imaging burst kinetics and spatial coordination during serial killing by single natural killer cells. Proc. Natl Acad. Sci. USA. 2013;110:6488–6493. doi: 10.1073/pnas.1221312110. - DOI - PMC - PubMed
    1. Bhat R, Watzl C. Serial killing of tumor cells by human natural killer cells - Enhancement by therapeutic antibodies. PLoS ONE. 2007;2:e326. doi: 10.1371/journal.pone.0000326. - DOI - PMC - PubMed
    1. Hoffmann P, et al. Serial killing of tumor cells by cytotoxic T cells redirected with a CD19-/CD3-bispecific single-chain antibody construct. Int. J. Cancer. 2005;115:98–104. doi: 10.1002/ijc.20908. - DOI - PubMed

Publication types