. 2021 Sep 1;12(1):5218.
doi: 10.1038/s41467-021-25475-w.

Structure of the human marker of self 5-transmembrane receptor CD47

Affiliations

Structure of the human marker of self 5-transmembrane receptor CD47

Gustavo Fenalti et al. Nat Commun. .

Abstract

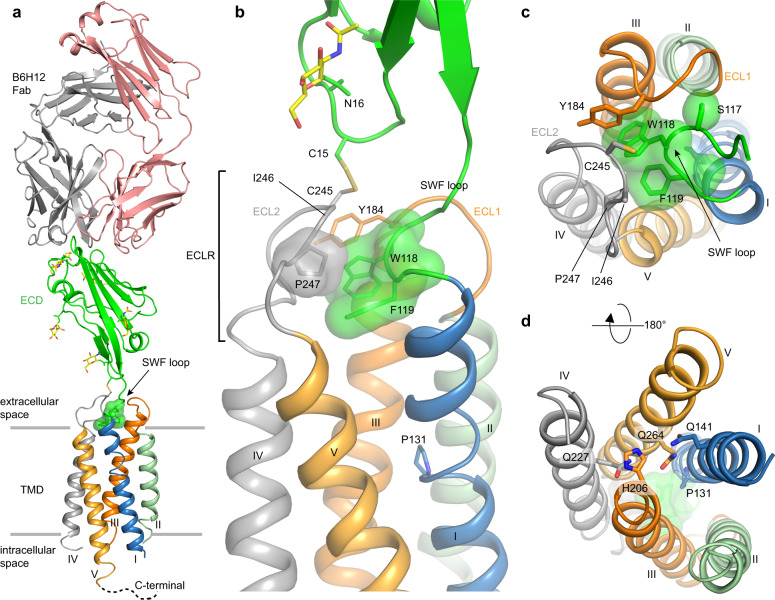
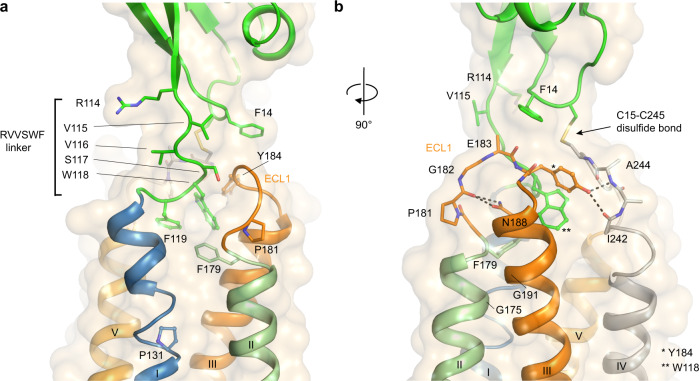
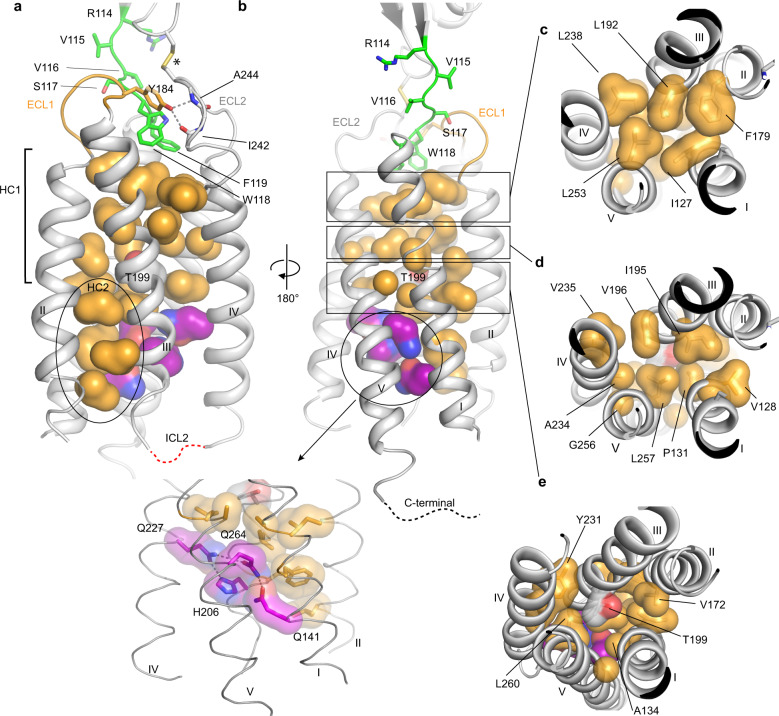
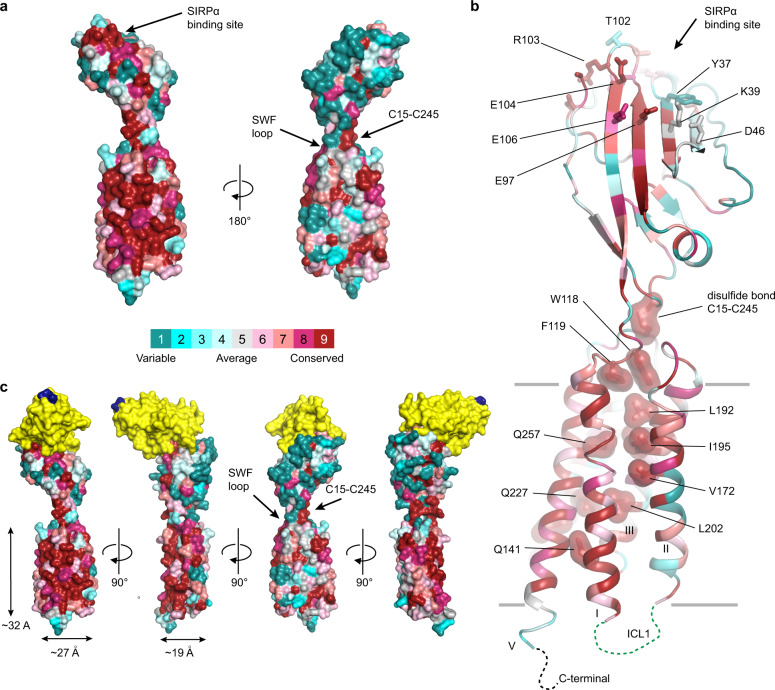
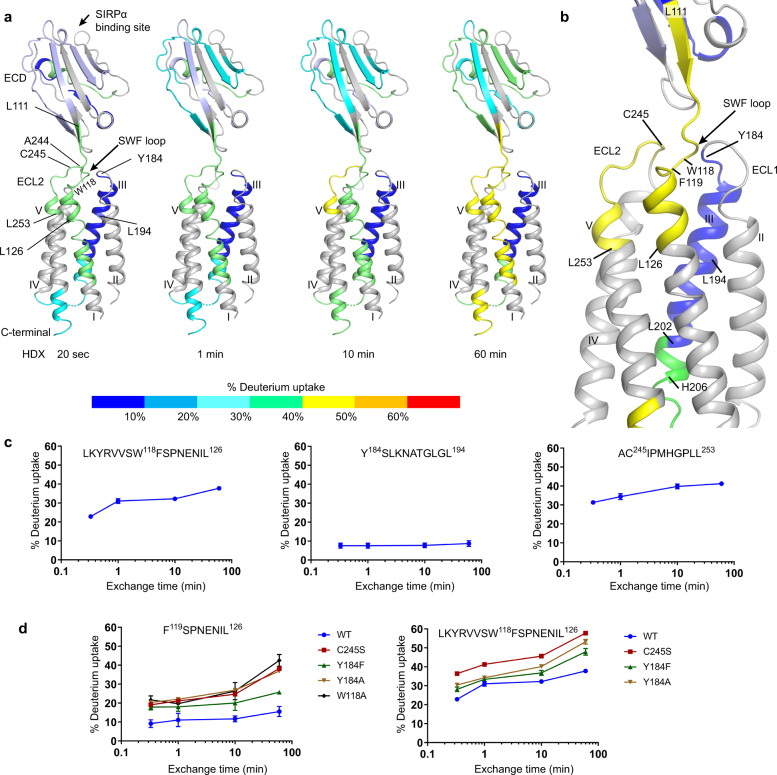
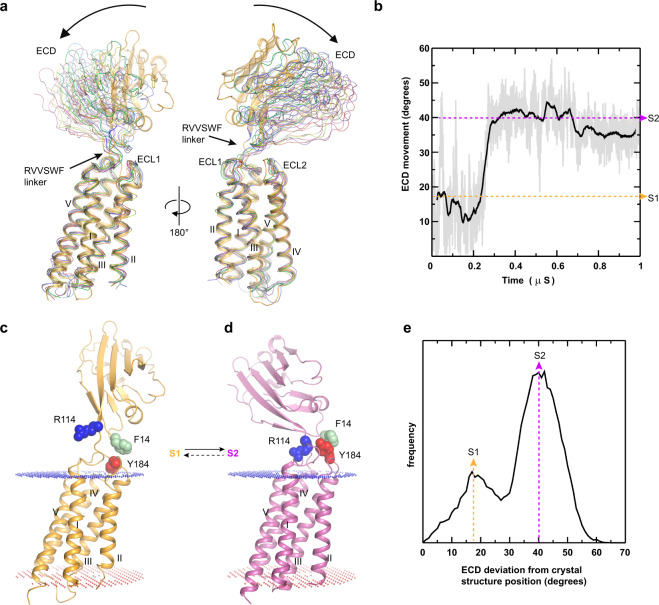
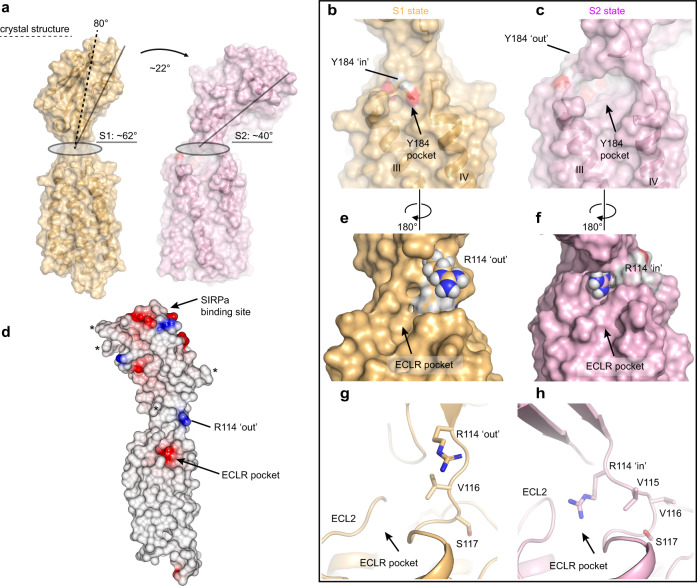
CD47 is the only 5-transmembrane (5-TM) spanning receptor of the immune system. Its extracellular domain (ECD) is a cell surface marker of self that binds SIRPα and inhibits macrophage phagocytosis, and cancer immuno-therapy approaches in clinical trials are focused on blocking CD47/SIRPα interaction. We present the crystal structure of full length CD47 bound to the function-blocking antibody B6H12. CD47 ECD is tethered to the TM domain via a six-residue peptide linker (114RVVSWF119) that forms an extended loop (SWF loop), with the fundamental role of inserting the side chains of W118 and F119 into the core of CD47 extracellular loop region (ECLR). Using hydrogen-deuterium exchange and molecular dynamics simulations we show that CD47's ECLR architecture, comprised of two extracellular loops and the SWF loop, creates a molecular environment stabilizing the ECD for presentation on the cell surface. These findings provide insights into CD47 immune recognition, signaling and therapeutic intervention.


Conflict of interest statement

The authors declare no competing interests.

Figures

Fig. 1
Fig. 1. Overall structure of CD47BRIL-B6H12 complex, ECLR, and TMD.
a CD47BRIL-B6H12 complex structure showing the Fab (light and heavy chains shown as pink and gray cartoon respectively), the ECD (green cartoon), and the TMD helices (helix I, blue; helix II, light green; helix III, orange; helix IV, gray and helix V light orange). The CD47 ECLR is formed by the ECL1 (orange tube), ECL2 (gray tube), and the 117SWF119 loop (green surface shown for W118 and F119). The N-linked glycans are shown as sticks with yellow carbons. The gray lines represent the approximate extracellular and intracellular membrane boundaries. b Close up view of the receptor ECLR showing all the three ECLR loops and important residues (side chains shown as sticks and transparent surfaces). The location of the helical kink in helix I centered on P131 (side chain shown as sticks) is also shown. c Top view of CD47 TMD bundle from the extracellular side showing the position of helices and orientation of the three extracellular loops with respect to the helices. d View of the TM bundle from the intracellular side. The side chain of residues in the IC hydrogen bond network are shown as sticks and labeled.
Fig. 2
Fig. 2. Interactions within the ECLR and 114RVVSWF119 linker.
a View of the 114RVVSWF119 six-residue peptide linker in the CD47BRIL-B6H12 crystal structure (green cartoon and sticks), and the insertion site of the 117SWF119 loop in the ECLR core. The ECD is shown as green cartoon and the TMD helices are colored blue (helix I), light green (helix II), orange (helix III) and light orange (helix V). The ECL1 is shown as orange cartoon and sticks. b A 90 degree rotation of CD47BRIL-B6H12 structure view shown in (a) highlighting the ECL1 hydrogen bonds (black dotted lines) between Y184 side chain and ECL2 (main-chain atoms shown as gray sticks and labeled), and between N188 side chain and ECL1 (orange sticks).
Fig. 3
Fig. 3. Physicochemical characteristics of CD47 TMD core.
ab Two views of the TMD of CD47BRIL-B6H12 crystal structure (gray cartoon, helices numbered I-V, ECD and Fab atoms omitted) showing residues in the core of the TMD helix bundle and in the ECLR. The surface of TMD hydrophobic residues pointing towards the core of the receptor are shown in light orange. The side chains of residues in the 114RVVSWF119 linker are shown as green sticks. Hydrogen bonds are represented by gray dotted lines. The asterisk indicates the position of the inter-domain disulfide bond between C15 and C245. Black ellipses delineate the IC region containing the cluster of hydrophobic residues between helices I, II, and III (HC2, shown in (a)), and residues involved in the IC hydrogen bond network (shown as purple transparent surfaces and sticks in (b)). ECL1 and ECL2 are colored orange and gray respectively and are labeled. Disordered ICL2 and C-terminal residues are represented by red and black dotted lines respectively. ce Top views from the CD47 EC side showing the packing of hydrophobic residues in the receptor core and the different layers (delineated by the rectangles in (b)), from the outer membrane leaflet to the center of lipid bilayer.
Fig. 4
Fig. 4. Amino acid evolutionary conservation of CD47 and the SIRPα binding site.
a Two views of the CD47BRIL-B6H12 crystal structure (Fab atoms omitted) with the mammalian CD47 amino acid conservation (Supplementary Fig. 4; source data provided as a Source Data file) mapped on the surface representation of the receptor. The color scheme for the conservation scores is shown as a colored bar. b Cartoon representation of the CD47BRIL-B6H12 crystal structure (Fab atoms omitted) colored according to the conservation scale bar presented in (a). The side chains of highly conserved residues with a score of 9 in the conservation scale, located in the core of the TMD, in the ECLR or IC hydrogen bond network are shown as dark red surfaces. The side chains of C15 and C245, are also shown as dark red surface. CD47 residues that form the SIRPα binding site are shown as sticks; some non-conserved residues in the vicinity of the epitope are also shown. Gray lines represent the approximate lipid membrane boundaries. Disordered ICL1 and C-terminal residues are represented by green and black dotted lines respectively. Amino acid evolutionary conservation data are provided in Supplementary Fig. 4. Source data are provided as a Source Data file. c Superposition of the full-length CD47BRIL-B6H12 crystal structure (Fab atoms omitted) with the crystal structure of the soluble CD47 ECD in complex with SIRPα, PDB ID 2JJT [10.2210/pdb2JJT/pdb]. The ECD of both CD47 structures were used for the structural alignment. The full-length CD47 is shown as a surface representation and colored as in (a); the SIRPα is shown as yellow surface. The last C-terminal residue of SIRPα domain 1 is colored blue for reference.
Fig. 5
Fig. 5. Kinetic HDX-MS data of WT CD47BRIL and mutants.
a The HDX levels of WT CD47BRIL and mutants are color coded and mapped onto the crystal structure of full-length CD47BRIL-B6H12 complex (Fab B6H12 atoms omitted). Regions that were not identified in the HDX-MS experiments are colored gray. b Close view of the ECLR showing deuterium uptake at 60 min. c Deuterium uptake plots of peptides corresponding to the inter-domain 114RVSSWF119 linker region, ECL1 and helix III, ECL2 and the EC portion of helix V. d Deuterium uptake plots of WT CD47BRIL and mutants for peptides covering the 114RVSSWF119 linker region. Each data-point is presented as mean values across two replicates. Error bars represent mean values ± SD of duplicate measurements. At least two independent experiments were performed with a panel a receptor constructs. The kinetic differential HDX data are provided in Supplementary Data 5.
Fig. 6
Fig. 6. CD47 macrostates.
a Representative models of CD47 during the course of the molecular dynamics simulations taken at 0.1 μs intervals (10 models shown) showing the range of motion of CD47 ECD. The CD47 crystal structure (starting model for the simulation) is shown as a yellow cartoon and the molecular dynamics models (0.1–1 μs) are shown as thin tubes. b Plot showing the measured tilt (degrees) between ECD and TMD during the molecular dynamics simulations showing the transition from the s1 to s2 macrostates. The yellow (s1) and light pink (s2) dotted lines indicate the average ECD orientations in each macrostate. The gray line indicates the nanosecond fluctuations and the black line the time average over every 1 ns within the single simulation trace. cd Cartoon representations of full-length CD47 models from the simulations with ECD conformations corresponding to the average macrostates s1 (yellow) and s2 (light pink). The side chains of R114, Y184, and F14 are shown as blue, red, and light green spheres respectively. e Plot showing the frequency distribution of the ECD positioning with respect to the TMD (measured as the angle deviation, in degrees, from the crystal structure, which is the starting molecular dynamics model, time = 0 μs). The yellow (s1) and pink (s2) dotted lines indicate the average ECD orientations in each macrostate.
Fig. 7
Fig. 7. Snapshots of full-length CD47 in s1 and s2 macrostates.
a Surface representation of full-length CD47 models with ECD orientations corresponding to the average s1 (yellow) and s2 (light pink) macrostates with respect to the TMD. Differences in ECD tilt angle between s1 and s2 are indicated by black solid lines and labeled. A dotted black line indicates the ECD angle with respect to the TMD observed in the CD47BRIL-B6H12 crystal structure. bc Side-by-side comparison of the Y184 large pocket between ECL1 and ECL2 showing the position of Y184 side chain in the average s1 macrostate (Y184 ‘in’ position) and in the average s2 macrostate (Y184 ‘out’ position). d Surface electrostatic potential representation of CD47BRIL-B6H12 crystal structure (B6H12 atoms omitted) indicating the negatively charged ECLR pocket between helix I and V, the position of R114, and the SIRPα binding site on the ECD. Asterisks indicate the position of the N-linked glycosylation sites. ef Side-by-side comparison of R114 side chain in the average s1 macrostate (R114 ‘out’ position) and in the average s2 macrostate (R114 ‘in’ position) and movement of the R114 into the negatively charged ECLR pocket. gh A cartoon representation of (e) and (h) showing the conformational rearrangement of the 114RVVSWF119 linker during molecular dynamics simulations. The side chain of residues are shown as sticks.

References

    1. Oldenborg PA, et al. Role of CD47 as a marker of self on red blood cells. Science. 2000;288:2051–2054. doi: 10.1126/science.288.5473.2051. - DOI - PubMed
    1. Brown E, Hooper L, Ho T, Gresham H. Integrin-associated protein: a 50-kD plasma membrane antigen physically and functionally associated with integrins. J. Cell Biol. 1990;111:2785–2794. doi: 10.1083/jcb.111.6.2785. - DOI - PMC - PubMed
    1. Reinhold MI, et al. In vivo expression of alternatively spliced forms of integrin-associated protein (CD47) J. Cell Sci. 1995;108:3419–3425. doi: 10.1242/jcs.108.11.3419. - DOI - PubMed
    1. Mordue KE, Hawley BR, Satchwell TJ, Toye AM. CD47 surface stability is sensitive to actin disruption prior to inclusion within the band 3 macrocomplex. Sci. Rep. 2017;7:2246. doi: 10.1038/s41598-017-02356-1. - DOI - PMC - PubMed
    1. Seiffert M, et al. Human signal-regulatory protein is expressed on normal, but not on subsets of leukemic myeloid cells and mediates cellular adhesion involving its counterreceptor CD47. Blood. 1999;94:3633–3643. doi: 10.1182/blood.V94.11.3633. - DOI - PubMed