. 2021 Sep 1;12(1):5205.
doi: 10.1038/s41467-021-25544-0.

Aging, inflammation and DNA damage in the somatic testicular niche with idiopathic germ cell aplasia

Affiliations

Aging, inflammation and DNA damage in the somatic testicular niche with idiopathic germ cell aplasia

Massimo Alfano et al. Nat Commun. .

Abstract

Molecular mechanisms associated with human germ cell aplasia in infertile men remain undefined. Here we perform single-cell transcriptome profiling to highlight differentially expressed genes and pathways in each somatic cell type in testes of men with idiopathic germ cell aplasia. We identify immaturity of Leydig cells, chronic tissue inflammation, fibrosis, and senescence phenotype of the somatic cells, as well markers of chronic inflammation in the blood. We find that deregulated expression of parentally imprinted genes in myoid and immature Leydig cells, with relevant changes in the ratio of Lamin A/C transcripts and an active DNA damage response in Leydig and peritubular myoid cells are also indicative of senescence of the testicular niche. This study offers molecular insights into the pathogenesis of idiopathic germ cell aplasia.


Conflict of interest statement

The authors declare no competing interests.

Figures
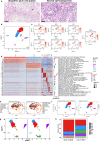
Fig. 1
Fig. 1. Clustering of somatic cells from iGCA through the analysis of marker genes expression.
a Histological analysis of testis parenchyma with complete iGCA (left panel; one donor representative of five tested with the similar result) and normal spermatogenesis (right panel; one donor representative of five tested with the similar result): the arrow indicates SRT cells characterized by a dense nucleolus; the asterisk indicates the spermatocytes. b UMAP plot representing testis cells from tissue samples of three independent iNOA men with complete iGCA (replicates in Supplementary information, Fig. S1). c UMAP plots showing the expression patterns of selected marker genes used to identify the different cell types (Supplementary information, Dataset S1, 2). d Left: Heatmap showing the expression signature of the top ten expressed genes in each cell type. Right: representative pathways for each cell type derived from the Reactome Pathway Database and GO Biological Process (Supplementary information, Dataset S3–10). e Comparison of the unsupervised clustering of cells from the testis of OA man (Supplementary information, Dataset S1) and cell identity prediction by Data Transfer on a reference (see M&M), provided by the three samples from Guo et al.. f Comparison of the unsupervised clustering of cells from the testis with iGCA (Supplementary information, Dataset S1) and cell identity prediction by Data Transfer on a reference, provided by the three samples from Guo et al.. g UMAP plots resulting from the integration of cells from the testis with iGCA and selected somatic cells from 5 testes with normal spermatogenesis from Guo et al. and Sohni et al. (Supplementary information, Fig. S3, Dataset S12). h Relative abundance of all somatic cell populations based on gene markers from three testes with iGCA and five control testes with normal spermatogenesis (CTL). Source data are provided as a Source Data file.
Fig. 2
Fig. 2. Upregulated pathways in myoid, leydig, stroma cells, and macrophages associated with iGCA, together with the presence of T cells in the testis with iGCA and cell–cell interactions.
Heatmap of differentially expressed genes that contributed to the upregulated pathways in a MYD cells, b LEY cells, c STRO cells, d SRT cells, and e MCR of iNOA men with GCA vs. control tests with normal spermatogenesis (CTL), as described by the Reactome Pathway Database and GO Biological Process (Supplementary information, Fig. S4, Dataset S13–15); the color scale of the heatmap represents expression values, and the heatmap shows the intensity of gene expression per each cell. Dot plots summarize the most relevant pathways, and the dot size is proportional to the percentage of genes expressed in each pathway. f The blend plot visualizes the co-expression of the CD8 and CD69 antigen transcripts in the T cell (TCL) population (left). g The projection map and the relative distribution of iGCA TCL identities defined on the classification of Szabo et al.. h Blend plots visualizing the expression of functional markers as GZMM, GZMK (left), CCL4, and CCL5 (right) in the TCL of iNOA men with GCA (Supplementary Dataset S12). i Heatmap showing the total number of interactions between cell types in the decidua dataset obtained with CellPhoneDB for IGCA samples (right) and healthy donor (right). j DotPlot of selected ligand–receptor interactions produced using CellPhoneDB. P values are represented by increasing circle size. The means of the average expression level of interacting molecule 1 in cluster 1 and interacting molecule 2 in cluster 2 are indicated by color. k Violin plot for CD74 in iGCA MCR vs. control adult testis. Source data are provided as a Source Data file.
Fig. 3
Fig. 3. Downregulated pathways shared by all the somatic cells of men with iGCA.
a Dot plot comparison of shared downregulated genes and pathways in the seven somatic cell populations in iGCA. Only genes downregulated in at least two cell types are considered. Pathways are derived from the Reactome Pathway Database and GO Biological Process and only those common in all cell types are displayed (Supplementary information, Fig. S5, Dataset S21–27). The Venn diagram shows the intersection of the 56 down-modulated pathways in the six somatic cell populations of iNOA men with germ cell aplasia (Supplementary information, Fig. S5, Dataset S28). b Dot plot comparison of gene expression for enzymes involved in Selenium metabolism and Redoxin proteins (Supplementary information, Dataset S29). c Dot plot comparison of gene expression for proteins involved in the pathway “Mitochondrial respiratory chain complex” and “Hypoxia-inducible factor”. Source data are provided as a Source Data file.
Fig. 4
Fig. 4. Immature phenotype of Leydig cells in germ cell aplasia.
Violin plots for DLK1 and NOTCH2 (a), and IGF1 and IGF2 (b) expression in iGCA vs. the somatic cells of control adult testis. c Violin plot for INSL3 transcription in iGCA vs. control adult testis, and INSL3 protein staining in testis parenchyma (one CTL testis and one iGCA testis representative of four tested each condition, with similar result). Leydig cells are recognized by their localization amongst tubules and the dense chromatin ring at the nuclear periphery, while Sertoli cells are recognized for the presence of a characteristic DAPI negative condensed nucleolus. Mi meiotic cells, S Sertoli cells, My peritubular myoid cells, L Leydig cells. d Feature plots of HSD17B3 transcripts in iGCA and control testis (Guo and Sohni datasets); DGE in Supplementary information, Dataset S30. e Violin plots compare expression levels of Stage A–C signatures of LEY cell maturation in iGCA vs. healthy donor (two-sided Mann Whitney test). Signatures were established by combining three datasets reporting single-cell RNA seq of neonatal, prepubertal, and adult human testis analysis detailed in Supplementary Fig. S9). f DLK1 and INSL3 expression in iGCA vs. neonatal, prepubertal, and adult control testis. g Violin plots compare the expression of imprinted genes in the somatic cell clusters in iGCA and controls (two-sided Mann Whitney test). h One representative imprinted gene (IGF2) with biallelic expression in the three tested iGCA testis. Reads distribution from the iGCA#2 scRNA-seq are reported for a portion of the IGF2 gene locus (NM_000612.6, exon 4). Gray bars indicate a perfect match of the sequence reads at the nucleotide level with the human GRCh38/hg38 reference sequence, bar height indicates the coverage. The “red and orange” bars indicate the positions where 27–28% of reads diverge from the reference sequence (pos. 2,133,027 and 12,133,043), thus suggesting a biallelic expression. Adj P adjusted p value, two-sided Mann Whitney test followed by Bonferroni correction for multiple comparisons. LogFC log2 fold change. Source data are provided as a Source Data file.
Fig. 5
Fig. 5. Overexpression of collagen I and down-modulation of collagen IV in the basement membrane of seminiferous tubules with iGCA.
a Violin plots compare the expression levels of collagen genes in LEY, MYD, and STRO cells. Blend graphs show the degree of expression and co-expression in the somatic populations from iGCA (upper panels) and CTLs (lower panels). AdjP adjusted P value; LogFC logarithmic fold change iNOA vs. CTL. n.s. not significant. b Deposition of type I collagen and c type IV collagen in the basal membrane of seminiferous tubules and vessels in the case of normal spermatogenesis, iGCAor hypospermatogenesis (one testis for each condition representative of five tested for each condition, with similar result); * = seminiferous tubules with spermatogenesis; ** = seminiferous tubules iGCA; arrow = vessels. d Thickness values of the thickness of the hyalinized area surrounding the seminiferous tubule were quantified (ImageJ software version 1.5 applied on high magnification images). A single dot represents the average value of twenty seminiferous tubules from each clinical specimen. Ten independent testes with germ cell aplasia (red dots) and ten from iNOA and positive sperm retrieval patients (black dots) were analyzed; the dotted line shows the average value for five independent normozoospermic samples, each with 20 seminiferous tubules counted; error bars represent mean ± SEM. Statistical significance was evaluated by means of two-tail Mann–Whitney. e Sperm retrieval was expressed as the number of sperm/high power field (HPF) from testis specimen with hypospermatogenesis; the association between sperm retrieval and the thickness of the collagen area is reported. f Images produced by collagen birefringence in the basal membrane of the seminiferous tubules with normal spermatogenesis and iGCA (one testis for each condition representative of five tested for each condition, with the similar result). g Quantification of the degree of collagen fibrils organization (anisotropy) in the basal membrane of 100 tubules with normal spermatogenesis (n = 20 tubules each donor, n = 5 independent donors) and with iGCA (n = 20 tubules each donor, n = 5 independent donors); red bars represent mean ± SEM; two-sided Mann Whitney test. Scale bar; 50 µM. Adj P Bonferroni adjusted p value for multiple comparisons, LogFC log2 fold change, iNOA idiopathic non-obstructive azoospermia. Source data are provided as a Source Data file.
Fig. 6
Fig. 6. Inflammation and aging markers at the local and systemic level.
a Localization of HMGB1 (brown stain) in 1 out of 3 representative testes with normal spermatogenesis and in 2 out of 7 representative testes with iGCA; blue letters indicate cluster of Leydig cells (L), Sertoli (S), and peritubular Myoid (My) cells. b Distribution of γH2AX (red signal) in one representative sample of three testes with normal spermatogenesis and one representative of three testes with iGCA; low magnification of the seminiferous tubules are followed by higher magnification to appreciate γH2AX dots localization in Meiotic cells (Me), but not sperm cells (Sp) or somatic cells in the control testis, and in SRT, MYD, and LEY cells from iGCA patient. c Comparisons of circularity and roundness values as proxies for nuclear envelope deformation in LEY and SRT cells; LEY cells were identified by immunofluorescence staining of lineage-specific marker CALB2 (Supplementary Figs. S7 and S11) and the latter by intratubular localization (n = 4 independent donors both for CTL and iGCA, for a total of 98 SRT and 67 LEY cells in CTL and 214 SRT and 76 LEY cells in iGCA). Red bars represent mean ± SEM; two-sided Mann Whitney test. d Distributions of the most represented Lamin A/C RNA isoforms detected in the sc-RNAseq datasets. Specific transcript fractions are reported as percentages over total LMNA/C transcripts (tpm) in normal (Guo plus Sohni datasets, total controls = 5) and iGCA samples (iGCA#1–3). The polymorphism in the LMNA exon ten donor splice site is reported for each iGCA subject. e Peripheral levels of estradiol and f testosterone in men with iGCA and normozoospermic men with proven fertility (n = 41 independent donors). Red bars represent mean ± SEM; two-sided Mann Whitney test. g LH/Tt ratio in fertile men (n = 102 independent donors) clustered according to sperm parameters into normozoospermia = 43; teratozoospermia = 38; asteno-teratozoospermia = 13, oligo-teratozoospermia = 3, oligo-asteno-teratozoospermia = 5 and in iNOA men with germ cell aplasia (GCA; n = 43 independent donors). Red bars represent mean ± SEM. tT total testosterone, OAT oligo-asteno-teratozoospermia. Two-sided Krustal–Wallis test corrected for the false discovery rate (procedure of Benjamini, Krieger, and Yekutieli). h, i Comparison of the distribution of CCL4 and CCL5 chemokines blood concentration (n = 10 independent donors for both iGCA and normozoospermia); red bars represent mean ± SEM. j Comparison of expression levels for ribosomal protein genes among the somatic clusters in testis with iGCA and healthy controls. iNOA idiopathic non-obstructive azoospermia. Source data are provided as a Source Data file.

Comment in

  • Understanding iGCA.
    Stone L. Stone L. Nat Rev Urol. 2021 Nov;18(11):638. doi: 10.1038/s41585-021-00531-8. Nat Rev Urol. 2021. PMID: 34625738 No abstract available.

References

    1. Oatley JM, Brinster RL. Regulation of spermatogonial stem cell self-renewal in mammals. Annu. Rev. Cell Dev. Biol. 2008;24:263–286. doi: 10.1146/annurev.cellbio.24.110707.175355. - DOI - PMC - PubMed
    1. Nakamura S, et al. Next-generation sequencing for patients with non-obstructive azoospermia: implications for significant roles of monogenic/oligogenic mutations. Andrology. 2017;5:824–831. doi: 10.1111/andr.12378. - DOI - PubMed
    1. http://uroweb.org/guideline/male-infertility/.
    1. Ogawa T, Dobrinski I, Avarbock MR, Brinster RL. Transplantation of male germ line stem cells restores fertility in infertile mice. Nat. Med. 2000;6:29–34. doi: 10.1038/71496. - DOI - PMC - PubMed
    1. Ryu BY, Orwig KE, Oatley JM, Avarbock MR, Brinster RL. Effects of aging and niche microenvironment on spermatogonial stem cell self-renewal. Stem Cells. 2006;24:1505–1511. doi: 10.1634/stemcells.2005-0580. - DOI - PMC - PubMed

Publication types