. 2021 Sep 1;11(1):17490.
doi: 10.1038/s41598-021-96678-w.

Non-respiratory particles emitted by guinea pigs in airborne disease transmission experiments

Affiliations

Non-respiratory particles emitted by guinea pigs in airborne disease transmission experiments

Sima Asadi et al. Sci Rep. .

Abstract

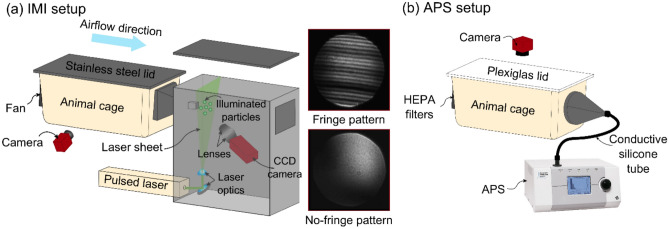
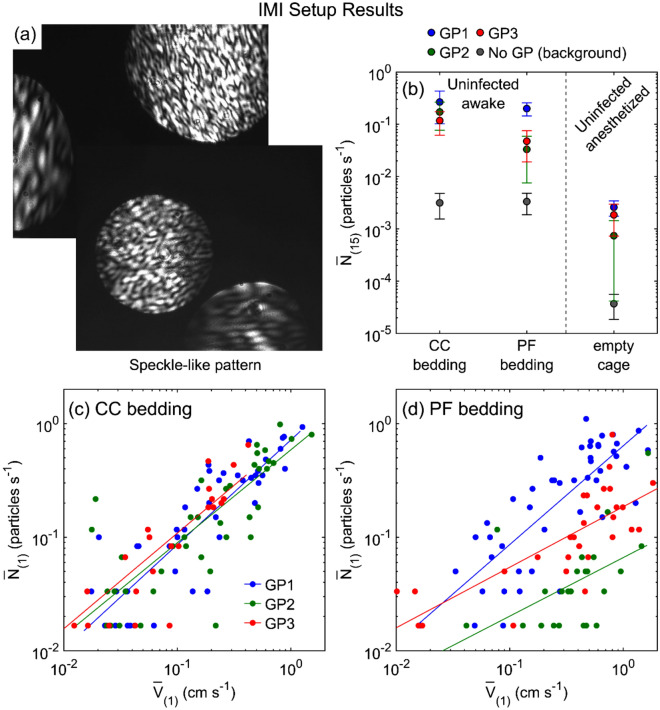
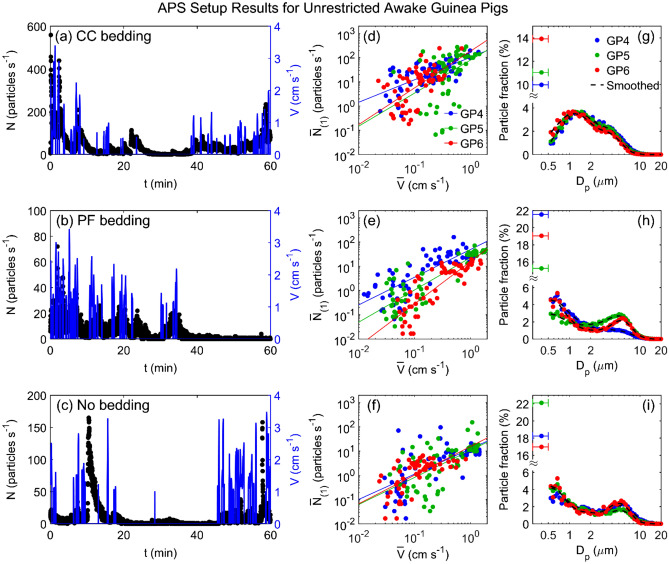
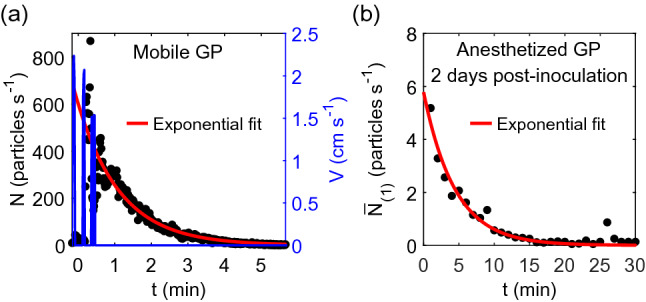
Animal models are often used to assess the airborne transmissibility of various pathogens, which are typically assumed to be carried by expiratory droplets emitted directly from the respiratory tract of the infected animal. We recently established that influenza virus is also transmissible via "aerosolized fomites," micron-scale dust particulates released from virus-contaminated surfaces (Asadi et al. in Nat Commun 11(1):4062, 2020). Here we expand on this observation, by counting and characterizing the particles emitted from guinea pig cages using an Aerodynamic Particle Sizer (APS) and an Interferometric Mie Imaging (IMI) system. Of over 9000 airborne particles emitted from guinea pig cages and directly imaged with IMI, none had an interference pattern indicative of a liquid droplet. Separate measurements of the particle count using the APS indicate that particle concentrations spike upwards immediately following animal motion, then decay exponentially with a time constant commensurate with the air exchange rate in the cage. Taken together, the results presented here raise the possibility that a non-negligible fraction of airborne influenza transmission events between guinea pigs occurs via aerosolized fomites rather than respiratory droplets, though the relative frequencies of these two routes have yet to be definitively determined.


Conflict of interest statement

The authors declare no competing interests.

Figures

Figure 1
Figure 1
Schematic of interferometric Mie imaging (IMI) and aerodynamic particle sizer (APS) setup. (a) IMI setup for counting and qualitatively characterizing particles emitted from a guinea pig cage. Particles emitted from the cage are carried toward the laser sheet by a horizontal airflow. A CCD camera captures out-of-focus images of the illuminated particles; images at right show representative water droplets with diameter of > 2 µm (fringe pattern), and < 2 µm (no-fringe pattern). A second camera captures the time-lapse images of guinea pig in the cage (side-view). (b) APS setup for measuring the size distribution of particles with diameter of 0.3–20 µm emitted from a guinea pig cage. An APS pulls the air at 5 L/min through the HEPA filters and a camera captures top-view images of the guinea pig in the cage at 1 image per second.
Figure 2
Figure 2
Particle emission rates measured by IMI setup. (a) Images captured by CCD camera that show speckle-like pattern for particles illuminated by the laser sheet. (b) Time-averaged particle emission rate, N¯15 for three guinea pigs (GP1, GP2, and GP3) under different conditions: uninfected, awake guinea pig in the cage with CC bedding or PF bedding, and uninfected, anesthetized guinea pig inside the empty cage. A plastic bag was used to cover anesthetized guinea pig fur with a small opening for its nose facing directly toward the laser sheet. Background particle measurements for each condition where no guinea pig was in the cage are shown with gray circle markers (No GP (background)). Each data point is the average of four 15-min time-averaged particle emission rates and 3 trials for each guinea pig. Time-averaged particle emission rate, N¯1 versus time-averaged guinea pig movement velocity, V¯1 over 1 min, for three uninfected guinea pigs in the cage with (c) CC bedding, and (d) PF bedding. Solid lines are best power law fits (see Table S1 for statistics).
Figure 3
Figure 3
Particle emission rates measured by APS setup for unrestricted awake guinea pigs. Particle emission rate, N (left axis) and guinea pig movement velocity, V (right axis) versus time for a representative guinea pig in the cage with (a) CC bedding, (b) PF bedding, and (c) no bedding. Time-averaged particle emission rate, N¯1 versus time-averaged guinea pig movement velocity, V¯1, for three uninfected awake guinea pigs (GP4, GP5, and GP6) in the cage with (d) CC bedding, (e) PF bedding, and (f) no bedding. Solid lines are power law fits (see Table S2 for statistics). Corresponding size distributions (g, h, and i) for the uninfected awake guinea pigs (GP4, GP5, and GP6) in the cage with (g) CC bedding, (h) PF bedding, and (i) no bedding. The left-most data points in each plot shows the fraction of particles counted in the 0.3–0.5 μm bin, which cannot be further size-discriminated. The whiskers represent the width of the bin (0.3–0.5 μm). Dashed lines represent the data using a 5-point smoothing function. Data indicated by blue markers for GP4 in (d) and (g) are reproduced from Asadi et al. and included here for comparison.
Figure 4
Figure 4
Particle emission from anesthetized or euthanized guinea pigs measured by the APS setup. Particle emission rate, N, versus time under 5 conditions: uninfected anesthetized guinea pig (0 dpi), inoculated anesthetized guinea pig at 1, 2, and 3 dpi, and euthanized guinea pig, for (a) GP4, (b) GP5, and (c) GP6. Magnifications show the final 15 min of each set. (df) Corresponding size distribution for particles emitted during the last 15 min of the measurements shown in (a)–(c). The left-most data points in each plot shows the fraction of particles counted in the 0.3–0.5 μm bin, which cannot be further size-discriminated. The whiskers represent the width of the bin (0.3–0.5 μm). Dashed lines represent the data using a 5-point smoothing function. Data indicated by red and black markers in (d) for GP4 at 2 dpi and euthanized, respectively, are reproduced from Asadi et al. and included here for comparison.
Figure 5
Figure 5
Representative particle emission rate dynamics (a) after a guinea pig stops moving in a cage with CC bedding, and (b) after placing the aluminum sleeve containing an anesthetized guinea pig inside the measurement cage. In (a), the blue lines are the animal velocity. In both (a) and (b), the red lines are best fits to an exponential decay of the form N=N0e-kt with k = 0.85 min−1 for (a) and 0.22 min−1 for (b).

References

    1. Weber TP, Stilianakis NI. Inactivation of influenza A viruses in the environment and modes of transmission: A critical review. J. Infect. 2008;57(5):361–373. doi: 10.1016/j.jinf.2008.08.013. - DOI - PMC - PubMed
    1. Tellier R. Aerosol transmission of influenza A virus: A review of new studies. J. R. Soc. Interface. 2009;6:S783–S790. doi: 10.1098/rsif.2009.0302.focus. - DOI - PMC - PubMed
    1. Tang JW. Investigating the airborne transmission pathway—Different approaches with the same objectives. Indoor Air. 2015;25(2):119–124. doi: 10.1111/ina.12175. - DOI - PMC - PubMed
    1. Luongo JC, Fennelly KP, Keen JA, Zhai ZJ, Jones BW, Miller SL. Role of mechanical ventilation in the airborne transmission of infectious agents in buildings. Indoor Air. 2016;26(5):666–678. doi: 10.1111/ina.12267. - DOI - PMC - PubMed
    1. Lowen AC, Mubareka S, Steel J, Palese P. Influenza virus transmission is dependent on relative humidity and temperature. PLoS Pathog. 2007;3(10):1470–1476. doi: 10.1371/journal.ppat.0030151. - DOI - PMC - PubMed

Publication types

MeSH terms