. 2021 Sep 1;11(1):17472.
doi: 10.1038/s41598-021-96908-1.

Contrasting structural complexity differentiate hunting strategy in an ambush apex predator

Affiliations

Contrasting structural complexity differentiate hunting strategy in an ambush apex predator

Milan Říha et al. Sci Rep. .

Abstract

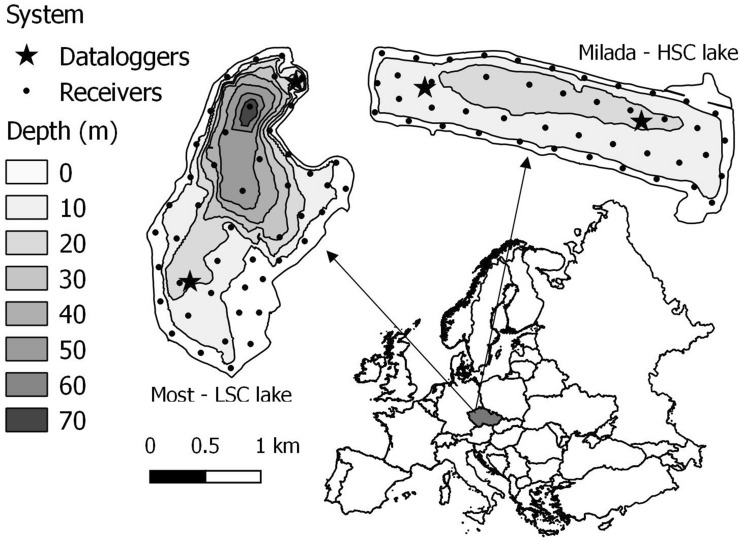
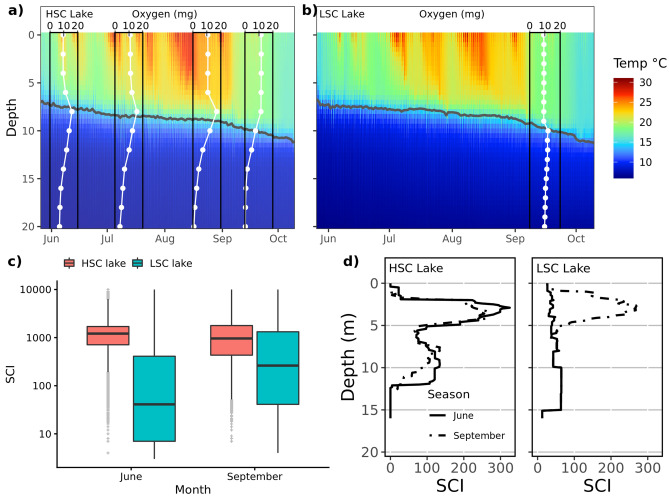
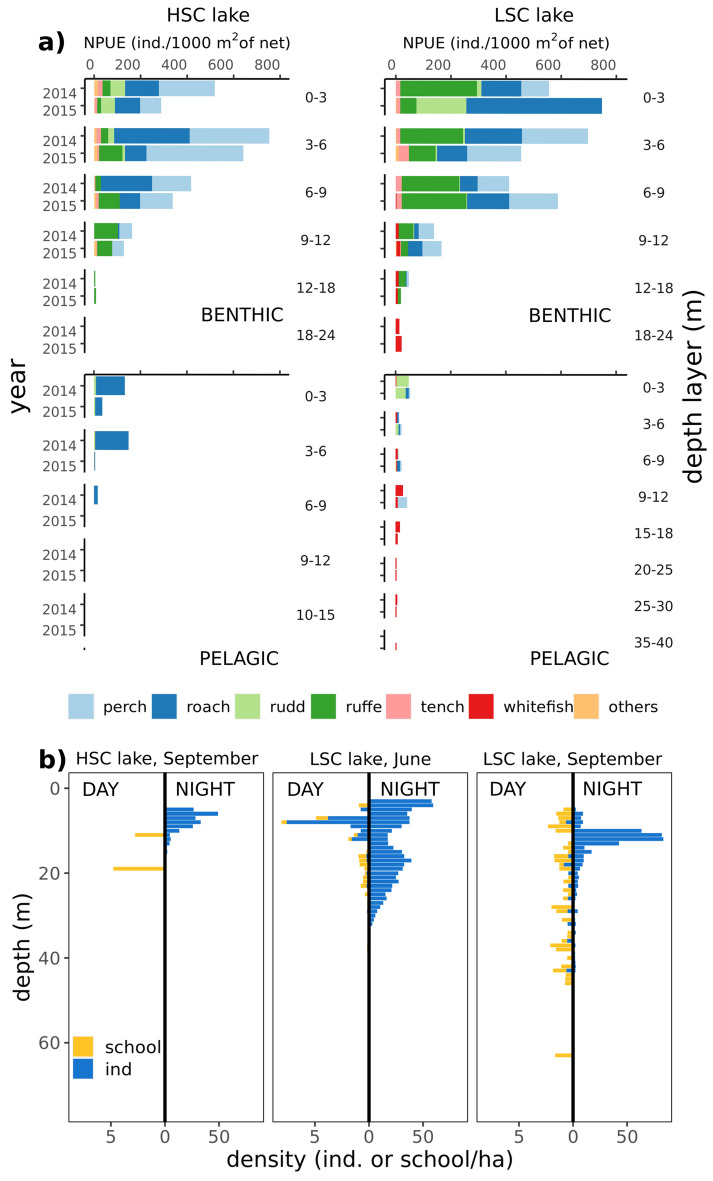
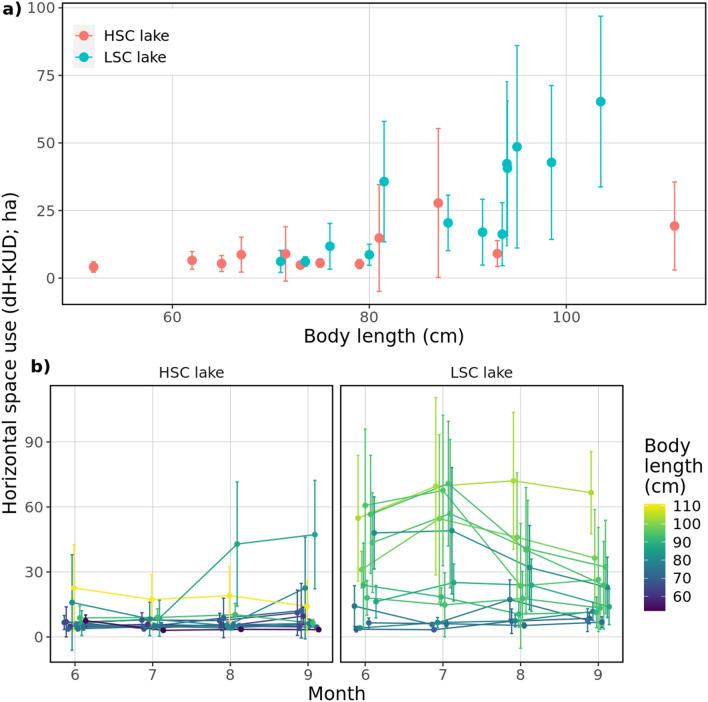
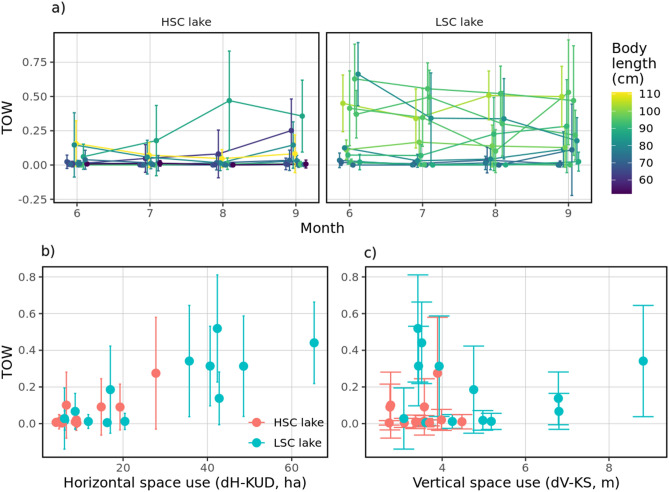
Structural complexity is known to influence prey behaviour, mortality and population structure, but the effects on predators have received less attention. We tested whether contrasting structural complexity in two newly colonised lakes (low structural complexity lake-LSC; high structural complexity-HSC) was associated with contrasting behaviour in an aquatic apex predator, Northern pike (Esox lucius; hereafter pike) present in the lakes. Behaviour of pike was studied with whole-lake acoustic telemetry tracking, supplemented by stable isotope analysis of pike prey utilization and survey fishing data on the prey fish community. Pike displayed increased activity, space use, individual growth as well as behavioural differentiation and spent more time in open waters in the LSC lake. Despite observed differences between lakes, stable isotopes analyses indicated a high dependency on littoral food sources in both lakes. We concluded that pike in the HSC lake displayed a behaviour consistent with a prevalent ambush predation behaviour, whereas the higher activity and larger space use in the LSC lake indicated a transition to more active search behaviour. It could lead to increased prey encounter and cause better growth in the LSC lake. Our study demonstrated how differences in structural complexity mediated prominent changes in the foraging behaviour of an apex predator, which in turn may have effects on the prey community.


Conflict of interest statement

The authors declare no competing interests.

Figures

Figure 1
Figure 1
Locations and bathymetric maps of investigated lakes and positions of telemetry systems. Dots represent positions of each telemetry receiver and stars positions of temperature loggers. The map created using the Open Source QGIS version 3.18 (https://qgis.org/en/site/).
Figure 2
Figure 2
Temperature and oxygen stratification of water column at HSC (a) and LSC lakes (b), (c) distribution of SCI in SCI-rasters covering 0–15 m depth (SCI) in both lakes and (d) vertical distribution of the Structural Complexity Index (SCI) in both lakes. In (c) each point represents SCI value for 1 m2 of bottom. The bar in the middle of the box shows the median, lower and upper hinges of the box correspond to the 25th and 75th percentiles. The lower and upper whisker extends from the hinges to the smallest and largest value, respectively, no further than 1.5 * IQR from the hinge (where IQR is the inter-quartile range, i.e. the distance between the 25th and 75th percentiles). Note the logarithmic scale of the y-axis. In (d) lines show mean SCI on depth profile, given separately for each macrophyte sampling session.
Figure 3
Figure 3
(a) Gillnet abundance of fish stock in both lakes, given separately for each sampled depth layer and separately for bentic and pelagic habitats in one year prior to study (2014) and during study period (2015). (b) vertical distribution of open water hydroacoustic densities separately in both lakes and diel periods.
Figure 4
Figure 4
(a) Dependence of daily extent of horizontal area (dH-KUD) and body length of observed pike, (b) dH-KUD of each individual in each month. Dots represent mean values for the whole observed season/month, error bars denote standard deviation. Colours in (b) were set according to body length of tracked individuals.
Figure 5
Figure 5
Daily extent of vertical space use for each individual in each month. Dots represent mean values for the whole observed month and error bars denote standard deviation. Colours are set according to body length of tracked individuals.
Figure 6
Figure 6
Two-dimensional distribution of all pike positions (dots) in relation to bottom depth for HSC lake (ab) and LSC lake (de) and depth use for each individual in each month (cf). Isoclines depict the highest concentration of positions in the benthic (orange) and open water (light blue) habitats. Mean thermocline depth within each period is indicated by a dashed line.
Figure 7
Figure 7
Development of mean horizontal and vertical activity during tracking period. Pooled (a) and individual (b) horizontal activity; pooled (c) and individual (d) vertical activity in each month of tracking. Dots represent mean values for the whole observed season/month and error bars indicate standard deviations. Colours in (b) and (d) were set according to body length of tracked individuals.
Figure 8
Figure 8
(a) Individual development of TOW during tracking period; relation between mean dH-KUD (b) or dV-KS (c) and mean TOW. Dots represent mean values for the whole observed season/month and error bars indicate standard deviations. Colours in (a) were set according to body length of tracked individuals.
Figure 9
Figure 9
Pike littoral reliance as a function of structural habitat complexity (Lake as a factor) (a), open-water use (based on telemetry data, (b) and total length (c) in HSC and LSC lakes. The individual with the lowest littoral reliance estimate was excluded from the modelling due to its high influence on final results.

References

    1. Kerr JT, Packer L. Habitat heterogeneity as a determinant of mammal species richness in high-energy regions. Nature. 1997;385:252–254. doi: 10.1038/385252a0. - DOI
    1. Kovalenko KE, Thomaz SM, Warfe DM. Habitat complexity: Approaches and future directions. Hydrobiologia. 2012;685:1–17. doi: 10.1007/s10750-011-0974-z. - DOI
    1. Stein A, Gerstner K, Kreft H. Environmental heterogeneity as a universal driver of species richness across taxa, biomes and spatial scales. Ecol. Lett. 2014;17:866–880. doi: 10.1111/ele.12277. - DOI - PubMed
    1. Willis SC, Winemiller KO, Lopez-Fernandez H. Habitat structural complexity and morphological diversity of fish assemblages in a Neotropical floodplain river. Oecologia. 2005;142:284–295. doi: 10.1007/s00442-004-1723-z. - DOI - PubMed
    1. Denno RF, Finke D, Langellotto GA. Direct and indirect effects of vegetation structure and habitat complexity on predator-prey and predator-predator interactions. In: Barbosa P, Castellanos I, editors. Ecology of Predator-Prey Interactions. Oxford University Press; 2005. pp. 211–239.

Publication types