. 2021 Sep 1;11(1):17520.
doi: 10.1038/s41598-021-97094-w.

Neuronal activity in the monkey prefrontal cortex during a duration discrimination task with visual and auditory cues

Affiliations

Neuronal activity in the monkey prefrontal cortex during a duration discrimination task with visual and auditory cues

Atsushi Chiba et al. Sci Rep. .

Abstract

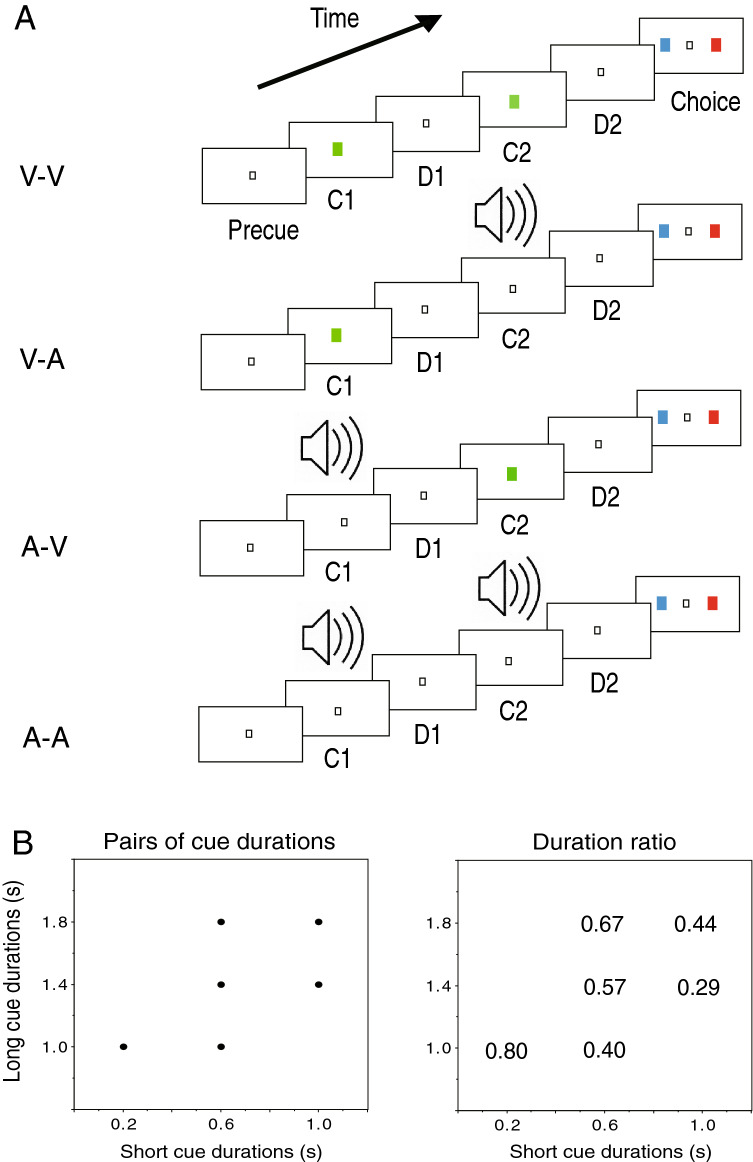
To investigate neuronal processing involved in the integration of auditory and visual signals for time perception, we examined neuronal activity in prefrontal cortex (PFC) of macaque monkeys during a duration discrimination task with auditory and visual cues. In the task, two cues were consecutively presented for different durations between 0.2 and 1.8 s. Each cue was either auditory or visual and was followed by a delay period. After the second delay, subjects indicated whether the first or the second cue was longer. Cue- and delay-responsive neurons were found in PFC. Cue-responsive neurons mostly responded to either the auditory or the visual cue, and to either the first or the second cue. The neurons responsive to the first delay showed activity that changed depending on the first cue duration and were mostly sensitive to cue modality. The neurons responsive to the second delay exhibited activity that represented which cue, the first or second cue, was presented longer. Nearly half of this activity representing order-based duration was sensitive to cue modality. These results suggest that temporal information with visual and auditory signals was separately processed in PFC in the early stage of duration discrimination and integrated for the final decision.


Conflict of interest statement

The authors declare no competing interests.

Figures

Figure 1
Figure 1
Behavioral task and pairs of cue durations. (A) Sequences of the duration discrimination task with auditory and visual cues. C1, first cue; D1, first delay; C2, second cue; D2, second delay. Four modality sequences of C1 and C2 were adopted: V-V, visual-visual; V-A, visual-auditory; A-V, auditory-visual; A-A, auditory-auditory. (B) Pairs of cue durations (left) and cue duration ratios (right) used in the task. Cue duration ratio = (long duration − short duration)/long duration.
Figure 2
Figure 2
Correct rates for M14 (left column) and M15 (right column). (A) Correct response rates with the four cue modality sequences. Bar graphs show correct rates for each type of modality sequence. Line graphs show correct rates to the four modality sequences in the LS (long-short, black circle) and the SL (short-long, white circle) trials separately. Significant differences in correct rates between the LS and the SL trials are shown by asterisks (p < 0.0001). (B) Correct rates as a function of duration ratios. Correct rates are plotted against duration ratios using the same color symbols for each type of modality sequence. (C,D) Correct response rates as a function of duration ratios separately shown for the LS (C) and the SL (D) trials.
Figure 3
Figure 3
Activity of C1-responsive neurons. (A) An auditory C1-responsive neuron. A raster diagram and firing rate curves are aligned with C1 onset. In the raster display, which is separately shown in auditory (A) and visual (V) C1 trials and is rearranged by the C1 duration from long to short, a row corresponds to a trial. In each row, small black dots represent times of neuronal firing. Red and blue horizontal lines indicate auditory and visual cue presentations. For firing rate curves, firing rates were averaged in 200-ms sliding-time windows, moved in 40-ms steps, separately for auditory (red) and visual (blue) C1 trials. (B) A visual C1-responsive neuron. (C) Auditory and visual responses of the C1-responsive neurons. A scatter plot shows the mean firing rates of each auditory C1-responsive neuron (n = 6, red) during the auditory C1 period and those of each visual C1-responsive neuron (n = 43, blue) during the visual C1 period. A significant difference between the auditory and visual responses was detected (p < 0.05) (shown by *). (D) Peak times and half widths of C1 activity. Distributions of peak times from C1 onset (left) and half widths (right) are displayed for the auditory responses (red bars) of auditory C1-responsive neurons and the visual responses (blue bars) of visual C1-responsive neurons. (E) Distribution of the modality sensitivity index (MSI) for the C1-responsive neurons. MSI = (AUD − VIS)/(AUD + VIS). AUD is the mean firing rate during auditory C1 presentation and VIS is the mean firing rate during visual C1 presentation. A neuron was defined as auditory (red bars) when the MSI was greater than 0.3, and as visual (blue bars) when the MSI was less than − 0.3; otherwise, it was defined as bimodal (B, black bars). (F) Distribution of the MSI for the C2-responsive neurons. (G) Distribution of the MSI for the D1-responsive neurons.
Figure 4
Figure 4
Activity of C2-responsive neurons. (A) An auditory C2-responsive neuron. A raster diagram and firing rate curves are aligned with C2 onset. The raster display is separately shown in auditory (A) and visual (V) C2 trials and is rearranged by the C2 duration from long to short. Red and blue squares represent times of red and blue button presses, and yellow squares represent times of reward delivery. Firing rate curves show changes in activity for the auditory (A, red) and visual (V, black) C2 trials. (B) A visual C2-responsive neuron. (C) A bimodal C2-responsive neuron. (D) Distributions of peak times from C2 onset of auditory C2 responses for auditory C2- responsive neurons. (E) Distributions of peak times of visual C2 responses for visual C2-responsive neurons. (F) Distributions of differences in peak time between visual and auditory C2 responses for bimodal C2-responsive neurons. Difference in peak time = (peak time of auditory responses) − (peak time of visual responses). (G) An auditory C2-responsive neuron without any C1 response. Left: A raster diagram and firing rate curves are aligned with C1 onset for C1 responses. The raster display is rearranged by the C1 duration from long to short. Firing rate curves show changes in activity for the auditory (A, red) and visual (V, blue) C1 trials. Right: A raster diagram and firing rate curves are aligned with C2 onset for C2 responses. The raster display is rearranged by the C2 duration from long to short. Firing rate curves show changes in activity for the auditory and visual C2 trials. (H) An auditory C2-responsive neuron with auditory C1 responses. (I) A visual C2-responsive neuron without any C1 response. (J) A visual C2-responsive neuron with visual C1 responses.
Figure 5
Figure 5
Activity of D1-responsive neurons. (A) A D1-responsive neuron exhibiting D1 activity only after auditory C1. A raster diagram and firing rate curves are aligned with D1 onset. The raster display is separately shown in auditory (A) and visual (V) C1 trials and is rearranged by the C1 duration from long to short. Firing rate curves show changes in activity for the auditory (A, red) and visual (V, blue) C1 trials. A bar graph (bottom) shows mean firing rates during the D1 period to each C1 duration in the auditory (red) and visual (blue) C1 trials for this neuron. The activity in the trials with a C1 duration of 1.8-s was greater than that in other types of trials (shown by *). (B) A D1-responsive neuron showing D1 activity only after visual C1. The activity in the trials with a C1 duration of 0.2-s was greater than that in other types of trials (shown by *). (C) A D1-responsive neuron showing D1 activity following auditory and the visual C1. The activity in the trials with auditory C1 durations of 1.4- and 1.8-s was greater than that in other types of trials (shown by *).
Figure 6
Figure 6
Activity of D2-responsive neurons. (A) A D2-responsive neuron showing greater D2 activity in the SL trials than in the LS trials. A raster diagram and firing rate curves are aligned with D2 onset. The raster display is separately shown in the SL and LS trials and is rearranged by the C2 duration from long to short. Firing rate curves show changes in activity for the SL (red) and LS (black) trials. (B) A D2-responsive neuron showing greater D2 activity in the LS trials than in the SL trials. (C) A D2-responsive neuron showing selective D2 activity in the SL trials with auditory C2. The raster display is separately shown in the SL and LS trials and for the C2 modality. Firing rate curves show changes in activity for the SL trials with auditory (red) and visual (green) C2, and in the LS trials with auditory (blue) and visual (black) C2. (D) A D2-responsive neuron showing selective D2 activity in the SL trials with visual C2. (E) A D2-responsive neuron showing selective D2 activity in the LS trials with auditory C2. (F) A D2-responsive neuron showing selective D2 activity in the LS trials with visual C2. (G) Distribution of the MSI to the LS type of D2-responsive neurons. MSI = (VIS − AUD)/(AUD + VIS). AUD is D2 activity after auditory C2, and VIS is the D2 activity following visual C2. (H) Distribution of the MSI to the SL type of D2-responsive neurons.
Figure 7
Figure 7
Recording sites. Cortical surface maps show penetration sites where C1-, D1-, C2-, and D2-responsive neurons were recorded in the right PFC of monkey M14 (top) and in the left PFC of monkey M15 (bottom). In the maps for C1-, D1- and C2-responsive neurons, symbols represent the sites where neurons responding to auditory (red triangles), visual (blue circles), and both auditory and visual (white squares) cues were found. In the maps for D2- responsive neurons, symbols indicate the sites where neurons showing selective D2 activity in the SL (black triangles) and LS (black circles) trials and nonselective D2 activity (white squares) were recorded. AS, arcuate sulcus; PS, principal sulcus.

References

    1. Walker JT, Scott KJ. Auditory-visual conflicts in the perceived duration of lights, tones and gaps. J. Exp. Psychol. Human Percept. Perform. 1981;7:1327–1339. doi: 10.1037//0096-1523.7.6.1327. - DOI - PubMed
    1. Grondin S, Meilleur-Weilleur-Wells G, Ouellette C, Macar F. Sensory effects on judgments of short time-intervals. Psychol. Res. 1998;61:261–268. doi: 10.1007/s004260050030. - DOI - PubMed
    1. Stauffer CC, Haldemann J, Troche SJ, Rammsayer TH. Auditory and visual temporal sensitivity: Evidence for a hierarchical structure of modality-specific and modality-independent levels of temporal information processing. Psychol. Res. 2012;76:20–31. doi: 10.1007/s00426-011-0333-8. - DOI - PubMed
    1. Ulrich R, Nitschke J, Rammsayer T. Crossmodal temporal discrimination: Assessing the prediction of a general pacemaker-counter model. Percept. Psychophys. 2006;68:1140–1152. doi: 10.3758/bf03193716. - DOI - PubMed
    1. Mayer KM, Di Luca M, Ernst MO. Duration perception in crossmodality-defined intervals. Acta Physiol. (Oxf) 2014;147:2–9. doi: 10.1016/j.actpsy.2013.07.009. - DOI - PubMed

Publication types