. 2021 Sep 1;4(1):1025.
doi: 10.1038/s42003-021-02538-8.

ALS-related FUS mutations alter axon growth in motoneurons and affect HuD/ELAVL4 and FMRP activity

Affiliations

ALS-related FUS mutations alter axon growth in motoneurons and affect HuD/ELAVL4 and FMRP activity

Maria Giovanna Garone et al. Commun Biol. .

Abstract

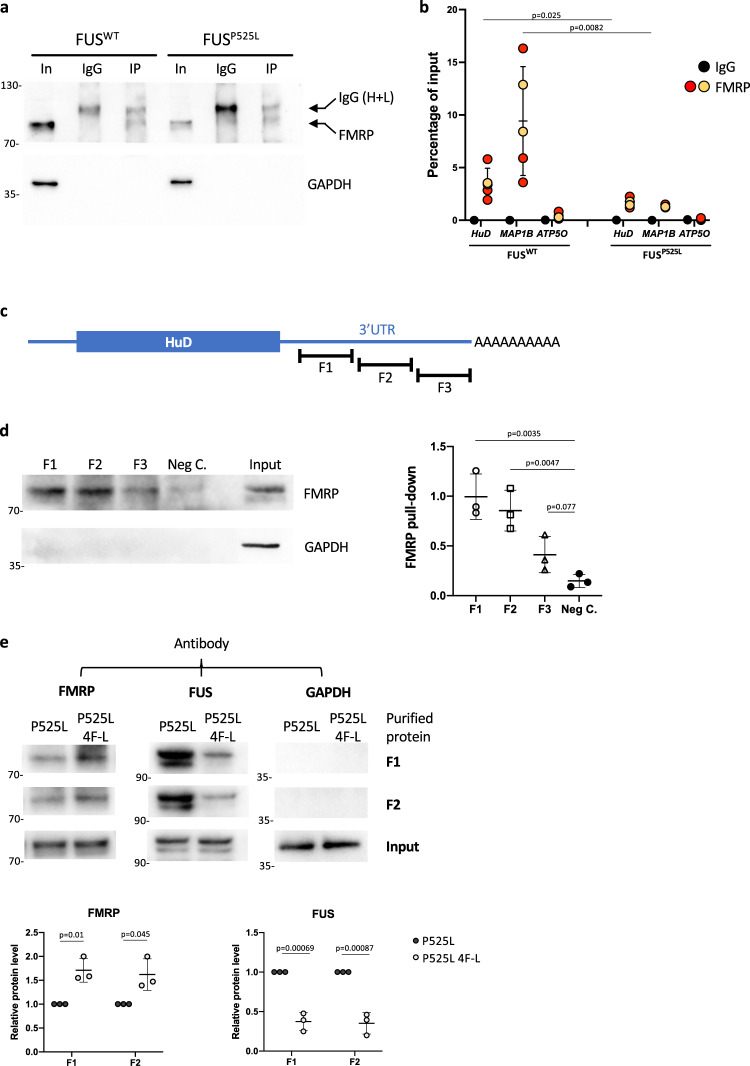
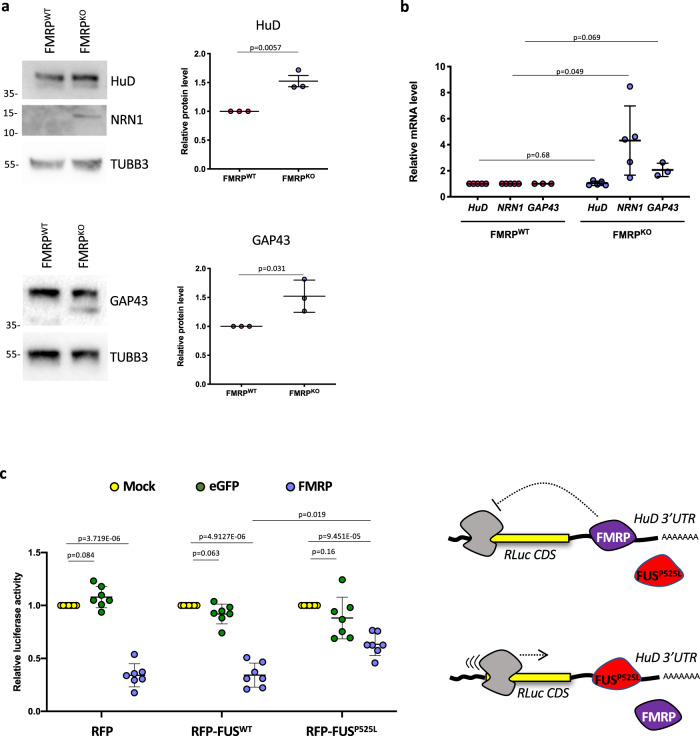
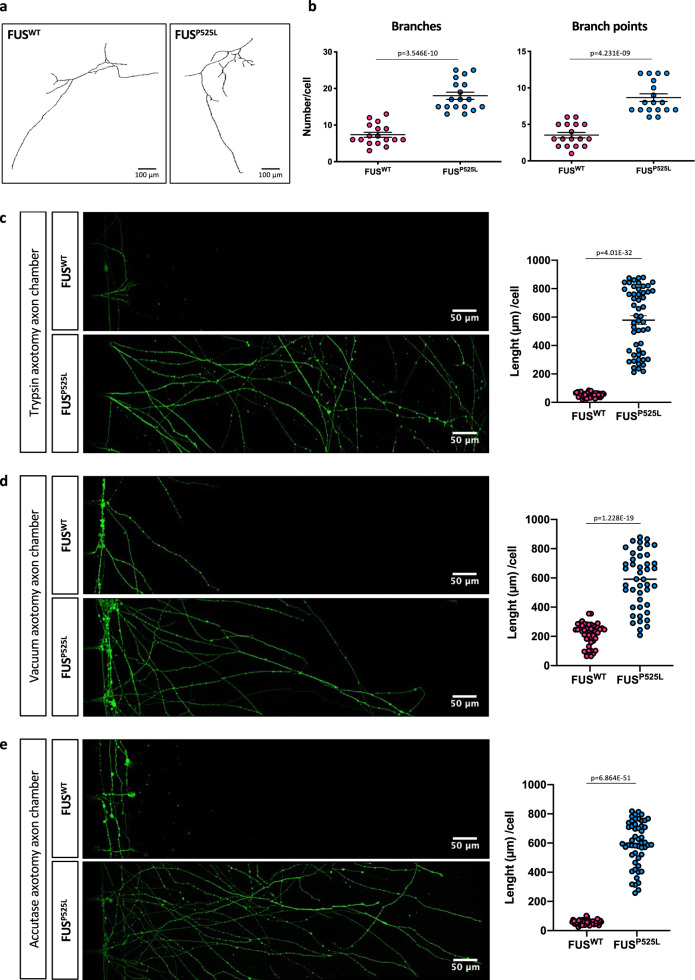
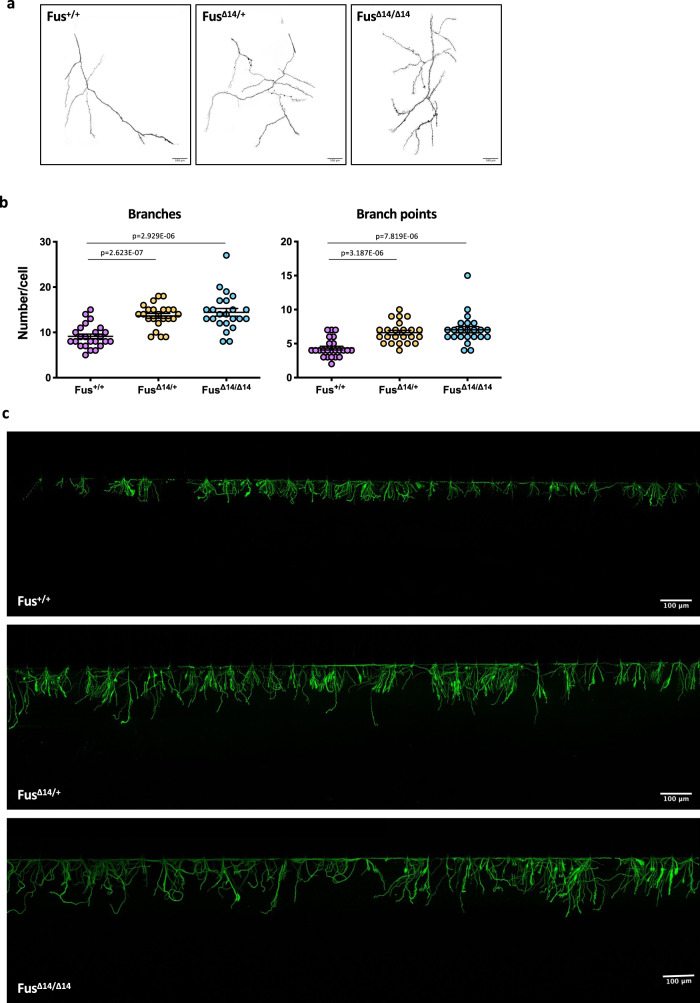
Mutations in the RNA-binding protein (RBP) FUS have been genetically associated with the motoneuron disease amyotrophic lateral sclerosis (ALS). Using both human induced pluripotent stem cells and mouse models, we found that FUS-ALS causative mutations affect the activity of two relevant RBPs with important roles in neuronal RNA metabolism: HuD/ELAVL4 and FMRP. Mechanistically, mutant FUS leads to upregulation of HuD protein levels through competition with FMRP for HuD mRNA 3'UTR binding. In turn, increased HuD levels overly stabilize the transcript levels of its targets, NRN1 and GAP43. As a consequence, mutant FUS motoneurons show increased axon branching and growth upon injury, which could be rescued by dampening NRN1 levels. Since similar phenotypes have been previously described in SOD1 and TDP-43 mutant models, increased axonal growth and branching might represent broad early events in the pathogenesis of ALS.


Conflict of interest statement

The authors declare no competing interests.

Figures

Fig. 1
Fig. 1. Increased HuD levels in human and mouse FUS-mutant MNs.
a, b HuD protein levels analysis by western blot in FUSWT and FUSP525L hiPSC-derived spinal MNs (a) and Fus-Δ14 mouse model spinal cord (P81) (b). The molecular weight (kDa) is indicated on the left. The graphs show the average from three independent biological replicates, error bars indicate the standard deviation (a Student’s t-test, paired, two tails; b ordinary one-way ANOVA, multiple comparisons). TUBB3/Tubb3 signal was used for normalization. Protein levels are relative to FUSWT (a) or Fus+/+ (b) conditions. c HuD mRNA analysis by FISH in FUSWT and FUSP525L hiPSC-derived spinal MNs. The graphs show the average count of HuD mRNA puncta per cell from three independent differentiation experiments, error bars indicate the standard error of the mean (Student’s t-test; paired; two tails). d, e Combined PURO-PLA (HuD, magenta) and immunostaining (TUBB3, green) analysis in FUSWT and FUSP525L hiPSC-derived spinal MNs (d) and primary MNs from Fus-Δ14 mouse embryos (E12.5–13.5) (e). DAPI (blue) was used for nuclear staining. d FUSP525L hiPSC-derived spinal MNs treated with the eukaryotic protein synthesis inhibitor anisomycin (ANISO) were used as negative control of the PURO-PLA. The graphs show the average count of HuD PURO-PLA puncta per cell from three independent differentiation experiments (d) and three samples (e), error bars indicate the standard error of the mean (d Student’s t-test, unpaired, two tails; e ordinary one-way ANOVA, multiple comparisons). Scale bars (ce): 10 μm.
Fig. 2
Fig. 2. FMRP and FUSP525L compete for HuD 3′UTR binding.
a Western blot analysis of the FMRP RIP assay. In input, IgG control immunoprecipitation with rabbit monoclonal anti-human, IgG antibod, IP samples immunoprecipitated with an anti-FMRP antibody. The molecular weight (kDa) is indicated on the left. b Analysis of MAP1B (positive control), ATP5O (negative control) and HuD mRNA levels by real time qRT-PCR in samples from FUSWT or FUSP525L hiPSC-derived spinal MNs. The graph shows the relative enrichment of the mRNAs pulled down by FMRP, reported as the percentage of input, in IP or control IgG samples, after normalization with an artificial spike RNA. The graphs show the average from five independent differentiation experiments and error bars indicate the standard deviation (Student’s t-test; unpaired; two tails). For anti-FMRP IP samples, yellow dots are related to samples immunoprecipitated with the ab17722 antibody and orange dots to samples immunoprecipitated with the f4055 antibody. c Schematic representation of the HuD transcript. The three regions of the 3′UTR (F1, F2, and F3) used for in vitro binding assays are shown. d The in vitro binding assay was performed by incubating biotinylated transcripts corresponding to HuD 3′UTR regions F1, F2, or F3, or a portion of the Renilla luciferase coding sequence used as negative control (Neg. C), with HeLa cytoplasmic extract, followed by pull-down with streptavidin-conjugated beads. Western blot analysis was then performed with anti-FMRP antibody to detect FMRP binding. Anti-GAPDH was used as negative control. Input: 10% of the pull-down input sample. The molecular weight (kDa) is indicated on the left. The histogram shows quantification from three independent experiments. Values were calculated as fraction of Input (Student’s t-test; paired; two tails). e The in vitro FMRP binding assay was repeated in presence of purified recombinant FUS proteins. F1 and F2 biotinylated transcripts were incubated with HeLa extract and purified RFP-flag-FUSP525L (indicated as P525L) or an RNA-binding deficient mutant derived from RFP-flag-FUSP525L (indicated as P525L 4F-L). Western blot analysis was performed after pull-down with streptavidin-conjugated beads with anti-FMRP, anti-flag, or anti-GAPDH antibody. Input: 10% of the pull-down input sample. The molecular weight (kDa) is indicated on the left. Histograms show quantification from three independent experiments. Values were calculated as fraction of Input and normalized to P525L (Student’s t-test; paired; two tails).
Fig. 3
Fig. 3. FMRP is a post-transcriptional repressor of HuD expression.
a Analysis of the protein levels of the indicated genes by western blot in FMRPWT and FMRPKO hiPSC-derived spinal MNs. The molecular weight (kDa) is indicated on the left. The graphs show the average from three independent differentiation experiments, error bars indicate the standard deviation (Student’s t-test; paired; two tails). TUBB3 signal was used for normalization. Protein levels are relative to FMRPWT conditions. b Analysis of the mRNA levels of the indicated genes by real-time qRT-PCR in FMRPWT and FMRPKO hiPSC-derived spinal MNs. For each experiment, values are shown as relative to the isogenic FMRPWT control, set to a value of 1. The graph shows the average from 3 to 5 independent differentiation experiments, error bars indicate the standard deviation (Student’s t-test; paired; two tails). c Luciferase assay in HeLa cells expressing RFP, RFP-FUSWT, or RFP-FUSP525L and transfected with the Renilla luciferase reporter construct containing the HuD 3′UTR (RLuc-HuD 3′UTR) alone (Mock) or in combination with plasmids overexpressing FMRP or eGFP as a control (Student’s t-test; paired; two tails). The drawing depicts the competition between mutant FUS and FMRP for HuD 3′UTR binding and its effects on the reporter construct.
Fig. 4
Fig. 4. Axonal phenotypes in hiPSC-derived spinal MNs.
a Representative images, generated with the Skeleton plugin of ImageJ, showing axons of FUSWT and FUSP525L hiPSC-derived MNs in the axon chamber of compartmentalized chips. Scale bar: 100 μm. b Quantitative analysis of the number of axon branches and branch points in cells shown in a. The graphs show the average from three independent differentiation experiments, error bars indicate the standard error of the mean (Student’s t-test; unpaired; two tails). ce Immunostaining of TUBB3 (green) in FUSWT and FUSP525L hiPSC-derived spinal MNs cultured in compartmentalized chips and allowed to recover for 30 h after the indicated treatments to induce axotomy in the axon chamber. Scale bar: 50 μm. Graphs show quantitative analysis of axon length from three independent differentiation experiments; error bars indicate the standard error of the mean (Student’s t-test; unpaired; two tails).
Fig. 5
Fig. 5. Axonal phenotypes in primary spinal MNs from Fus-Δ14 mouse models.
a Representative images, generated with the Skeleton plugin of ImageJ, showing axons of Fus+/+, and heterozygous (FusΔ14/+) or homozygous (FusΔ14/Δ14) FUS mutant mouse primary MNs in the axon chamber of compartmentalized chips. Scale bar: 100 μm. b Quantitative analysis of the number of axon branches and branch points in cells shown in a. The graphs show the average from three biological replicates, error bars indicate the standard error of the mean (Ordinary one-way ANOVA; multiple comparisons). c Immunostaining of Tubb3 (green) in Fus+/+, FusΔ14/+ and FusΔ14/Δ14 mouse primary MNs cultured in compartmentalized chips and allowed to recover for 30 h after trypsin treatment to induce axotomy in the axon chamber. Scale bar: 100 μm.
Fig. 6
Fig. 6. NRN1 levels are increased in mutant FUS MNs.
a Analysis of the mRNA levels of the indicated genes by real time qRT-PCR in FUSWT, FUSP525L and FUSWT overexpressing HuD or RFP, as a control, under the SYN1 promoter (FUSWT + HuD and FUSWT + RFP) hiPSC-derived spinal MNs. The graph shows the average from three or four independent differentiation experiments, error bars indicate the standard deviation (Student’s t-test; paired; two tails). b NRN1 mRNA analysis by FISH (red) in FUSWT and FUSP525L hiPSC-derived spinal MNs. DAPI (blue) was used for nuclear staining. Scale bar: 10 μm. Graphs show the average count of HuD mRNA puncta per cell and the puncta intensity from three independent differentiation experiments, error bars indicate the standard error of the mean (Student’s t-test; unpaired; two tails). c, d NRN1 protein levels analysis by western blot in FUSWT and FUSP525L hiPSC-derived spinal MNs (c) and Fus-Δ14 mouse model spinal cord (d). The molecular weight (kDa) is indicated on the left. The graphs show the average from three independent biological replicates, error bars indicate the standard deviation (ordinary one-way ANOVA; multiple comparisons). Tubb3 signal was used for normalization. Protein levels are relative to Fus+/+ conditions. e Immunostaining analysis of NRN1 in axons of FUSWT and FUSP525L hiPSC-derived spinal MNs. The graph shows the NRN1 signal intensity from four replicates from two differentiation experiments, error bars indicate the standard error of the mean (Student’s t-test; unpaired; two tails).
Fig. 7
Fig. 7. GAP43 levels are increased in mutant FUS MNs.
a GAP43 mRNA analysis by FISH (red) in FUSWT, FUSP525L, and FUSWT overexpressing HuD under the Syn1 promoter (FUSWT + HuD) hiPSC-derived spinal MNs. The graphs show the average count of HuD mRNA puncta per cell from three independent differentiation experiments, error bars indicate the standard error of the mean (Student’s t-test; unpaired; two tails). DAPI (blue) was used for nuclear staining. Scale bar: 10 μm. b GAP43 protein levels analysis by western blot in FUSWT and FUSP525L hiPSC-derived spinal MNs. The molecular weight (kDa) is indicated on the left. The graph shows the average from three independent differentiation experiments and error bars indicate the standard deviation (Student’s t-test; paired; two tails). Values in the y-axis represent GAP43/TUBB3 signal intensity. c Gap43 protein level analysis by western blot in mouse primary spinal MNs (P81). The molecular weight (kDa) is indicated on the left. The graphs show the average from three mice and error bars indicate the standard deviation. The differences are not significant for all pairs (ordinary one-way ANOVA; multiple comparisons). Values in the y-axis represent Gap43/Tubb3 signal intensity. d Immunostaining analysis in FUSWT and FUSP525L hiPSC-derived spinal MNs growth cones. GAP43 signal is magenta; PHALLOIDIN signal (marking growth cones) is green, TYR-TUBULIN (tyrosinated alpha-tubulin; marking axons) is white. Scale bar: 10 μm. The graph shows the GAP43 signal intensity from three differentiation experiments, error bars indicate the standard error of the mean (Student’s t-test; paired; two tails).
Fig. 8
Fig. 8. NRN1 knockdown rescues the aberrant axon growth phenotype in mutant FUS MNs.
a Analysis of the mRNA levels of the indicated genes by real time qRT-PCR in untransfected FUSWT and FUSP525L hiPSC-derived spinal MNs and FUSP525L hiPSC-derived spinal MNs transfected with non-targeting control siRNAs or siRNAs targeting NRN1. Values are shown as relative to untransfected FUSWT samples. The graph shows the average from three independent transfection experiments (indicated by different color of the dots), error bars indicate the standard deviation (Student’s t-test; paired; two tails). b Representative images, generated with the Skeleton plugin of ImageJ, showing axons of FUSP525L hiPSC-derived MNs, transfected with the indicated siRNA pools, in the axon chamber of compartmentalized chips. Scale bar: 100 μm. c Quantitative analysis of the number of axon branches and branch points. Immunostaining of TUBB3 was carried out 5 days after transfection of the indicated siRNA pools in FUSP525L hiPSC-derived MNs cultured in compartmentalized chips. The graphs show the average from five independent transfections of non-targeting or NRN1 siRNAs from three differentiation experiments, error bars indicate the standard error of the mean (Student’s t-test; unpaired; two tails). d Immunostaining of TUBB3 (green) in FUSP525L hiPSC-derived spinal MNs cultured in compartmentalized chips, transfected with non-targeting control siRNAs or siRNAs targeting NRN1, treated with trypsin in the axon chamber to induce axotomy after 24 h, and allowed to recover for 24 h. DAPI (blue) was used for nuclear staining. Scale bar: 100 μm. e Graph showing quantitative analysis of axon length in MNs treated as in d from seven independent transfections of non-targeting or NRN1 siRNAs from two differentiation experiments, error bars indicate the standard error of the mean (Student’s t-test; unpaired; two tails).
Fig. 9
Fig. 9. Model depicting the proposed molecular mechanism underlying HuD regulation by FMRP and mutant FUS.
The figure depicts a model of the competition between mutant FUS and FMRP for HuD 3′UTR binding. In FUSWT MNs, the FUS protein is predominantly localized in the nucleus. In the cytoplasm, FMRP binds HuD 3′UTR repressing its translation. NRN1 mRNAs are destabilized. In FUSP525L MNs, mutant FUS is partially delocalized to the cytoplasm and outcompetes FMRP binding on the HuD 3′UTR. As a consequence, increased HuD protein levels accumulate in FUS mutant MNs. HuD binding to NRN1 and GAP43 3′UTR leads to stabilization of these transcripts and higher protein levels. NRN1 increase underlies the aberrant axonal growth phenotypes.

References

    1. Brown RH, Al-Chalabi A. Amyotrophic lateral sclerosis. N. Engl. J. Med. 2017;377:162–172. doi: 10.1056/NEJMra1603471. - DOI - PubMed
    1. Dormann D, et al. ALS-associated fused in sarcoma (FUS) mutations disrupt transportin-mediated nuclear import. EMBO J. 2010;29:2841–2857. doi: 10.1038/emboj.2010.143. - DOI - PMC - PubMed
    1. Lagier-Tourenne C, et al. Divergent roles of ALS-linked proteins FUS/TLS and TDP-43 intersect in processing long pre-mRNAs. Nat. Neurosci. 2012;15:1488–1497. doi: 10.1038/nn.3230. - DOI - PMC - PubMed
    1. Klim JR, et al. ALS-implicated protein TDP-43 sustains levels of STMN2, a mediator of motor neuron growth and repair. Nat. Publ. Group. 2019;22:167–179. - PMC - PubMed
    1. Melamed Z, et al. Premature polyadenylation-mediated loss of stathmin-2 is a hallmark of TDP-43-dependent neurodegeneration. Nat. Publ. Group. 2019;22:180–190. - PMC - PubMed

Publication types