. 2021 Dec;26(12):7355-7362.
doi: 10.1038/s41380-021-01268-x. Epub 2021 Sep 1.

Abnormal levels of mitochondrial proteins in plasma neuronal extracellular vesicles in major depressive disorder

Affiliations

Abnormal levels of mitochondrial proteins in plasma neuronal extracellular vesicles in major depressive disorder

Edward J Goetzl et al. Mol Psychiatry. 2021 Dec.

Abstract

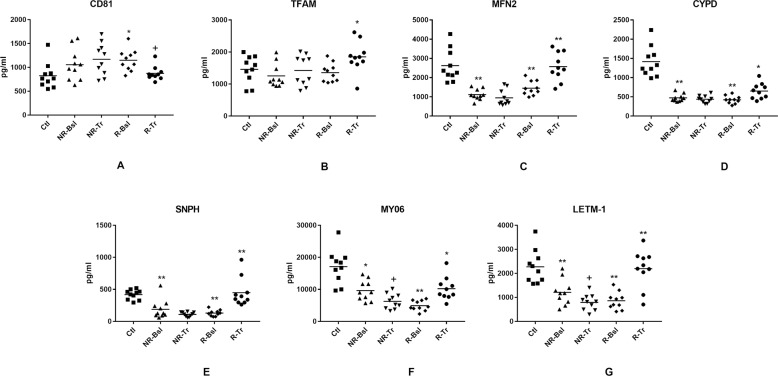
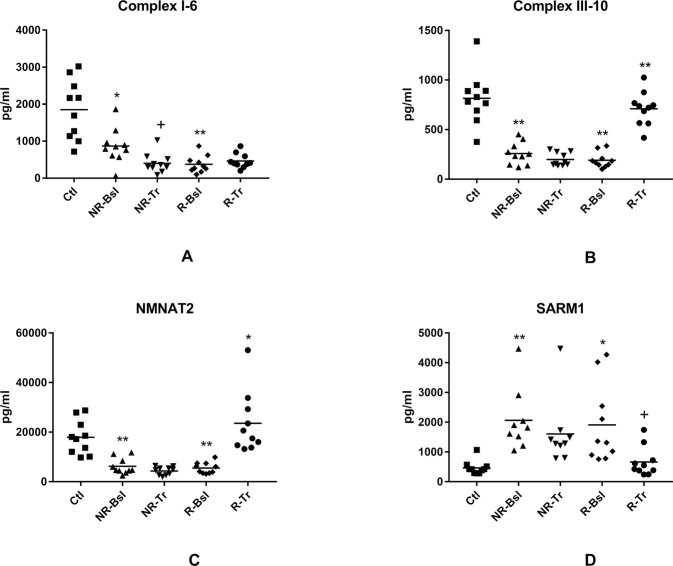
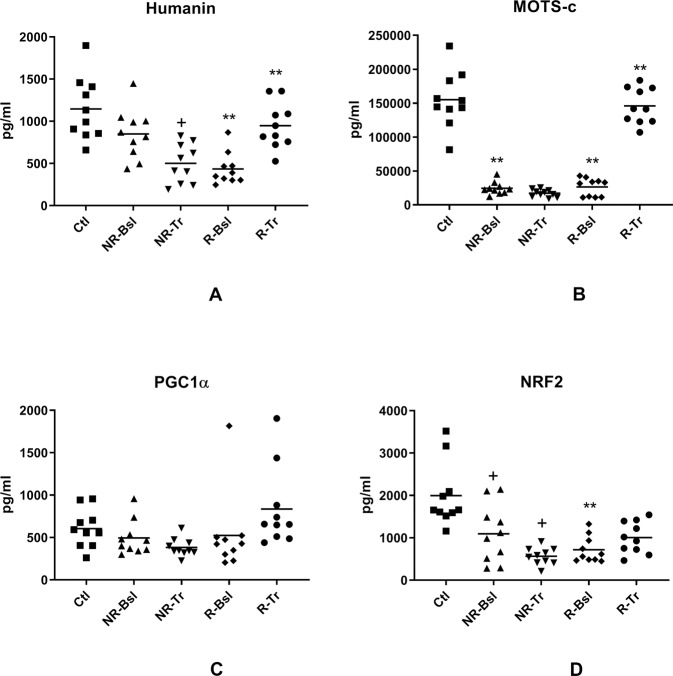
To characterize neuronal mitochondrial abnormalities in major depressive disorder (MDD), functional mitochondrial proteins (MPs) extracted from enriched plasma neuron-derived extracellular vesicles (NDEVs) of MDD participants (n = 20) were quantified before and after eight weeks of treatment with a selective serotonin reuptake inhibitor (SSRI). Pretreatment baseline NDEV levels of the transcriptional type 2 nuclear respiratory factor (NRF2) which controls mitochondrial biogenesis and many anti-oxidant gene responses, regulators of diverse neuronal mitochondrial functions cyclophilin D (CYPD) and mitofusin-2 (MFN2), leucine zipper EF-hand containing transmembrane 1 protein (LETM1) component of a calcium channel/calcium channel enhancer, mitochondrial tethering proteins syntaphilin (SNPH) and myosin VI (MY06), inner membrane electron transport complexes I (subunit 6) and III (subunit 10), the penultimate enzyme of nicotinamide adenine dinucleotide (NAD) generation nicotinamide mononucleotide adenylytransferase 2 (NMNAT2), and neuronal mitochondrial metabolic regulatory and protective factors humanin and mitochondrial open-reading frame of the 12S rRNA-c (MOTS-c) all were significantly lower than those of NDEVs from matched controls (n = 10), whereas those of pro-neurodegenerative NADase Sterile Alpha and TIR motif-containing protein 1 (SARM1) were higher. The baseline NDEV levels of transcription factor A mitochondrial (TFAM) and the transcriptional master-regulator of mitochondrial biogenesis PPAR γ coactivator-1α (PGC-1α) showed no differences between MDD participants and controls. Several of these potential biomarker proteins showed substantially different changes in untreated MDD than those we reported in untreated first-episode psychosis. NDEV levels of MPs of all functional classes, except complex I-6, NRF2 and PGC-1α were normalized in MDD participants who responded to SSRI therapy (n = 10) but not in those who failed to respond (n = 10) by psychiatric evaluation. If larger studies validate NDEV MP abnormalities, they may become useful biomarkers and identify new drug targets.


Conflict of interest statement

The authors declare no competing interests.

Figures

Fig. 1
Fig. 1. NDEV levels of proteins involved in mitochondrial dynamics and other maintenance functions.
Each point represents the value for one study participant after CD81 normalization. Statistical significance of non-responder baseline (NR-Bsl) and responder baseline (R-Bsl) abnormalities were calculated relative to control values by an unpaired t test and of changes after treatment relative to respective baseline values before treatment (NR-Tr vs. NR-Bsl and R-Tr vs. R-Bsl) by a paired t test; for both comparisons NS not significant; +, p < 0.05; *, p < 0.01; **, p < 0.001. The mean ± S.E.M. (p value) of control subjects (Ctl), baseline of nonresponsive participants (NR-Bsl), nonresponsive participants after treatment (NR-Tr), baseline of responsive participants (R-Bsl) and responsive participants after treatment (R-Tr), respectively, were 825 ± 85 pg/ml, 1058 ± 105 pg/ml (NS), 1171 ± 107 pg/ml (NS), 1151 ± 72 pg/ml (p = 0.0091) and 876 ± 46 pg/ml (p = 0.0157) for CD81 (A); 1458 ± 135 pg/ml, 1255 ± 117 pg/ml (NS), 1426 ± 149 pg/ml (NS), 1357 ± 92 pg/ml (NS) and 1848 ± 152 pg/ml (0.0039) for TFAM (B); 2623 ± 266 pg/ml, 1120 ± 89 pg/ml (<0.0001), 950 ± 129 pg/ml (NS), 1452 ± 117 pg/ml (0.0008) and 2572 ± 234 pg/ml (0.0002) for MFN2 (C); 1415 ± 125 pg/ml, 473 ± 31 pg/ml (<0.0001), 438 ± 30 pg/ml (NS), 424 ± 32 pg/ml (<0.0001) and 651 ± 65 pg/ml (0.0019) for CYPD (D); 1676 ± 97 pg/ml, 758 ± 188 pg/ml (0.0004), 440 ± 44 pg/ml (NS), 523 ± 60 pg/ml (<0.0001) and 1797 ± 283 pg/ml (0.0008) for SNPH (E); 17,105 ± 1684 pg/ml, 9659 ± 1008 pg/ml (0.0013), 6269 ± 745 pg/ml (0.0473), 4915 ± 504 pg/ml (<0.0001) and 10,248 ± 1144 pg/ml (0.0017) for MY06 (F); and 2275 ± 221 pg/ml, 1212 ± 169 pg/ml (0.0012), 796 ± 103 pg/ml (0.0412), 860 ± 114 pg/ml (<0.0001) and 2197 ± 248 pg/ml (0.0004) for LETM-1 (G). Mean ± S.E.M. of levels of the same mitochondrial proteins in NDEV of previously reported sets (n = 10) of controls and participants with a first episode of psychosis [16], respectively, were 632 ± 18.2 pg/ml and 628 ± 16.6 pg/ml (NS) for TFAM; 1953 ± 395 pg/ml and 347 ± 138 pg/ml (0.0012) for MFN2; 1456 ± 133 pg/ml and 227 ± 33.3 pg/ml (<0.0001) for CYPD; 2188 ± 259 pg/ml and 4008 ± 371 pg/ml (0.0007) for SNPH; 9599 ± 1098 pg/ml and 11240 ± 1758 pg/ml (NS) for MY06; and 2322 ± 251 pg/ml and 485 ± 52.4 pg/ml (<0.0001) for LETM-1.
Fig. 2
Fig. 2. NDEV levels of proteins involved in mitochondrial generation of energy.
Statistical methods and symbols are the same as in Fig. 1. The mean ± S.E.M. of Ctl, NR-Bsl, NR-Tr, R-Bsl and R-Tr groups, respectively, were 1852 ± 255 pg/ml, 867 ± 149 pg/ml (0.0037), 401 ± 83 pg/ml (0.0147), 374 ± 74 pg/ml (<0.0001) and 465 ± 63 pg/ml (NS) for Complex I-subunit 6 (A); 815 ± 83 pg/ml, 258 ± 35 pg/ml (≤0.0001), 199 ± 21 pg/ml (NS), 191 ± 25 pg/ml (<0.0001) and 710 ± 54 pg/ml (<0.0001) for Complex III-subunit 10 (B); 17,908 ± 2171 pg/ml, 6200 ± 1011 pg/ml (<0.0001), 4345 ± 507 pg/ml (NS), 5534 ± 711 pg/ml (<0.0001) and 23,564 ± 3932 pg/ml (0.0014) for NMNAT2 (C); and 466 ± 74 pg/ml, 2063 ± 351 pg/ml (0.0002), 2695 ± 1047 pg/ml (NS), 1908 ± 416 pg/ml (0.0031) and 664 ± 156 pg/ml (0.0368) for SARM1 (D). Mean ± S.E.M. of levels of the same mitochondrial proteins in NDEV of our previously reported sets (n = 10) of controls and participants with a first episode of psychosis [16], respectively, were 1574 ± 246 pg/ml and 542 ± 42.1 pg/ml (0.0007) for Complex I-subunit 6; 1404 ± 112 pg/ml and 635 ± 53.8 pg/ml (<0.0001) for Complex III-subunit 10; 7293 ± 825 pg/ml and 4804 ± 827 pg/ml (0.0471) for NMNAT2; and 974 ± 130 pg/ml and 1160 ± 75.4 pg/ml (NS) for SARM1.
Fig. 3
Fig. 3. NDEV levels of proteins involved in mitochondrial biogenesis and in mitochondrial regulation of neuronal metabolism and survival.
Statistical methods and symbols are the same as in Fig. 1. The mean ± S.E.M. of Ctl, NR-Bsl, NR-Tr, R-Bsl and R-Tr groups, respectively, were 1146 ± 118 pg/ml, 850 ± 93.8 pg/ml (NS), 500 ± 73.4 pg/ml (0.0308), 434 ± 59.9 pg/ml (<0.0001) and 947 ± 86.1 pg/ml (<0.0001) for humanin (A); 155,054 ± 13,122 pg/ml, 24,396 ± 2917 pg/ml (<0.0001), 17,126 ± 1757 pg/ml (NS), 26,252 ± 4184 pg/ml (<0.0001) and 145,947 ± 8370 pg/ml (<0.0001) for MOTS-c (B); 605 ± 71.2 pg/ml, 494 ± 65.1 pg/ml (NS), 382 ± 33.4 pg/ml (NS), 524 ± 148 pg/ml (NS) and 835 ± 149 pg/ml (NS) for PGC1α (C); and 1994 ± 240 pg/ml, 1096 ± 216 pg/ml (0.0122), 563 ± 64.2 pg/ml (0.0439), 719 ± 97.7 pg/ml (0.0001) and 1006 ± 119 pg/ml (NS) for NRF2 (D). Mean ± S.E.M. of levels of the same mitochondrial proteins in NDEV of our previously reported sets (n = 10) of controls and participants with a first episode of psychosis [16], respectively, were 1752 ± 288 pg/ml and 207 ± 26.1 pg/ml (<0.0001) for humanin; 169,267 ± 12,247 pg/ml and 20,782 ± 2506 pg/ml (0.0007) for MOTS-c; 860 ± 92.5 pg/ml and 675 ± 70.6 pg/ml (NS) for PGC1α; and 1486 ± 223 pg/ml and 556 ±54.6 pg/ml (0.0008) for NRF2.

References

    1. Ferrari AJ, Somerville AJ, Baxter AJ, Norman R, Patten SB, Vos T, et al. Global variation in the prevalence and incidence of major depressive disorder: a systematic review of the epidemiological literature. Psychol Med. 2013;43:471–81. doi: 10.1017/S0033291712001511. - DOI - PubMed
    1. Ferrari AJ, Charlson FJ, Norman RE, Patten SB, Freedman G, Murray CJ, et al. Burden of depressive disorders by country, sex, age, and year: findings from the global burden of disease study 2010. PLoS Med. 2013;10:e1001547. doi: 10.1371/journal.pmed.1001547. - DOI - PMC - PubMed
    1. Gaynes BN, Warden D, Trivedi MH, Wisniewski SR, Fava M, Rush AJ. What did STAR*D teach us? Results from a large-scale, practical, clinical trial for patients with depression. Psychiatr Serv. 2009;60:1439–45. doi: 10.1176/ps.2009.60.11.1439. - DOI - PubMed
    1. Lieblich SM, Castle DJ, Pantelis C, Hopwood M, Young AH, Everall IP. High heterogeneity and low reliability in the diagnosis of major depression will impair the development of new drugs. BJPsych Open. 2015;1:e5–e7. doi: 10.1192/bjpo.bp.115.000786. - DOI - PMC - PubMed
    1. Schatzberg AF. Can target engagement studies miss their targets and mislead drug development? Am J Psychiatry. 2021;178:372–4. doi: 10.1176/appi.ajp.2020.21030247. - DOI - PubMed

Publication types

MeSH terms

Substances